U.S. Vacation Rental Market Size & Outlook, 2023-2030
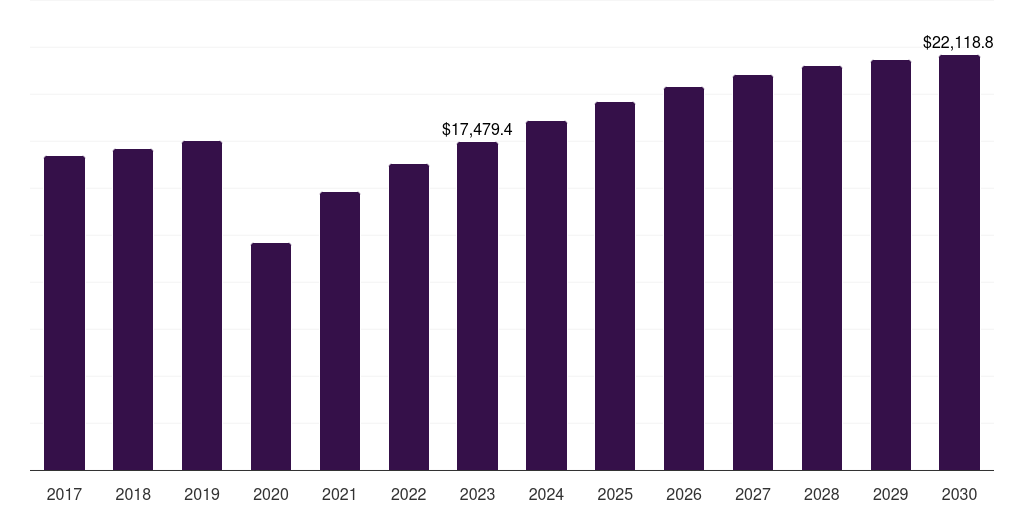
U.S. vacation rental market, 2017-2030 (US$M)
Related Markets
U.S. vacation rental market highlights
- The U.S. vacation rental market generated a revenue of USD 17,479.6 million in 2023 and is expected to reach USD 22,118.9 million by 2030.
- The U.S. market is expected to grow at a CAGR of 3.4% from 2024 to 2030.
- In terms of segment, home was the largest revenue generating rental type in 2023.
- Resort/Condominium is the most lucrative rental type segment registering the fastest growth during the forecast period.
Vacation rental market data book summary
| Market revenue in 2023 | USD 17,479.6 million |
| Market revenue in 2030 | USD 22,118.9 million |
| Growth rate | 3.4% (CAGR from 2023 to 2030) |
| Largest segment | Home |
| Fastest growing segment | Resort/Condominium |
| Historical data | 2017 - 2022 |
| Base year | 2023 |
| Forecast period | 2024 - 2030 |
| Quantitative units | Revenue in USD million |
| Market segmentation | Home, Apartments, Resort/Condominium |
| Key market players worldwide | Airbnb Inc Ordinary Shares - Class A, Booking Holdings Inc, Expedia Group Inc, MakeMyTrip Ltd, Tripadvisor Inc, Wyndham Destinations, 9flats, Hotelplan Group, Novasol, OYO |
Other key industry trends
- In terms of revenue, U.S. accounted for 19.6% of the global vacation rental market in 2023.
- Country-wise, U.S. is expected to lead the global market in terms of revenue in 2030.
- In North America, U.S. vacation rental market is projected to lead the regional market in terms of revenue in 2030.
- Canada is the fastest growing regional market in North America and is projected to reach USD 2,754.4 million by 2030.
Home was the largest segment with a revenue share of 47.1% in 2023. Horizon Databook has segmented the U.S. vacation rental market based on home, apartments, resort/condominium covering the revenue growth of each sub-segment from 2017 to 2030.
In 2018, Holidu, a search engine for vacation rentals, noted some interesting trends in the U.S. vacation rental market. As per the research, Wyoming is the most expensive destination for vacation rentals around the 4th of July. Whereas, Nantucket becomes more expensive around Independence Day, as compared to other popular summer vacation destinations.
During this peak time it charges nearly USD 978 per night; close behind are Montauk, The Hamptons, Long Island, Newport Beach, Half Moon Bay, Santa Barbara, Palm Springs, San Diego, and Lake Tahoe. As per the U.S.
As per a study published by STR and Air DNA, rental occupancy dropped 45.1% for one-bedroom and studio rentals, as well as 46.2% for two or more-bedroom rentals, whereas hotel occupancy fell by 77.3% at the end of March 2020 as compared to 2019.
No credit card required*
Horizon in a snapshot
- 30K+ Global Market Reports
- 120K+ Country Reports
- 1.2M+ Market Statistics
- 200K+ Company Profiles
- Industry insights and more
Vacation Rental Market Scope
Vacation Rental Market Companies
| Name | Profile | # Employees | HQ | Website |
|---|
U.S. vacation rental market size, by rental type, 2017-2030 (US$M)
U.S. Vacation Rental Market Outlook Share, 2023 & 2030 (US$M)
Related regional statistics
Sign up - it's easy, and free!
Sign up and get instant basic access to databook, upgrade
when ready, or enjoy our
free plan indefinitely.
Included in Horizon account
- 30K+ Global Market Reports
- 120K+ Country Reports
- 1.2M+ Market Statistics
- 200K+ Company Profiles
- Industry insights and more


