The global alginate market size was valued at USD 728.4 million in 2020 and is expected to grow at a compound annual growth rate (CAGR) of 5.0% from 2021 to 2028. The market is expected to witness significant growth owing to the increasing product demand in the food applications as a thickening agent, emulsifier, and gelling agent. Increased acceptance from the food industry and higher demand for natural ingredients are the key drivers for product demand. In addition, regulatory grants received from various organizations like the U.S. Food & Drug Administration (FDA) and the European Commission are expected to drive the growth of the global market. Globally, U.S. is one of the leading markets with high product penetration across the pharmaceutical application industry.
The wound care market in the country is considerably developed and uses alginate in several advanced wound care products. The use of calcium and sodium alginate fibers for wound care is also expected to augment the market over the forecast period. Brown seaweeds are the primary source of alginate. Durvillaea, Laminaria, Ascophyllum, Lessonia, Ecklonia, Sargassum, Turbinaria, and Macrocystis are the other commercial sources of the product. Ascophyllum, Laminaria, and Macrocystis are the most widely harvested species.
Countries like Norway, Chile, and China account for the high production of seaweed leading to the manufacturers setting the production units near the harvest areas. The higher cost involved in the drying of wet seaweed and the raw material supply-demand gap increases the procurement cost, which is reflected in the higher cost of finished products.
The product has a wide application scope in the pharmaceutical sector as it acts as a thickening agent, emulsion stabilizer, film-forming agent, and disintegrant for tablets. Growing product demand in the coating of tablets with low viscosity is expected to fuel the market growth. The market is constantly challenged by the volatile supply quantity of the seaweeds owing to unsustainable production techniques, which may hinder overall growth to some extent.
In terms of revenue, the high G type dominated the global market with a share of over 52% in 2020 and is expected to retain the leading position over the forecast period. High G is rich in guluronic acid blocks that have a wide range of applications in the cosmetics, food, and pharmaceutical industries. Superior gelling performance is responsible for the higher demand for these products in food applications.
Based on types, the market has been bifurcated into high G and high M. The amount of G and M blocks in the composition of the product is responsible for the performance characteristics of the products. The ratio of M and G in the product determines the gelling and thickening abilities of alginates.
A higher concentration of the G blocks in high G products leads to increased stabilization and thickness. They exhibit buckled chain structure and slower gel formation compared to the high M. Higher product flexibility offered by the high G type is drives its demand in the pharmaceutical industry.
The high M type segment is also expected to witness a steady growth rate of 4.7% over the forecast period. These products form gels quicker as compared to high G products leading to higher application in the cosmetic and food industries. Increasing usage of high M type products, such as beers, ice-creams, and yogurts, is expected to drive the segment growth.
In terms of revenue, propylene glycol led the market with a revenue share of more than 38% in 2020. It is expected to maintain its dominance growing at the fastest CAGR over the forecast period. It is an ester of alginic acid with applications as stabilizers, thickeners, and emulsifiers in the pharmaceutical, food, personal care, and cosmetics industries. These products having approval from the FDA as a food additive adds up to the demand growth.
Sodium emerged as the second-largest product in the market with a revenue share of over 32% in 2020. It is a white-yellowish powder extracted from cell walls of brown algae and widely used as a gelling and thickening agent in the food industry. It is primarily used in the production of sauces, whipped cream, jellies, and other dressings. It also offers superior stability to dairy products leading to increased demand.
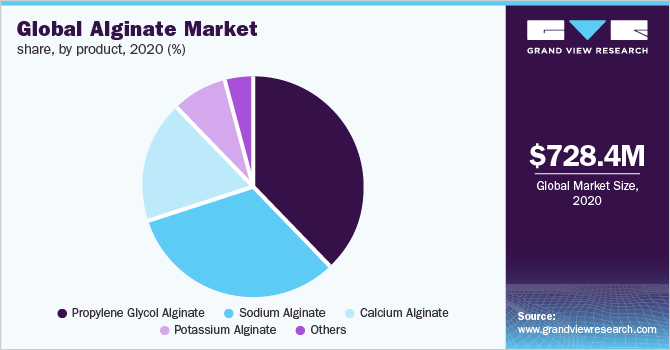
Calcium alginates are widely used in pharmaceutical applications like wound care and wound dressing products. The calcium-based fibers enable accelerated healing. Furthermore, in North America and Europe, calcium alginate is approved to be used as an anti-foaming agent in the food industry. It is used as a thickener to increase the viscosity of food products, which is expected to drive the segment growth over the forecast period.
Potassium alginate is a potassium salt of alginic acid and has extensive application in the pharmaceutical industry owing to superior thickening and stabilizing properties. It helps in the reduction of blood sugar and cholesterol levels in humans, which is expected to increase its application in the pharmaceutical industry, thereby supporting the segment growth.
In terms of revenue, industrial application dominated the industry with a share of 38.99% in 2020 and is expected to maintain a dominating position over the forecast period. Alginates have an industrial application in textile printing where they are used as a thickening agent as they combine cellulose in fibers. They are used as a substitute for starches as the latter react with reactive dyes, which leads to lower color yield.
They are also used in paper manufacturing for surface resizing. The product is used with starches providing smooth, continuous film and reduced paper fluffing. Alginate as an ingredient in wax papers helps to keep wax on the paper surface. It also acts as a film former and improves the printability of the paper.
The pharmaceutical segment is projected to register the fastest CAGR from 2021 to 2028 owing to high product demand due to its excellent healing capabilities in dry as well as wet conditions. The product also helps in the controlled release of medicines in drugs and can act as disintegrants, which also drive its demand in the pharmaceutical industry. The food and beverages segment is expected to witness a significant CAGR over the forecast period. Increasing demand for food products containing natural ingredients is expected to drive the segment growth.
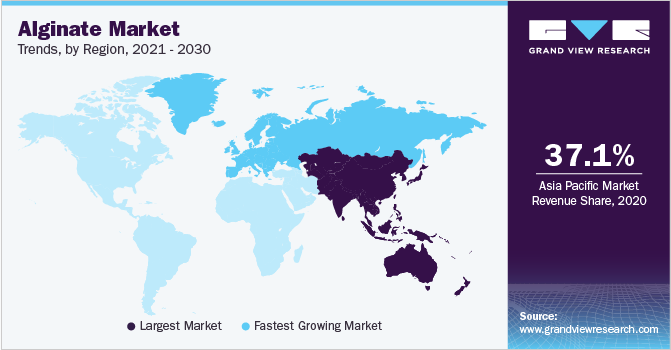
In terms of volume, Asia Pacific region dominated the market with a share of 37.05% in 2020 and is expected to maintain the leading position over the forecast period. The presence of numerous manufacturers and the easy availability of raw materials are responsible for the region’s growth. The presence of a large consumer base in countries like China and India also drives the regional alginate market.
In terms of revenue, Europe is the leading regional market. Increasing expenditure on research and development in the pharmaceutical industry is expected to drive the product demand, thereby augmenting market growth over the forecast period.
Moreover, increasing consumption by other end-use industries in the leading economies like Germany, France, and the U.K. is supporting the regional market growth. The growing food processing industry in the region has fueled product consumption, which is supported by the approval for its usage in food items from the European Commission under EC 1333/2008.
The market in North American is primarily driven by the highly developed pharmaceutical and food and beverages industries in the region. Higher per capita health care spending in the North American countries is expected to boost product demand in pharmaceutical applications. In addition, the presence of multiple global giants in the food & beverages and pharmaceutical industries is expected to augment the market growth.
The industry is highly competitive with the presence of a large number of product manufacturers. A significant consumer base and abundant availability of raw material in the Asia Pacific region are responsible for the maximum number of manufacturers and higher product consumption in the region. Companies are continuously making efforts to locate the manufacturing plants near the seaweed harvest areas to reduce the cost of material and transports. Some of the prominent manufacturers in the global alginate market include:
Algaia
Marine Biopolymers Limited
DuPont de Nemours, Inc.
Ingredients Solutions, Inc.
KIMICA
Ceamsa
Algea
Shandong Jiejing Group Corporation
In March 2023, Algaia SA was acquired by JRS Group, a leading hydrocolloid and fiber company that uses plant-based raw materials. The acquisition would enable the companies to jointly address the rising demand for alginate and seaweed-based solutions globally, catering to the feed, food, pharma, home & personal care, and agriculture sectors
In February 2023, Algaia announced the commencement of the expansion work of its R&D center premises in Saint Lô, France, with the aid of fundings obtained from Saint Lô Agglo. The project involves the building of new laboratories with advanced equipment, along with a workshop for producing seaweed extracts on a semi-industrial scale, before being manufactured at the company’s Lannilis plant on an industrial scale
In October 2022, KIMICA announced the opening of a new R&D facility, “KIMICA HONKAN”, in Futtsu-city, Chiba-Prefecture. The facility brings together quality control labs, R&D labs, office spaces, and welfare facilities; KIMICA also unveiled 2 warehouses for supporting this expansion. The lab area includes a “Food Application Laboratory” for the development of innovative alginate applications, while the quality control department has been developed to comply with pharmaceutical cGMP guidelines
In September 2021, Tilley Distribution announced the acquisition of Ingredients Solutions Inc., a blender and distributor of hydrocolloids based in Maine, U.S. The deal made Tilley the largest independent hydrocolloid distributor in North America and greatly expanded its portfolio of specialty ingredients. As per the deal, Tilley retained the R&D laboratory of Ingredients Solutions in Waldo, Maine, along with its employees
Report Attribute |
Details |
Market size value in 2021 |
USD 759.8 million |
Market size volume in 2021 |
44,480.7 tons |
Revenue forecast in 2028 |
USD 1,074.4 million |
Volume forecast in 2028 |
59,139.2 tons |
Growth Rate |
CAGR of 5.0% from 2021 to 2028 (Revenue-based) |
Base year for estimation |
2020 |
Historical data |
2017 - 2019 |
Forecast period |
2021 - 2028 |
Quantitative units |
Volume in tons, revenue in USD million, and CAGR from 2021 to 2028 |
Report coverage |
Revenue forecast, company ranking, competitive landscape, growth factors, and trends |
Segments covered |
Type, product, application, region |
Regional scope |
North America; Europe; Asia Pacific; Central & South America; MEA |
Country scope |
U.S.; Canada; Mexico; U.K.; Germany; France; Italy; Spain; China; India; Japan; South Korea; Brazil; Saudi Arabia; South Africa |
Key companies profiled |
Algaia; Marine Biopolymers Ltd.; DuPont de Nemours, Inc.; Ingredients Solutions, Inc.; KIMICA; Ceamsa; Algea; Shandong Jiejing Group Corp. |
Customization scope |
Free report customization (equivalent to up to 8 analysts working days) with purchase. Addition or alteration to country, regional & segment scope. |
Pricing and purchase options |
Avail customized purchase options to meet your exact research needs. Explore purchase options |
This report forecasts revenue growth at the global, regional, and country levels and provides an analysis of the latest industry trends in each of the sub-segments from 2017 to 2028. For the purpose of this study, Grand View Research has segmented the global alginate market report on the basis of type, product, application, and region:
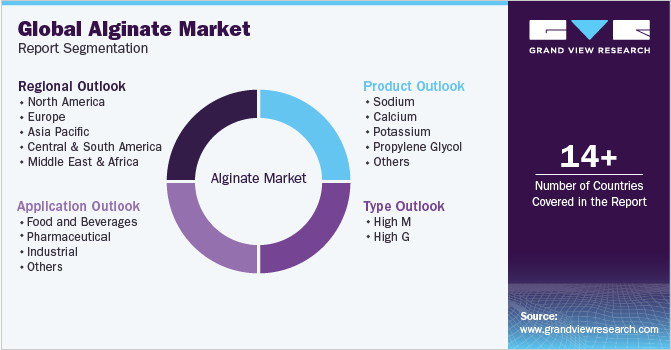
Type Outlook (Volume, Tons; Revenue, USD Million, 2017 - 2028)
High M
High G
Product Outlook (Volume, Tons; Revenue, USD Million, 2017 - 2028)
Sodium
Calcium
Potassium
Propylene Glycol
Others
Application Outlook (Volume, Tons; Revenue, USD Million, 2017 - 2028)
Food and Beverages
Bakery
Confectionery
Meat Products
Dairy Products
Sauces & Dressings
Beverages
Others
Pharmaceutical
Industrial
Others
Regional Outlook (Volume, Tons; Revenue, USD Million, 2017 - 2028)
North America
U.S.
Canada
Mexico
Europe
Germany
U.K.
France
Italy
Spain
Asia Pacific
China
India
Japan
South Korea
Central & South America
Brazil
Middle East & Africa
South Africa
Saudi Arabia
b. The global alginate market was estimated at USD 728.4 million in 2020 and is expected to reach USD 759.8 million in 2021.
b. The global alginate market is expected to grow at a compound annual growth rate of 5% from 2021 to 2028 to reach USD 1,074.4 million by 2028.
b. The Asia Pacific emerged as a dominating region with a volume share of 37.05% in the year 2020 owing to the presence of several alginates manufactures, higher raw material availability, and a higher consumer base in the countries like India and China.
b. The key player in the global alginate market includes Algaia, Marine Biopolymers Limited, DuPont de Nemours, Inc, Ingredients Solutions, Inc., KIMICA, Ceamsa, Algae, SNAP Natural & Alginate Products Pvt. Ltd, Shandong Jiejing Group Corporation, IRO Alginate Industry Co., Ltd.
b. Increasing demand for natural ingredients from the food and beverage industry as well as the pharmaceutical industry owing to higher consumer awareness is expected to drive the alginate market growth.
Table of Contents
Chapter 1 Alginate Market: Methodology and Scope
1.1 Information Procurement
1.1.1 Purchased Database
1.1.2 Gvr’s Internal Database
1.1.3 Secondary Sources
1.1.4 Third Party Perspective
1.1.5 Primary Research
1.2 Information Analysis & Data Analysis Models
1.3 List of Data Sources
Chapter 2 Alginate Market: Executive Summary
2.1 Market Insights
2.2 Segmental Insights
2.3 Competitive Insights
Chapter 3 Alginate Market: Variables, Trends, and Scope
3.1 Market Lineage Outlook
3.1.1 Parent Market Outlook: Gums and Thickeners Market
3.1.2 Related Market Outlook: Xanthan Market
3.2 Penetration & Growth Prospect Mapping
3.3 Industry Value Chain Analysis
3.3.1 Raw Material Trends
3.3.1.1 Major Raw Material Analysis
3.3.1.2 Procurement Best Practices
3.3.2 Manufacturing Trends
3.3.2.1 Calcium Alginate Process
3.3.2.2 Alginic Acid Process
3.3.3 Sales Channel Analysis
3.3.3.1 Direct to Consumer
3.3.3.2 Distributors
3.3.3.3 Online Mode of Distribution
3.4 Technology Overview
3.5 Vendor Selection Criteria
3.6 Regulatory Framework
3.7 Market Dynamics
3.7.1 Market Driver Analysis
3.7.1.1 Growth of Food Industry
3.7.1.2 Growing Pharmaceutical Sector
3.7.2 Market Restraint Analysis
3.7.2.1 Volatile Production of Seaweed
3.7.3 Industry Challenges
3.8 Business Environment Analysis
3.8.1 Porter’s Analysis
3.8.1.1 Competitive Rivalry
3.8.1.2 Bargaining Power of Buyers
3.8.1.3 Bargaining Power of Suppliers
3.8.1.4 Threat of New Entrants
3.8.1.5 Threat of Substitutes
3.8.2 PESTEL ANALYSIS
3.8.2.1 Political
3.8.2.2 Economic
3.8.2.3 Social
3.8.2.4 Technological
3.8.2.5 Environmental
3.8.2.6 Legal
3.8.3 Major Deals & Strategic Alliances
3.8.3.1 Mergers & Acquisitions
3.8.3.2 Capacity Expansion
3.8.3.3 Product Development & Innovations
3.9 Market Strategies
3.9.1 IMPACTS OF COVID-19
Chapter 4 Alginate Market: Type Estimates & Trend Analysis
4.1 Type Movement Analysis & Market Share, 2020 & 2028
4.2 High M
4.2.1 Global High M Alginate Market Estimates and Forecasts, 2017 - 2028 (Tons) (USD Million)
4.3 High G
4.3.1 Global High G Alginate Market Estimates and Forecasts, 2017 - 2028 (Tons) (USD Million)
Chapter 5 Alginate Market: Product Estimates & Trend Analysis
5.1 Product Movement Analysis & Market Share, 2020 & 2028
5.2 Sodium Alginate
5.2.1 Global Sodium Alginate Market Estimates and Forecasts, 2017 - 2028 (Tons) (USD Million)
5.3 Calcium Alginate
5.3.1 Global Calcium Alginate Market Estimates and Forecasts, 2017 - 2028 (Tons) (USD Million)
5.4 Potassium Alginate
5.4.1 Global Potassium Alginate Market Estimates and Forecasts, 2017 - 2028 (Tons) (USD Million)
5.5 Propylene Glycol Alginate
5.5.1 Global Propylene Glycol Alginate Market Estimates and Forecasts, 2017 - 2028 (Tons) (USD Million)
5.6 Others
5.6.1 Global Other Alginate Market Estimates and Forecasts, 2017 - 2028 (Tons) (USD Million)
Chapter 6 Alginate Market: Application Estimates & Trend Analysis
6.1 Application Movement Analysis & Market Share, 2020 & 2028
6.2 Food & Beverages
6.2.1 Global Alginate Market Estimates and Forecasts, In Food & Beverages, 2017 - 2028 (Tons) (USD Million)
6.2.2 Bakery
6.2.2.1 Global Alginate Market Estimates and Forecasts, in bakery applications, 2017 - 2028 (Tons) (USD Million)
6.2.3 Confectionery
6.2.3.1 Global Alginate Market Estimates and Forecasts, in confectionery applications, 2017 - 2028 (Tons) (USD Million)
6.2.4 Meat Products
6.2.4.1 Global Alginate Market Estimates and Forecasts, in meat products applications, 2017 - 2028 (Tons) (USD Million)
6.2.5 Dairy Products
6.2.5.1 Global Alginate Market Estimates and Forecasts, in dairy products applications, 2017 - 2028 (Tons) (USD Million)
6.2.6 Sauces & Dressings
6.2.6.1 Global Alginate Market Estimates and Forecasts, in sauces & dressings applications, 2017 - 2028 (Tons) (USD Million)
6.2.7 Beverage
6.2.7.1 Global Alginate Market Estimates and Forecasts, in beverage applications, 2017 - 2028 (Tons) (USD Million)
6.2.8 Other
6.2.8.1 Global Alginate Market Estimates and Forecasts, in other applications, 2017 - 2028 (Tons) (USD Million)
6.3 Pharmaceutical
6.3.1 Global Alginate Market Estimates and Forecasts, In Pharmaceutical, 2017 - 2028 (Tons) (USD Million)
6.4 Industrial
6.4.1 Global Alginate Market Estimates and Forecasts, In Industrial Applications, 2017 - 2028 (Tons) (USD Million)
6.5 Others
6.5.1 Global Alginate Market Estimates and Forecasts, In Other Applications, 2017 - 2028 (Tons) (USD Million)
Chapter 7 Alginate Market: Regional Estimates & Trend Analysis
7.1 Regional Market Snapshot
7.2 Regional movement & market share analysis, 2020 & 2028
7.3 North America
7.3.1 North America Alginate Market Estimates and Forecasts, 2017 - 2028 (Tons) (USD Million)
7.3.2 North America Alginate Market Estimates and Forecasts, By Type, 2017 - 2028 (Tons) (USD Million)
7.3.3 North America Alginate Market Estimates and Forecasts, By Product, 2017 - 2028 (Tons) (USD Million)
7.3.4 North America Alginate Market Estimates and Forecasts, By Application, 2017 - 2028 (Tons) (USD Million)
7.3.4.1 North America Alginate Market Estimates and Forecasts, by food & Beverage application, 2017 - 2028 (Tons) (USD Million)
7.3.5 The U.S.
7.3.5.1 The U.S. Alginate Market Estimates and Forecasts, 2017 - 2028 (Tons) (USD Million)
7.3.5.2 The U.S. Alginate Market Estimates and Forecasts, By Type, 2017 - 2028 (Tons) (USD Million)
7.3.5.3 The U.S. Alginate Market Estimates and Forecasts, By Product, 2017 - 2028 (Tons) (USD Million)
7.3.5.4 The U.S. Alginate Market Estimates and Forecasts, By Application, 2017 - 2028 (Tons) (USD Million)
7.3.5.4.1 The U.S. Alginate Market Estimates and Forecasts, By Food & Beverage Application, 2017 - 2028 (Tons) (USD Million)
7.3.6 Canada
7.3.6.1 Canada Alginate Market Estimates and Forecasts, 2017 - 2028 (Tons) (USD Million)
7.3.6.2 Canada Alginate Market Estimates and Forecasts, By Type, 2017 - 2028 (Tons) (USD Million)
7.3.6.3 Canada Alginate Market Estimates and Forecasts, By Product, 2017 - 2028 (Tons) (USD Million)
7.3.6.4 Canada Alginate Market Estimates and Forecasts, By Application, 2017 - 2028 (Tons) (USD Million)
7.3.6.4.1 Canada alginate Market Estimates and Forecasts, by food & Beverage application, 2017 - 2028 (Tons) (USD Million)
7.3.7 Mexico
7.3.7.1 Mexico Alginate Market Estimates and Forecasts, 2017 - 2028 (Tons) (USD Million)
7.3.7.2 Mexico Alginate Market Estimates and Forecasts, By Type, 2017 - 2028 (Tons) (USD Million)
7.3.7.3 Mexico Alginate Market Estimates and Forecasts, By Product, 2017 - 2028 (Tons) (USD Million)
7.3.7.4 Mexico Alginate Market Estimates and Forecasts, By Application, 2017 - 2028 (Tons) (USD Million)
7.3.7.4.1 Mexico Alginate Market Estimates and Forecasts, By Food & Beverage Application, 2017 - 2028 (Tons) (USD Million)
7.4 Europe
7.4.1 Europe Alginate Market Estimates and Forecasts, 2017 - 2028 (Tons) (USD Million)
7.4.2 Europe Alginate Market Estimates and Forecasts, By Type, 2017 - 2028 (Tons) (USD Million)
7.4.3 Europe Alginate Market Estimates and Forecasts, By Product, 2017 - 2028 (Tons) (USD Million)
7.4.4 Europe Alginate Market Estimates and Forecasts, By Application, 2017 - 2028 (Tons) (USD Million)
7.4.4.1 Europe alginate Market Estimates and Forecasts, by food & Beverage application, 2017 - 2028 (Tons) (USD Million)
7.4.5 Germany
7.4.5.1 Germany Alginate Market Estimates and Forecasts, 2017 - 2028 (Tons) (USD Million)
7.4.5.2 Germany Alginate Market Estimates and Forecasts, By Type, 2017 - 2028 (Tons) (USD Million)
7.4.5.3 Germany Alginate Market Estimates and Forecasts, By Product, 2017 - 2028 (Tons) (USD Million)
7.4.5.4 Germany Alginate Market Estimates and Forecasts, By Application, 2017 - 2028 (Tons) (USD Million)
7.4.5.4.1 Germany Alginate Market Estimates and Forecasts, By Food & Beverage Application, 2017 - 2028 (Tons) (USD Million)
7.4.6 The U.K.
7.4.6.1 The U.K. Alginate Market Estimates and Forecasts, 2017 - 2028 (Tons) (USD Million)
7.4.6.2 The U.K. Alginate Market Estimates and Forecasts, By Type, 2017 - 2028 (Tons) (USD Million)
7.4.6.3 The U.K. Alginate Market Estimates and Forecasts, By Product, 2017 - 2028 (Tons) (USD Million)
7.4.6.4 The U.K. Alginate Market Estimates and Forecasts, By Application, 2017 - 2028 (Tons) (USD Million)
7.4.6.4.1 The U.K. alginate Market Estimates and Forecasts, By Food & Beverage Application, 2017 - 2028 (Tons) (USD Million)
7.4.7 France
7.4.7.1 France Alginate Market Estimates and Forecasts, 2017 - 2028 (Tons) (USD Million)
7.4.7.2 France Alginate Market Estimates and Forecasts, By Type, 2017 - 2028 (Tons) (USD Million)
7.4.7.3 France Alginate Market Estimates and Forecasts, By Product, 2017 - 2028 (Tons) (USD Million)
7.4.7.4 France Alginate Market Estimates and Forecasts, By Application, 2017 - 2028(Tons) (USD Million)
7.4.7.4.1 France alginate Market Estimates and Forecasts, By Food & Beverage Application, 2017 - 2028 (Tons) (USD Million)
7.4.8 Italy
7.4.8.1 Italy Alginate Market Estimates and Forecasts, 2017 - 2028 (Tons) (USD Million)
7.4.8.2 Italy Alginate Market Estimates and Forecasts, By Type, 2017 - 2028 (Tons) (USD Million)
7.4.8.3 Italy Alginate Market Estimates and Forecasts, By Product, 2017 - 2028 (Tons) (USD Million)
7.4.8.4 Italy Alginate Market Estimates and Forecasts, By Application, 2017 - 2028 (Tons) (USD Million)
7.4.8.4.1 Italy Alginate Market Estimates and Forecasts, By Food & Beverage Application, 2017 - 2028 (Tons) (USD Million)
7.4.9 Spain
7.4.9.1 Spain Alginate Market Estimates and Forecasts, 2017 - 2028 (Tons) (USD Million)
7.4.9.2 Spain Alginate Market Estimates and Forecasts, By Type, 2017 - 2028 (Tons) (USD Million)
7.4.9.3 Spain Alginate Market Estimates and Forecasts, By Product, 2017 - 2028 (Tons) (USD Million)
7.4.9.4 Spain Alginate Market Estimates and Forecasts, By Application, 2017 - 2028 (Tons) (USD Million)
7.4.9.4.1 Spain Alginate Market Estimates and Forecasts, By Food & Beverage Application, 2017 - 2028 (Tons) (USD Million)
7.5 Asia Pacific
7.5.1 Asia Pacific Alginate Market Estimates and Forecasts, 2017 - 2028 (Tons) (USD Million)
7.5.2 Asia Pacific Alginate Market Estimates and Forecasts, By Type, 2017 - 2028 (Tons) (USD Million)
7.5.3 Asia Pacific Alginate Market Estimates and Forecasts, By Product, 2017 - 2028 (Tons) (USD Million)
7.5.4 Asia Pacific Alginate Market Estimates and Forecasts, By Application, 2017 - 2028 (Tons) (USD Million)
7.5.4.1 Asia Pacific Alginate Market Estimates and Forecasts, By Food & Beverage Application, 2017 - 2028 (Tons) (USD Million)
7.5.5 China
7.5.5.1 China Alginate Market Estimates and Forecasts, 2017 - 2028 (Tons) (USD Million)
7.5.5.2 China Alginate Market Estimates and Forecasts, By Type, 2017 - 2028 (Tons) (USD Million)
7.5.5.3 China Alginate Market Estimates and Forecasts, By Product, 2017 - 2028 (Tons) (USD Million)
7.5.5.4 China Alginate Market Estimates and Forecasts, By Application, 2017 - 2028 (Tons) (USD Million)
7.5.5.4.1 China Alginate Market Estimates and Forecasts, By Food & Beverage Application, 2017 - 2028 (Tons) (USD Million)
7.5.6 India
7.5.6.1 India Alginate Market Estimates and Forecasts, 2017 - 2028 (Tons) (USD Million)
7.5.6.2 India Alginate Market Estimates and Forecasts, By Type, 2017 - 2028 (Tons) (USD Million)
7.5.6.3 India Alginate Market Estimates and Forecasts, By Product, 2017 - 2028 (Tons) (USD Million)
7.5.6.4 India Alginate Market Estimates and Forecasts, By Application, 2017 - 2028 (Tons) (USD Million)
7.5.6.4.1 India Alginate Market Estimates and Forecasts, By Food & Beverage Application, 2017 - 2028 (Tons) (USD Million)
7.5.7 Japan
7.5.7.1 Japan Alginate Market Estimates and Forecasts, 2017 - 2028 (Tons) (USD Million)
7.5.7.2 Japan Alginate Market Estimates and Forecasts, By Type, 2017 - 2028 (Tons) (USD Million)
7.5.7.3 Japan Alginate Market Estimates and Forecasts, By Product, 2017 - 2028 (Tons) (USD Million)
7.5.7.4 Japan Alginate Market Estimates and Forecasts, By Application, 2017 - 2028 (Tons) (USD Million)
7.5.7.4.1 Japan Alginate Market Estimates and Forecasts, By Food & Beverage Application, 2017 - 2028 (Tons) (USD Million)
7.5.8 South Korea
7.5.8.1 South Korea Alginate Market Estimates and Forecasts, 2017 - 2028 (Tons) (USD Million)
7.5.8.2 South Korea Alginate Market Estimates and Forecasts, By Type, 2017 - 2028 (Tons) (USD Million)
7.5.8.3 South Korea Alginate Market Estimates and Forecasts, By Product, 2017 - 2028 (Tons) (USD Million)
7.5.8.4 South Korea Alginate Market Estimates and Forecasts, By Application, 2017 - 2028 (Tons) (USD Million)
7.5.8.4.1 South Korea Alginate Market Estimates and Forecasts, By Food & Beverage Application, 2017 - 2028 (Tons) (USD Million)
7.6 Central & South America
7.6.1 Central & South America Alginate Market Estimates and Forecasts, 2017 - 2028 (Tons) (USD Million)
7.6.2 Central & South America Alginate Market Estimates and Forecasts, By Type, 2017 - 2028 (Tons) (USD Million)
7.6.3 Central & South America Alginate Market Estimates and Forecasts, By Product, 2017 - 2028 (Tons) (USD Million)
7.6.4 Central & South America Alginate Market Estimates and Forecasts, By Application, 2017 - 2028 (Tons) (USD Million)
7.6.4.1 Central & South America Alginate Market Estimates and Forecasts, By Food & Beverage Application, 2017 - 2028 (Tons) (USD Million)
7.6.5 Brazil
7.6.5.1 Brazil Alginate Market Estimates and Forecasts, 2017 - 2028 (Tons) (USD Million)
7.6.5.2 Brazil Alginate Market Estimates and Forecasts, By Type, 2017 - 2028 (Tons) (USD Million)
7.6.5.3 Brazil Alginate Market Estimates and Forecasts, By Product, 2017 - 2028 (Tons) (USD Million)
7.6.5.4 Brazil Alginate Market Estimates and Forecasts, By Application, 2017 - 2028 (Tons) (USD Million)
7.6.5.4.1 Brazil Alginate Market Estimates and Forecasts, By Food & Beverage Application, 2017 - 2028 (Tons) (USD Million)
7.7 Middle East & Africa
7.7.1 Middle East & Africa Alginate Market Estimates and Forecasts, 2017 - 2028 (Tons) (USD Million)
7.7.2 Middle East & Africa Alginate Market Estimates and Forecasts, By Type, 2017 - 2028 (Tons) (USD Million)
7.7.3 Middle East & Africa Alginate Market Estimates and Forecasts, By Product, 2017 - 2028 (Tons) (USD Million)
7.7.4 Middle East & Africa Alginate Market Estimates and Forecasts, By Application, 2017 - 2028 (Tons) (USD Million)
7.7.4.1 Middle East & Africa Alginate Market Estimates and Forecasts, By Food & Beverage Application, 2017 - 2028 (Tons) (USD Million)
7.7.5 South Africa
7.7.5.1 South Africa Alginate Market Estimates and Forecasts, 2017 - 2028 (Tons) (USD Million)
7.7.5.2 South Africa Alginate Market Estimates and Forecasts, By Type, 2017 - 2028 (Tons) (USD Million)
7.7.5.3 South Africa Alginate Market Estimates and Forecasts, By Product, 2017 - 2028 (Tons) (USD Million)
7.7.5.4 South Africa Alginate Market Estimates and Forecasts, By Application, 2017 - 2028 (Tons) (USD Million)
7.7.5.4.1 South Africa Alginate Market Estimates and Forecasts, By Food & Beverage Application, 2017 - 2028 (Tons) (USD Million)
7.7.6 Saudi Arabia
7.7.6.1 Saudi Arabia Alginate Market Estimates and Forecasts, 2017 - 2028 (Tons) (USD Million)
7.7.6.2 Saudi Arabia Alginate Market Estimates and Forecasts, By Type, 2017 - 2028 (Tons) (USD Million)
7.7.6.3 Saudi Arabia Alginate Market Estimates and Forecasts, By Product, 2017 - 2028 (Tons) (USD Million)
7.7.6.4 Saudi Arabia Alginate Market Estimates and Forecasts, By Application, 2017 - 2028 (Tons) (USD Million)
7.7.6.4.1 Saudi Arabia Alginate Market Estimates and Forecasts, By Food & Beverage Application, 2017 - 2028 (Tons) (USD Million)
Chapter 8 Alginate Market - Competitive Analysis
8.1 Key Players, Recent Developments & their Impact on the industry
8.2 Key Company/Competition Categorization (Key innovators, Market leaders, Emerging players)
8.3 Vendor Landscape
8.3.1 List of Key Distributors & Channel Partners
8.3.2 Key Customers
8.3.3 Company Market Share/Ranking, By Region
8.4 Public Companies
8.4.1 Company Market Position Analysis
8.4.2 Competitive Analysis Dashboard
8.4.2.1 Market Differentiators
8.4.2.2 Synergy Analysis: Major Deals & Strategic Alliances
8.4.3 SWOT
8.5 Private Companies
8.5.1 List of Key Emerging Companies/Technology Disruptors/Innovators
8.5.2 Geographical Presence
8.5.3 Company Market Position Analysis
8.6 Company-wise Production Plants
Chapter 9 Company Profiles
9.1 Algaia
9.1.1 Company Overview
9.1.2 Product Benchmarking
9.1.3 Strategic Initiatives
9.2 Marine Biopolymers Limited (MBL)
9.2.1 Company Overview
9.2.2 Financial Performance
9.2.3 Product Benchmarking
9.3 DuPont de Nemours, Inc.
9.3.1 Company Overview
9.3.2 Financial Performance
9.3.3 Product Benchmarking
9.3.4 Strategic Initiatives
9.4 Ingredients Solutions, Inc.
9.4.1 Company Overview
9.4.2 Financial Performance
9.4.3 Product Benchmarking
9.5 KIMICA
9.5.1 Company Overview
9.5.2 Financial Performance
9.5.3 Product Benchmarking
9.5.4 Strategic Initiatives
9.6 IRO Alginate Industry Co., Ltd.
9.6.1 Company Overview
9.6.2 Product Benchmarking
9.7 Ceamsa
9.7.1 Company Overview
9.7.2 Financial Performance
9.7.3 Product Benchmarking
9.8 Algea
9.8.1 Company Overview
9.8.2 Financial Performance
9.8.3 Product Benchmarking
9.9 SNAP Natural & Alginate Product Pvt. Ltd.
9.9.1 Company Overview
9.9.2 Financial Performance
9.9.3 Product Benchmarking
9.10 Shandong Jiejing Group Corporation
9.10.1 Company Overview
9.10.2 Product Benchmarking
List of Tables
Table 1 Global high M alginate market estimates and forecasts, 2017 - 2028 (Tons) (USD Million)
Table 2 Global high G alginate market estimates and forecasts, 2017 - 2028 (Tons) (USD Million)
Table 3 Global sodium alginate market estimates and forecasts, 2017 - 2028 (Tons) (USD Million)
Table 4 Global calcium alginate market estimates and forecasts, 2017 - 2028 (Tons) (USD Million)
Table 5 Global potassium alginate market estimates and forecasts, 2017 - 2028 (Tons) (USD Million)
Table 6 Global propylene glycol alginate market estimates and forecasts, 2017 - 2028 (Tons) (USD Million)
Table 7 Global other alginates market estimates and forecasts, 2017 - 2028 (Tons) (USD Million)
Table 8 Global alginate market estimates and forecasts, in food & beverages, 2017 - 2028 (Tons) (USD Million)
Table 9 Global alginate market estimates and forecasts, in bakery applications, 2017 - 2028 (Tons) (USD Million)
Table 10 Global alginate market estimates and forecasts, in confectionery applications, 2017 - 2028 (Tons) (USD Million)
Table 11 Global alginate market estimates and forecasts, in meat products applications, 2017 - 2028 (Tons) (USD Million)
Table 12 Global alginate market estimates and forecasts, in dairy products applications, 2017 - 2028 (Tons) (USD Million)
Table 13 Global alginate market estimates and forecasts, in sauces & dressings applications, 2017 - 2028 (Tons) (USD Million)
Table 14 Global alginate market estimates and forecasts, in beverage applications, 2017 - 2028 (Tons) (USD Million)
Table 15 Global alginate market estimates and forecasts, in other applications, 2017 - 2028 (Tons) (USD Million)
Table 16 Global alginate market estimates and forecasts, in pharmaceutical, 2017 - 2028 (Tons) (USD Million)
Table 17 Global alginate market estimates and forecasts, in industrial applications, 2017 - 2028 (Tons) (USD Million)
Table 18 Global alginate market estimates and forecasts, in other applications, 2017 - 2028 (Tons) (USD Million)
Table 19 North America alginate market estimates and forecasts, 2017 - 2028 (Tons) (USD Million)
Table 20 North America alginate market estimates and forecasts, by type, 2017 - 2028 (Tons)
Table 21 North America alginate market estimates and forecasts, by type, 2017 - 2028 (USD Million)
Table 22 North America alginate market estimates and forecasts, by product, 2017 - 2028 (Tons)
Table 23 North America alginate market estimates and forecasts, by product, 2017 - 2028 (USD Million)
Table 24 North America alginate market estimates and forecasts, by application, 2017 - 2028 (Tons)
Table 25 North America alginate market estimates and forecasts, by application, 2017 - 2028 (USD Million)
Table 26 North America alginate market estimates and forecasts, by food & beverage application, 2017 - 2028 (Tons)
Table 27 North America alginate market estimates and forecasts, by food & beverage application, 2017 - 2028 (USD Million)
Table 28 The U.S. alginate market estimates and forecasts, 2017 - 2028 (Tons) (USD Million)
Table 29 The U.S. alginate market estimates and forecasts, by type, 2017 - 2028 (Tons)
Table 30 The U.S. alginate market estimates and forecasts, by type, 2017 - 2028 (USD Million)
Table 31 The U.S. alginate market estimates and forecasts, by product, 2017 - 2028 (Tons)
Table 32 The U.S. alginate market estimates and forecasts, by product, 2017 - 2028 (USD Million)
Table 33 The U.S. alginate market estimates and forecasts, by application, 2017 - 2028 (Tons)
Table 34 The U.S. alginate market estimates and forecasts, by application, 2017 - 2028 (USD Million)
Table 35 The U.S. alginate market estimates and forecasts, by food & beverage application, 2017 - 2028 (Tons)
Table 36 The U.S. alginate market estimates and forecasts, by food & beverage application, 2017 - 2028 (USD Million)
Table 37 Canada alginate market estimates and forecasts, 2017 - 2028 (Tons) (USD Million)
Table 38 Canada alginate market estimates and forecasts, by type, 2017 - 2028 (Tons)
Table 39 Canada alginate market estimates and forecasts, by type, 2017 - 2028 (USD Million)
Table 40 Canada alginate market estimates and forecasts, by product, 2017 - 2028 (Tons)
Table 41 Canada alginate market estimates and forecasts, by product, 2017 - 2028 (USD Million)
Table 42 Canada alginate market estimates and forecasts, by application, 2017 - 2028 (Tons)
Table 43 Canada alginate market estimates and forecasts, by application, 2017 - 2028 (USD Million)
Table 44 Canada alginate market estimates and forecasts, by food & beverage application, 2017 - 2028 (Tons)
Table 45 Canada alginate market estimates and forecasts, by food & beverage application, 2017 - 2028 (USD Million)
Table 46 Mexico alginate market estimates and forecasts, 2017 - 2028 (Tons) (USD Million)
Table 47 Mexico alginate market estimates and forecasts, by type, 2017 - 2028 (Tons)
Table 48 Mexico alginate market estimates and forecasts, by type, 2017 - 2028 (USD Million)
Table 49 Mexico alginate market estimates and forecasts, by product, 2017 - 2028 (Tons)
Table 50 Mexico alginate market estimates and forecasts, by product, 2017 - 2028 (USD Million)
Table 51 Mexico alginate market estimates and forecasts, by application, 2017 - 2028 (Tons)
Table 52 Mexico alginate market estimates and forecasts, by application, 2017 - 2028 (USD Million)
Table 53 Mexico alginate market estimates and forecasts, by food & beverage application, 2017 - 2028 (Tons)
Table 54 Mexico alginate market estimates and forecasts, by food & beverage application, 2017 - 2028 (USD Million)
Table 55 Europe alginate market estimates and forecasts, 2017 - 2028 (Tons) (USD Million)
Table 56 Europe alginate market estimates and forecasts, by type, 2017 - 2028 (Tons)
Table 57 Europe alginate market estimates and forecasts, by type, 2017 - 2028 (USD Million)
Table 58 Europe alginate market estimates and forecasts, by product, 2017 - 2028 (Tons)
Table 59 Europe alginate market estimates and forecasts, by product, 2017 - 2028 (USD Million)
Table 60 Europe alginate market estimates and forecasts, by application, 2017 - 2028 (Tons)
Table 61 Europe alginate market estimates and forecasts, by application, 2017 - 2028 (USD Million)
Table 62 Europe alginate market estimates and forecasts, by food & beverage application, 2017 - 2028 (Tons)
Table 63 Europe alginate market estimates and forecasts, by food & beverage application, 2017 - 2028 (USD Million)
Table 64 Germany alginate market estimates and forecasts, 2017 - 2028 (Tons) (USD Million)
Table 65 Germany alginate market estimates and forecasts, by type, 2017 - 2028 (Tons)
Table 66 Germany alginate market estimates and forecasts, by type, 2017 - 2028 (USD Million)
Table 67 Germany alginate market estimates and forecasts, by product, 2017 - 2028 (Tons)
Table 68 Germany alginate market estimates and forecasts, by product, 2017 - 2028 (USD Million)
Table 69 Germany alginate market estimates and forecasts, by application, 2017 - 2028 (Tons)
Table 70 Germany alginate market estimates and forecasts, by application, 2017 - 2028 (USD Million)
Table 71 Germany alginate market estimates and forecasts, by food & beverage application, 2017 - 2028 (Tons)
Table 72 Germany alginate market estimates and forecasts, by food & beverage application, 2017 - 2028 (USD Million)
Table 73 The U.K. alginate market estimates and forecasts, 2017 - 2028 (Tons) (USD Million)
Table 74 The U.K. alginate market estimates and forecasts, by type, 2017 - 2028 (Tons)
Table 75 The U.K. alginate market estimates and forecasts, by type, 2017 - 2028 (USD Million)
Table 76 The U.K. alginate market estimates and forecasts, by product, 2017 - 2028 (Tons)
Table 77 The U.K. alginate market estimates and forecasts, by product, 2017 - 2028 (USD Million)
Table 78 The U.K. alginate market estimates and forecasts, by application, 2017 - 2028 (Tons)
Table 79 The U.K. alginate market estimates and forecasts, by application, 2017 - 2028 (USD Million)
Table 80 The U.K. alginate market estimates and forecasts, by food & beverage application, 2017 - 2028 (Tons)
Table 81 The U.K. alginate market estimates and forecasts, by food & beverage application, 2017 - 2028 (USD Million)
Table 82 France alginate market estimates and forecasts, 2017 - 2028 (Tons) (USD Million)
Table 83 France alginate market estimates and forecasts, by type, 2017 - 2028 (Tons)
Table 84 France alginate market estimates and forecasts, by type, 2017 - 2028 (USD Million)
Table 85 France alginate market estimates and forecasts, by product, 2017 - 2028 (Tons)
Table 86 France alginate market estimates and forecasts, by product, 2017 - 2028 (USD Million)
Table 87 France alginate market estimates and forecasts, by application, 2017 - 2028 (Tons)
Table 88 France alginate market estimates and forecasts, by application, 2017 - 2028 (USD Million)
Table 89 France alginate market estimates and forecasts, by food & beverage application, 2017 - 2028 (Tons)
Table 90 France alginate market estimates and forecasts, by food & beverage application, 2017 - 2028 (USD Million)
Table 91 Italy alginate market estimates and forecasts, 2017 - 2028 (Tons) (USD Million)
Table 92 Italy alginate market estimates and forecasts, by type, 2017 - 2028 (Tons)
Table 93 Italy alginate market estimates and forecasts, by type, 2017 - 2028 (USD Million)
Table 94 Italy alginate market estimates and forecasts, by product, 2017 - 2028 (Tons)
Table 95 Italy alginate market estimates and forecasts, by product, 2017 - 2028 (USD Million)
Table 96 Italy alginate market estimates and forecasts, by application, 2017 - 2028 (Tons)
Table 97 Italy alginate market estimates and forecasts, by application, 2017 - 2028 (USD Million)
Table 98 Italy alginate market estimates and forecasts, by food & beverage application, 2017 - 2028 (Tons)
Table 99 Italy alginate market estimates and forecasts, by food & beverage application, 2017 - 2028 (USD Million)
Table 100 Spain alginate market estimates and forecasts, 2017 - 2028 (Tons) (USD Million)
Table 101 Spain alginate market estimates and forecasts, by type, 2017 - 2028 (Tons)
Table 102 Spain alginate market estimates and forecasts, by type, 2017 - 2028 (USD Million)
Table 103 Spain alginate market estimates and forecasts, by product, 2017 - 2028 (Tons)
Table 104 Spain alginate market estimates and forecasts, by product, 2017 - 2028 (USD Million)
Table 105 Spain alginate market estimates and forecasts, by application, 2017 - 2028 (Tons)
Table 106 Spain alginate market estimates and forecasts, by application, 2017 - 2028 (USD Million)
Table 107 Spain alginate market estimates and forecasts, by food & beverage application, 2017 - 2028 (Tons)
Table 108 Spain alginate market estimates and forecasts, by food & beverage application, 2017 - 2028 (USD Million)
Table 109 Asia Pacific alginate market estimates and forecasts, 2017 - 2028 (Tons) (USD Million)
Table 110 Asia Pacific alginate market estimates and forecasts, by type, 2017 - 2028 (Tons)
Table 111 Asia Pacific alginate market estimates and forecasts, by type, 2017 - 2028 (USD Million)
Table 112 Asia Pacific alginate market estimates and forecasts, by product, 2017 - 2028 (Tons)
Table 113 Asia Pacific alginate market estimates and forecasts, by product, 2017 - 2028 (USD Million)
Table 114 Asia Pacific alginate market estimates and forecasts, by application, 2017 - 2028 (Tons)
Table 115 Asia Pacific alginate market estimates and forecasts, by application, 2017 - 2028 (USD Million)
Table 116 Asia Pacific alginate market estimates and forecasts, by food & beverage application, 2017 - 2028 (Tons)
Table 117 Asia Pacific alginate market estimates and forecasts, by food & beverage application, 2017 - 2028 (USD Million)
Table 118 China alginate market estimates and forecasts, 2017 - 2028 (Tons) (USD Million)
Table 119 China alginate market estimates and forecasts, by type, 2017 - 2028 (Tons)
Table 120 China alginate market estimates and forecasts, by type, 2017 - 2028 (USD Million)
Table 121 China alginate market estimates and forecasts, by product, 2017 - 2028 (Tons)
Table 122 China alginate market estimates and forecasts, by product, 2017 - 2028 (USD Million)
Table 123 China alginate market estimates and forecasts, by application, 2017 - 2028 (Tons)
Table 124 China alginate market estimates and forecasts, by application, 2017 - 2028 (USD Million)
Table 125 China alginate market estimates and forecasts, by food & beverage application, 2017 - 2028 (Tons)
Table 126 China alginate market estimates and forecasts, by food & beverage application, 2017 - 2028 (USD Million)
Table 127 India alginate market estimates and forecasts, 2017 - 2028 (Tons) (USD Million)
Table 128 India alginate market estimates and forecasts, by type, 2017 - 2028 (Tons)
Table 129 India alginate market estimates and forecasts, by type, 2017 - 2028 (USD Million)
Table 130 India alginate market estimates and forecasts, by product, 2017 - 2028 (Tons)
Table 131 India alginate market estimates and forecasts, by product, 2017 - 2028 (USD Million)
Table 132 India alginate market estimates and forecasts, by application, 2017 - 2028 (Tons)
Table 133 India alginate market estimates and forecasts, by application, 2017 - 2028 (USD Million)
Table 134 India alginate market estimates and forecasts, by food & beverage application, 2017 - 2028 (Tons)
Table 135 India alginate market estimates and forecasts, by food & beverage application, 2017 - 2028 (USD Million)
Table 136 Japan alginate market estimates and forecasts, 2017 - 2028 (Tons) (USD Million)
Table 137 Japan alginate market estimates and forecasts, by type, 2017 - 2028 (Tons)
Table 138 Japan alginate market estimates and forecasts, by type, 2017 - 2028 (USD Million)
Table 139 Japan alginate market estimates and forecasts, by product, 2017 - 2028 (Tons)
Table 140 Japan alginate market estimates and forecasts, by product, 2017 - 2028 (USD Million)
Table 141 Japan alginate market estimates and forecasts, by application, 2017 - 2028 (Tons)
Table 142 Japan alginate market estimates and forecasts, by application, 2017 - 2028 (USD Million)
Table 143 Japan alginate market estimates and forecasts, by food & beverage application, 2017 - 2028 (Tons)
Table 144 Japan alginate market estimates and forecasts, by food & beverage application, 2017 - 2028 (USD Million)
Table 145 South Korea alginate market estimates and forecasts, 2017 - 2028 (Tons) (USD Million)
Table 146 South Korea alginate market estimates and forecasts, by type, 2017 - 2028 (Tons)
Table 147 South Korea alginate market estimates and forecasts, by type, 2017 - 2028 (USD Million)
Table 148 South Korea alginate market estimates and forecasts, by product, 2017 - 2028 (Tons)
Table 149 South Korea alginate market estimates and forecasts, by product, 2017 - 2028 (USD Million)
Table 150 South Korea alginate market estimates and forecasts, by application, 2017 - 2028 (Tons)
Table 151 South Korea alginate market estimates and forecasts, by application, 2017 - 2028 (USD Million)
Table 152 South Korea alginate market estimates and forecasts, by food & beverage application, 2017 - 2028 (Tons)
Table 153 South Korea alginate market estimates and forecasts, by food & beverage application, 2017 - 2028 (USD Million)
Table 154 Central & South America alginate market estimates and forecasts, 2017 - 2028 (Tons) (USD Million)
Table 155 Central & South America alginate market estimates and forecasts, by type, 2017 - 2028 (Tons)
Table 156 Central & South America alginate market estimates and forecasts, by type, 2017 - 2028 (USD Million)
Table 157 Central & South America alginate market estimates and forecasts, by product, 2017 - 2028 (Tons)
Table 158 Central & South America alginate market estimates and forecasts, by product, 2017 - 2028 (USD Million)
Table 159 Central & South America alginate market estimates and forecasts, by application, 2017 - 2028 (Tons)
Table 160 Central & South America alginate market estimates and forecasts, by application, 2017 - 2028 (USD Million)
Table 161 Central & South America alginate market estimates and forecasts, by food & beverage application, 2017 - 2028 (Tons)
Table 162 Central & South America alginate market estimates and forecasts, by food & beverage application, 2017 - 2028 (USD Million)
Table 163 Brazil alginate market estimates and forecasts, 2017 - 2028 (Tons) (USD Million)
Table 164 Brazil alginate market estimates and forecasts, by type, 2017 - 2028 (Tons)
Table 165 Brazil alginate market estimates and forecasts, by type, 2017 - 2028 (USD Million)
Table 166 Brazil alginate market estimates and forecasts, by product, 2017 - 2028 (Tons)
Table 167 Brazil alginate market estimates and forecasts, by product, 2017 - 2028 (USD Million)
Table 168 Brazil alginate market estimates and forecasts, by application, 2017 - 2028 (Tons)
Table 169 Brazil alginate market estimates and forecasts, by application, 2017 - 2028 (USD Million)
Table 170 Brazil alginate market estimates and forecasts, by food & beverage application, 2017 - 2028 (Tons)
Table 171 Brazil alginate market estimates and forecasts, by food & beverage application, 2017 - 2028 (USD Million)
Table 172 Middle East & Africa alginate market estimates and forecasts, 2017 - 2028 (Tons) (USD Million)
Table 173 Middle East & Africa alginate market estimates and forecasts, by type, 2017 - 2028 (Tons)
Table 174 Middle East & Africa alginate market estimates and forecasts, by type, 2017 - 2028 (USD Million)
Table 175 Middle East & Africa alginate market estimates and forecasts, by product, 2017 - 2028 (Tons)
Table 176 Middle East & Africa alginate market estimates and forecasts, by product, 2017 - 2028 (USD Million)
Table 177 Middle East & Africa alginate market estimates and forecasts, by application, 2017 - 2028 (Tons)
Table 178 Middle East & Africa alginate market estimates and forecasts, by application, 2017 - 2028 (USD Million)
Table 179 Middle East & Africa alginate market estimates and forecasts, by food & beverage application, 2017 - 2028 (Tons)
Table 180 Middle East & Africa alginate market estimates and forecasts, by food & beverage application, 2017 - 2028 (USD Million)
Table 181 South Africa alginate market estimates and forecasts, 2017 - 2028 (Tons) (USD Million)
Table 182 South Africa alginate market estimates and forecasts, by type, 2017 - 2028 (Tons)
Table 183 South Africa alginate market estimates and forecasts, by type, 2017 - 2028 (USD Million)
Table 184 South Africa alginate market estimates and forecasts, by product, 2017 - 2028 (Tons)
Table 185 South Africa alginate market estimates and forecasts, by product, 2017 - 2028 (USD Million)
Table 186 South Africa alginate market estimates and forecasts, by application, 2017 - 2028 (Tons)
Table 187 South Africa alginate market estimates and forecasts, by application, 2017 - 2028 (USD Million)
Table 188 South Africa alginate market estimates and forecasts, by food & beverage application, 2017 - 2028 (Tons)
Table 189 South Africa alginate market estimates and forecasts, by food & beverage application, 2017 - 2028 (USD Million)
Table 190 Saudi Arabia alginate market estimates and forecasts, 2017 - 2028 (Tons) (USD Million)
Table 191 Saudi Arabia alginate market estimates and forecasts, by type, 2017 - 2028 (Tons)
Table 192 Saudi Arabia alginate market estimates and forecasts, by type, 2017 - 2028 (USD Million)
Table 193 Saudi Arabia alginate market estimates and forecasts, by product, 2017 - 2028 (Tons)
Table 194 Saudi Arabia alginate market estimates and forecasts, by product, 2017 - 2028 (USD Million)
Table 195 Saudi Arabia alginate market estimates and forecasts, by application, 2017 - 2028 (Tons)
Table 196 Saudi Arabia alginate market estimates and forecasts, by application, 2017 - 2028 (USD Million)
Table 197 Saudi Arabia alginate market estimates and forecasts, by food & beverage application, 2017 - 2028 (Tons)
Table 198 Saudi Arabia alginate market estimates and forecasts, by food & beverage application, 2017 - 2028 (USD Million)
List of Figures
Fig. 1 Information procurement
Fig. 2 Primary research pattern
Fig. 3 Primary research process
Fig. 4 Primary research approaches
Fig. 5 Alginate market: Market Insights
Fig. 6 Alginate market: Segmental insights
Fig. 7 Alginate market: Segmental insights
Fig. 8 Alginate market: Competitive insights
Fig. 9 Alginate market: Penetration & growth prospect mapping
Fig. 10 Alginate market: Value chain analysis
Fig. 11 China Farmed Seaweed Production (Tons)
Fig. 12 Alginate market: Manufacturing process
Fig. 13 Procurement criteria ratings
Fig. 14 Alginate market: Vendor selection criteria analysis
Fig. 15 Alginate market: Market dynamics
Fig. 16 Bakery market revenue in the U.S. & Canada, 2017-2028 (USD Billion)
Fig. 17 Distribution of bakeries in Europe, 2020 (%)
Fig. 18 Europe bakery product consumption, 2020 (%)
Fig. 19 Global alginate market: Type movement analysis, 2020 & 2028
Fig. 20 Global alginate market: Product movement analysis, 2020 & 2028
Fig. 21 Global Alginate market: Application movement analysis, 2020 & 2028
Fig. 22 Regional marketplace: Key takeaways
Fig. 23 Alginate market: Regional movement analysis, 2020 & 2028
Market Segmentation
Alginate, a key ingredient in the food industry, is used as an emulsifier, thickener, and gelling agent. Its popularity stems from its production using natural raw materials, leading to its widespread acceptance. Alginate is found in sauces, bakery items, and confectionery products. The growing use of alginate in the bakery and confectionery sector is expected to fuel market growth. The rising consumption of emulsifiers in foods like salad dressings, peanut butter, chocolates, margarine, and frozen desserts is set to boost alginate demand. Factors such as changing lifestyles, increased disposable income due to rapid urbanization, and growing consumer demand for low-fat foods are likely to further drive market growth.
Alginate, widely used in the pharmaceutical sector, serves as an emulsion stabilizer, thickening agent, disintegrant, and film-forming agent for tablets. Its demand is rising due to its use in tablet coating. Sodium alginate, a capsule disintegrant, also acts as a stabilizing, suspending, emulsifying, gel-forming, and viscosity-increasing agent in compounded medicines. Recognized as an FDA-approved natural polymer, alginate is gaining importance in drug manufacturing due to its low toxicity, biocompatibility, and biodegradability. The global population is expected to increase by 1.24% annually until 2030. The percentage of people aged 65 to 80 is projected to rise to 28% in 2030 from 22% in 2000. This aging population will require more medical assistance, leading to higher demand for medications and pharmaceutical drugs. The prevalence of chronic diseases like heart disease, stroke, diabetes, and obesity is increasing worldwide due to changing lifestyles, further driving the demand for pharmaceutical products.
Seaweeds, a crucial source of alginates, are predominantly harvested by China, Norway, and Chile, which collectively contribute to 75% of the global production from wild stocks. However, the environmental and economic repercussions of unsustainable harvesting techniques are significant. Changes in climate and overexploitation have a profound impact on seaweed harvests, primarily from wild stocks. Northern Ireland, a major seaweed harvester, has experienced a decline in production due to the disturbance of wildlife caused by unsustainable harvesting in conservation areas. This has led to a surge in demand for sustainable harvesting techniques. Additionally, the Chinese market is expected to face challenges due to growing concerns about environmental imbalances triggered by excessive harvesting. Therefore, it’s imperative to adopt sustainable practices to ensure the longevity of this vital resource and mitigate environmental impacts.
This section will provide insights into the contents included in this alginate market report and help gain clarity on the structure of the report to assist readers in navigating smoothly.
Industry overview
Industry trends
Market drivers and restraints
Market size
Growth prospects
Porter’s analysis
PESTEL analysis
Key market opportunities prioritized
Competitive landscape
Company overview
Financial performance
Product benchmarking
Latest strategic developments
Market size, estimates, and forecast from 2017 to 2028
Market estimates and forecast for product segments up to 2028
Regional market size and forecast for product segments up to 2028
Market estimates and forecast for application segments up to 2028
Regional market size and forecast for application segments up to 2028
Company financial performance
A three-pronged approach was followed for deducing the alginate market estimates and forecasts. The process has three steps: information procurement, analysis, and validation. The whole process is cyclical, and steps repeat until the estimates are validated. The three steps are explained in detail below:
Information procurement: Information procurement is one of the most extensive and important stages in our research process, and quality data is critical for accurate analysis. We followed a multi-channel data collection process for alginate market to gather the most reliable and current information possible.
Analysis: We mine the data collected to establish baselines for forecasting, identify trends and opportunities, gain insight into consumer demographics and drivers, and so much more. We utilized different methods of alginate market data depending on the type of information we’re trying to uncover in our research.
Market Research Efforts: Bottom-up Approach for estimating and forecasting demand size and opportunity, top-down Approach for new product forecasting and penetration, and combined approach of both Bottom-up and Top-down for full coverage analysis.
Value-Chain-Based Sizing & Forecasting: Supply-side estimates for understanding potential revenue through competitive benchmarking, forecasting, and penetration modeling.
Demand-side estimates for identifying parent and ancillary markets, segment modeling, and heuristic forecasting.
Qualitative Functional Deployment (QFD) Modelling for market share assessment.
Market formulation and validation: We mine the data collected to establish baselines for forecasting, identify trends and opportunities, gain insight into consumer demographics and drivers, and so much more. We utilize different methods of data analysis depending on the type of information we’re trying to uncover in our research.
Market Formulation: This step involves the finalization of market numbers. This step on an internal level is designed to manage outputs from the Data Analysis step.
Data Normalization: The final market estimates and forecasts are then aligned and sent to industry experts, in-panel quality control managers for validation.
This step also entails the finalization of the report scope and data representation pattern.
Validation: The process entails multiple levels of validation. All these steps run in parallel, and the study is forwarded for publishing only if all three levels render validated results.
The alginate market was categorized into four segments, namely type (High M, High G), product (Sodium, Calcium, Potassium, Propylene Glycol), application (Food and Beverages, Pharmaceutical, Industrial), and regions (North America, Europe, Asia Pacific, Central & South America, and Middle East & Africa).
The alginate market was segmented into type, product, application, and region. The demand at a segment level was deduced using a funnel method. Concepts like the TAM, SAM, SOM, etc., were put into practice to understand the demand. We at GVR deploy three methods to deduce market estimates and determine forecasts. These methods are explained below:
Demand estimation of each product across countries/regions summed up to from the total market.
Variable analysis for demand forecast.
Demand estimation via analyzing paid database, and company financials either via annual reports or paid database.
Primary interviews for data revalidation and insight collection.
Used extensively for new product forecasting or analyzing penetration levels.
Tool used invoice product flow and penetration models Use of regression multi-variant analysis for forecasting Involves extensive use of paid and public databases.
Primary interviews and vendor-based primary research for variable impact analysis.
The alginate market was analyzed at a regional level. The globe was divided into North America, Europe, Asia Pacific, Central & South America, and Middle East & Africa, keeping in focus variables like consumption patterns, export-import regulations, consumer expectations, etc. These regions were further divided into fifteen countries, namely, the U.S.; Canada; Mexico; the UK; Germany; France; Italy; Spain; China; India; Japan; South Korea; Brazil; Saudi Arabia; South Africa.
All three above-mentioned market research methodologies were applied to arrive at regional-level conclusions. The regions were then summed up to form the global market.
The alginate market was analyzed via companies operating in the sector. Analyzing these companies and cross-referencing them to the demand equation helped us validate our assumptions and conclusions. Key market players analyzed include:
Algaia - Established in 2010 and based in Lannilis, France, Algaia is a leading manufacturer of marine-derived products and solutions. It caters to various industries including agro-nutrition, personal care, and pharmaceuticals, offering innovative solutions. The company’s product portfolio includes naturally sourced items like carrageenan, alginates, and specialized seaweed extracts. Algaia’s commitment to its environmental policy is evident in its manufacturing of seaweed-based products. The proximity of abundant seaweed to its manufacturing facilities is anticipated to fuel its growth in the future. In 2016, Algaia streamlined its operations by divesting its vanillin biotechnology business to Solvay SA. With operations in over 40 countries, Algaia has a significant global footprint.
Marine Biopolymers Limited (MBL) - Marine Biopolymers Limited (MBL), founded in 2009 and based in AYR, Scotland, is a manufacturer of naturally sourced products, including alginate derived from seaweed. The company’s alginates are utilized in various sectors such as food & beverage, pharmaceutical, and industrial applications. MBL’s unique manufacturing process, coupled with the close proximity of its production unit to seaweed resources, facilitates easy product sourcing. The company plans to implement its patented process for alginate production, which is expected to decrease manufacturing time and yield economies of scale. MBL has received substantial government aid, including monetary grants from agencies like Zero Waste Scotland (ZWS), bolstering its position in the alginate market. The company produces both High M and High G alginates, which serve as thickening and gelling agents in various industries. As of March 2019, MBL had a team of 6 employees.
DuPont de Nemours, Inc. - DuPont de Nemours, Inc., established in 1802 and based in Wilmington, U.S., is a global science and technology company. It operates through four segments: nutrition & biosciences, electronics & imaging, safety & construction, and transportation & advanced polymers. As of December 2018, the company employed 35,000 people. With manufacturing units in the U.S., Belgium, and China, DuPont has a global presence. Its product offerings encompass alginates, plastics, crop protection, dietary supplements, packaging materials & solutions, industrial biotechnology, and pigments, colorants, and dyes. The company’s major product lines include adhesives, animal nutrition, clean technologies, construction materials, consumer products, dietary supplements, and food & beverage ingredients, among others.
Ingredients Solutions, Inc. - Ingredients Solutions, Inc., established in 1992 and based in Maine, U.S., is a global supplier of alginate, leveraging its extensive distribution network. The company distributes a variety of products, including alginate, carrageenan, locust bean gum, pectin, tara gum, agar agar, gellan gum, and xanthan gum. Its products come with various certifications such as Organic-Allowed, Trans Fat-Free, Natural, and GMO- & Allergen-free. Sodium alginates, distributed under the trade name Nalgin, are primarily used in the food manufacturing industry and are Kosher & Halal certified. The company’s products, categorized based on their viscosities, vary in composition. As of the end of 2019, Ingredients Solutions, Inc. had a team of 12 employees.
KIMICA - Founded in 1941, KIMICA is a Tokyo-based company specializing in the production and sale of Marine Biopolymers, including alginates and chitosan. The company operates manufacturing plants in Japan (Chiba) and Chile (Paine), focusing on enhancing production efficiency and productivity through continuous research and development. KIMICA’s alginates are distributed domestically and internationally via direct and third-party networks. These alginates are utilized across various sectors such as food, textile printing, animal feed, pharmaceuticals, cosmetics, and welding. The company’s strategic global positioning allows it to source multiple seaweed species, enabling mass production tailored to client needs. As of 2019, KIMICA employed 173 individuals. The company’s commitment to innovation and quality has positioned it as a leader in the marine biopolymers industry. Its products, derived from a diverse range of seaweed species, meet the specific requirements of clients across various industries. This adaptability, coupled with a robust distribution network, ensures KIMICA’s products reach a wide market. KIMICA’s success lies in its ability to combine innovative research and development with efficient production processes and a strong distribution network. This approach has allowed the company to meet the diverse needs of its clients and maintain a strong position in the marine biopolymers market.
IRO Alginate Industry Co., Ltd. - IRO Alginate Industry Co., Ltd., established in 1995, is a China-based company specializing in the production of alginate products. The company operates a 60,000 square meter facility in Shandong, China, leveraging its geographic location for access to natural seaweed. As of 2019, the facility had an annual production capacity of 2,000 metric tons. In 2010, IRO Alginate collaborated with IRO Group, Inc., expanding its distribution to over 30 countries across North America, Asia, and Europe. The company offers a diverse product portfolio, with applications in the food, pharmaceutical, welding, paper, and textile industries. It also provides customized solutions, earning goodwill in both domestic and international markets. As of 2019, IRO Alginate employed 480 individuals. The company’s commitment to quality and customer satisfaction, combined with its robust distribution network and diverse product offerings, has positioned it as a leader in the alginate industry. Its ability to provide customized solutions further enhances its reputation and market reach. In summary, IRO Alginate’s success is built on its production capacity, product diversity, and strong customer relationships.
Ceamsa - Established in 1966, Ceamsa (Compañia Española de Algas Marinas) is a Spain-based company engaged in the production, development, and distribution of natural hydrocolloids worldwide. The company’s extensive market knowledge, gained through years of operation, has been instrumental in its success. Ceamsa places a high emphasis on Research & Development & Innovation, operating an integrated R&D&I center dedicated to manufacturing advanced product grades. This focus on innovation, coupled with financial aids and grants from the Spanish government, has led to the development of advanced products and an increase in the company’s overall revenue. With a global presence, Ceamsa’s products are used in various industries, including food, pharmaceutical, and cosmetics. The company’s commitment to quality and innovation has helped it maintain a strong position in the market. As of December 2019, Ceamsa employed 240 individuals. In summary, Ceamsa’s success is built on its commitment to innovation, quality, and customer satisfaction, underpinned by robust financial support and a global distribution network.
Algea - Algae, a seaweed processing company, was established in 1937 and is based in Kristiansund, Norway. The company’s location provides easy access to natural seaweed, making it a leading supplier of alginate products in Europe. Algae operates through four segments: algeafood solutions, algeafeed solutions, algeafert solutions, and algeaesthe solutions, catering to the food, feed, and pharmaceutical industries.
In 2002, Algae became part of Valagro Holding Srl, but continues to operate independently. The company is involved in the research and development of various seaweed products, which it supplies throughout Europe. Algae operates a single production unit in Norway that uses alginates to manufacture food products. As of December 2019, the company employed 40 individuals. In summary, Algae’s success is built on its strategic location, diverse product offerings, and commitment to research and development.
SNAP Natural & Alginate Product Pvt. Ltd. - SNAP Natural & Alginate Product Pvt. Ltd., established in 1979, is an India-based company specializing in the production of natural products like alginates and carrageenan. The company operates a single manufacturing facility spread over 12 acres. SNAP exports alginates to Europe and North America, ensuring that its products meet the minimum quality requirements across its distribution areas. The company’s agricultural products are distributed through its Bio Organic Technology division. SNAP manufactures potassium alginate, calcium alginate, alginic acid, and sodium alginate. These products find applications in various industries, including food, textiles, pharmaceuticals, and welding, and are distributed domestically through the company’s network. The company is involved in the research and development of alginates, led by a team of experienced professionals. It also customizes alginates to meet the diverse needs of its consumers. As of March 2019, SNAP employed 56 individuals. In summary, SNAP’s success is built on its commitment to quality, innovation, and customer satisfaction, supported by a robust domestic distribution network.
Shandong Jiejing Group Corporation - Founded in 1968, Shandong Jiejing Group Corporation is a China-based company specializing in the production and distribution of alginate. The company primarily produces sodium alginate from brown seaweed to enhance gel properties, along with potassium and propylene glycol alginate. The company’s operations are housed in a 500,000 square meter production facility, employing over 1,200 workers as of 2019. It also operates a research and development center dedicated to creating advanced alginate products to meet the demands of consumers in China, Europe, and North America. Shandong Jiejing Group Corporation is export-oriented, distributing approximately 70% to 80% of its products to markets in North America, Asia, South America, and Europe. The company places a strong emphasis on advertising, promoting its alginate products at trade fairs across its major markets. The company’s products are used in a variety of industries, including food, pharmaceuticals, textiles, and cosmetics. This wide range of applications demonstrates the versatility and utility of the alginate products produced by Shandong Jiejing Group Corporation.
Supply Side Estimates
Company revenue estimation via referring to annual reports, investor presentations, and Hoover’s.
Segment revenue determination via variable analysis and penetration modeling.
Competitive benchmarking to identify market leaders and their collective revenue shares.
Forecasting via analyzing commercialization rates, pipelines, market initiatives, distribution networks, etc.
Demand side estimates
Identifying parent markets and ancillary markets
Segment penetration analysis to obtain pertinent
revenue/volume
Heuristic forecasting with the help of subject matter experts
Forecasting via variable analysis
Understanding market dynamics (in terms of drivers, restraints, & opportunities) in the countries.
Understanding trends & variables in the individual countries & their impact on growth and using analytical tools to provide high-level insights into the market dynamics and the associated growth pattern.
Understanding market estimates and forecasts (with the base year as 2020, historic information from 2017 to 2019, and forecast from 2021 to 2028). Regional estimates & forecasts for each category are available and are summed up to form the global market estimates.
The report provides market value for the base year 2020 and a yearly forecast till 2028 in terms of revenue/volume or both. The market for each of the segment outlooks has been provided on region & country basis for the above-mentioned forecast period.
The key industry dynamics, major technological trends, and application markets are evaluated to understand their impact on the demand for the forecast period. The growth rates were estimated using correlation, regression, and time-series analysis.
We have used the bottom-up approach for market sizing, analyzing key regional markets, dynamics, & trends for various products and end-users. The total market has been estimated by integrating the country markets.
All market estimates and forecasts have been validated through primary interviews with the key industry participants.
Inflation has not been accounted for to estimate and forecast the market.
Numbers may not add up due to rounding off.
Europe consists of EU-8, Central & Eastern Europe, along with the Commonwealth of Independent States (CIS).
Asia Pacific includes South Asia, East Asia, Southeast Asia, and Oceania (Australia & New Zealand).
Latin America includes Central American countries and the South American continent
Middle East includes Western Asia (as assigned by the UN Statistics Division) and the African continent.
GVR strives to procure the latest and unique information for reports directly from industry experts, which gives it a competitive edge. Quality is of utmost importance to us, therefore every year we focus on increasing our experts’ panel. Primary interviews are one of the critical steps in identifying recent market trends and scenarios. This process enables us to justify and validate our market estimates and forecasts to our clients. With more than 8,000 reports in our database, we have connected with some key opinion leaders across various domains, including healthcare, technology, consumer goods, and the chemical sector. Our process starts with identifying the right platform for a particular type of report, i.e., emails, LinkedIn, seminars, or telephonic conversation, as every report is unique and requires a differentiated approach.
We send out questionnaires to different experts from various regions/ countries, which is dependent on the following factors:
Report/Market scope: If the market study is global, we send questionnaires to industry experts across various regions, including North America, Europe, Asia Pacific, Latin America, and MEA.
Market Penetration: If the market is driven by technological advancements, population density, disease prevalence, or other factors, we identify experts and send out questionnaires based on region or country dominance.
The time to start receiving responses from industry experts varies based on how niche or well-penetrated the market is. Our reports include a detailed chapter on the KoL opinion section, which helps our clients understand the perspective of experts already in the market space.
"The quality of research they have done for us has been excellent."