
Ocean Freight Procurement Intelligence Report, 2024 - 2030 (Revenue Forecast, Supplier Ranking & Matrix, Emerging Technologies, Pricing Models, Cost Structure, Engagement & Operating Model, Competitive Landscape)
- Published Date: Jun, 2024
- Base Year for Estimate: 2023
- Report ID: GVR-P-10587
- Format: Electronic (PDF)
- Historical Data: 2021 - 2022
- Number of Pages: 60
Ocean Freight - Procurement Trends
“Alternative fuels, such as hydrogen, methanol, and ammonia, are becoming more popular as they are cleaner and less polluting.”
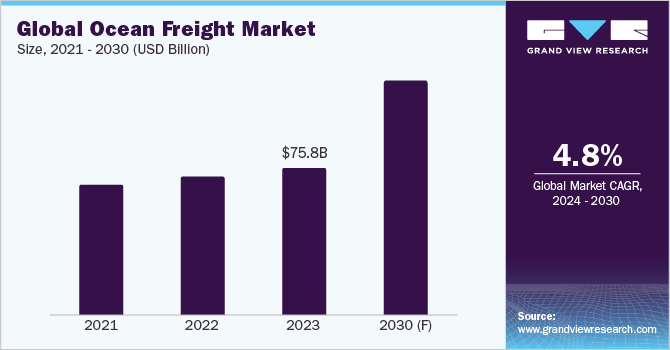
Procurement in ocean freight involves the process of obtaining goods and services from a shipping carrier or a third-party logistics provider. The ocean freight market is expected to grow at a CAGR of 4.8% from 2024 to 2030. With an increasing focus on sustainability measures, ocean freight has become very important in global trade. This is because it not only has a lower carbon footprint than air freight but also helps companies access international markets and procure products from diverse regions. Many carriers are trying to switch to environmentally friendly solutions that help improve the sustainability of shipping operations. Companies are taking initiatives to use cleaner, costlier, and less polluting fuels to support the environment. For instance, alternative fuels, such as hydrogen, methanol, and ammonia, are gaining prominence.
Further, advancements in wind power technology and wind propulsion systems are expected to be game changers in this industry. Although wind propulsion systems have been successfully applied in smaller vessels, the high-power requirements of big vessels make widespread adoption a bit challenging. Hence, factors such as advancements in technology, coupled with rising demand for e-commerce and the escalating level of competition, are some of the main elements contributing to the growth of this industry.
The global market size was estimated at USD 75.8 billion in 2023. The demand for sea freight has been steadily increasing since October 2023. DHL estimates in May 2024 indicate an annual fleet growth rate of approximately 9.6%. In May 2024, the ocean freight demand was more than the capacity for the major trade lines from Asia to Europe, the Middle East, South America, Africa, and Oceania.
Global ocean freight/cargo demand increased by 9.3% in January 2024 compared to January 2023. Demand in the Asia Pacific region increased by 14.9% followed by South America with 12.1% in January 2024. The only region to witness a decline in demand was Europe, dropping by 2.3% in January 2024 compared to January 2023. The drop occurred due to delayed arrivals of vessels redirected around the Cape of Good Hope.
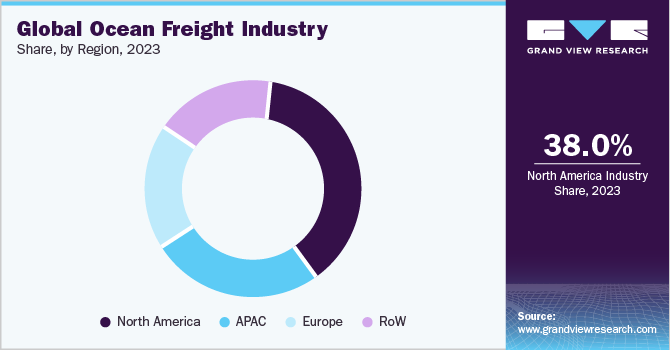
The creation of ocean alliances has been one of the most important changes in this sector during the last few decades. Some of the biggest shipping companies in the world have created these partnerships, which are crucial in defining the dynamics of global shipping. In 2023, North America held the major chunk within the industry, with 38% of the total share. Geopolitical risks and climate changes are two of the most concerning factors in this market, with the potential to significantly impact shipping routes and resource supplies, hinder production, and increase costs.
Many carriers/ocean freight forwarders are using advanced technology to overcome any challenges and increase the efficiency of shipping and supply chain operations. For instance, Artificial Intelligence (AI) is being used to determine ETA for ocean freight vessels accurately. AI can instantly generate precise insights by combining millions of data points, such as weather, global port congestion, ship type and cargo, and transshipments. In 2024, experts have predicted that 90% of the newly constructed ships will have AI capabilities by 2030. Some of the latest developments in this sector include smart shipping, advancements in shipbuilding (mega ships), advanced materials, big data, propulsion systems, robotics, blockchain, and sensors.
Supplier Intelligence
“What is the ocean freight industry's supplier landscape? What are the major alliances in this industry?”
The maritime supply chain is fragmented in nature. This has in turn led to a fragmented ocean freight industry. It is a critical component of global supply chains, and effective management requires careful planning and coordination with procurement teams and suppliers. Within this industry, there are different types of business models, market niches, and specializations. These include feeders, LNG and tankers, containers, river transportation, bulkers, and long ocean runners. Each of these has a variety of unique business verticals or cross sectors inside the industry with its own set of operations. There are almost more than 91,000 commercial vessels operating in the ocean freight sector. All these factors contribute to the fragmentation of the industry. Sea freight companies are investing in state-of-the-art ships with fuel-efficient engines, sophisticated navigation systems, and environmental monitoring tools to stay competitive.Companies are further employing tracking technologies and smart containers to provide their clients with end-to-end visibility and value-added services.
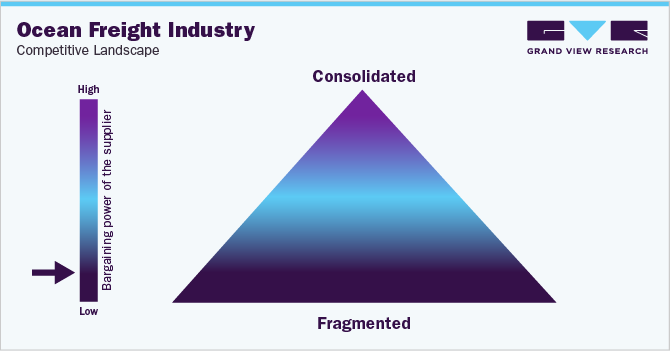
The bargaining power of suppliers or freight forwarders is low due to increased competition amid sufficient TEU capacity (in some lanes). However, suppliers have increased bargaining power on trade routes experiencing capacity crunch in recent times due to supply chain issues. The supply side of shipping goods can be defined as the TEU capacity, where supply is the number of vessels, sizes, shipping routes and containers available. In the first four months of 2024, the TEU container ship capacity increased by almost 80%.
It is anticipated that record-high-capacity container ship deliveries will result in substantial excess capacity in the market. However, three main ocean alliances dominate this ocean freight/maritime shipping industry. These are 2M, Ocean, and THE. The “2M” alliance consists of Maersk Line and Mediterranean Shipping Company (MSC). The “Ocean” Alliance includes CMA CGM, Evergreen Line, COSCO Shipping, and OOCL. The third alliance, “THE” involves HMM, Yang Ming, Hapag-Lloyd, and ONE (Ocean Network Express). These players command a higher negotiating power as they have access to and can provide a broader range of services across major trade routes.
Key suppliers covered in the industry:
-
Mediterranean Shipping Company (MSC)
-
A.P. Moller - Maersk
-
CMA CGM Group
-
China COSCO Shipping Corporation Limited
-
Hapag-Lloyd AG
-
DB Schenker AG
-
DSV A/S
-
Hellmann Worldwide Logistics Inc.
-
Nippon Express Co., Ltd
-
DHL Group
-
Kuehne + Nagel International AG
-
C.H. Robinson Worldwide, Inc.
-
Kerry Logistics Network Limited
-
Dachser Group SE & Co. KG
-
GEODIS S.A
Pricing and Cost Intelligence
“What are some of the major costs associated with the ocean freight industry? What happened to container spot rates?”
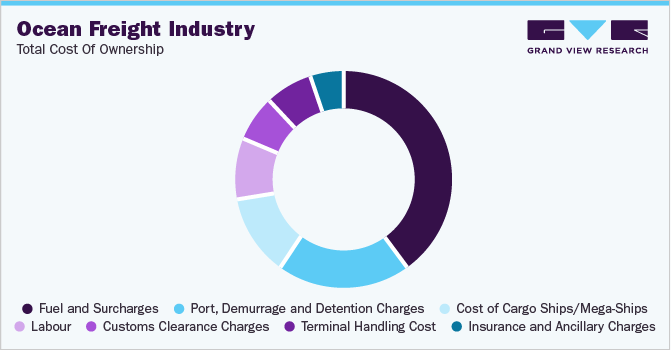
In international trade, understanding procurement costs associated with ocean freight is crucial as it can significantly impact a company’s bottom line. The total cost of ownership (TCO) for an ocean freight service provider includes the cost of cargo ships/mega-ships, fuel and surcharges, port, demurrage and detention charges, labor, customs clearance charges, terminal handling costs, insurance, and ancillary charges. Many factors can influence freight rates, including the distance between origin and destination ports, size and weight of cargo, type of cargo shipped, full container load or less than container load, and market conditions. For instance, a high demand for shipping containers amid limited container capacity can lead to a rise in freight rates. Besides, during times of high fuel prices, fuel surcharges can significantly increase the cost of shipping cargo by sea.
Bunker fuel, which is a primary fuel for ships, is a significant cost component in the TCO. Fluctuations in the prices of oil can directly impact the bunker fuel costs, thereby making "fuel" a volatile and unpredictable cost element. Many carriers will impose extra surcharges, which directly affect the rate of freight, to offset the increased operating costs. The most significant expense is fuel, which can account for between 40 - 50% of total operating costs.
Port authorities impose port charges for using their facilities, while terminal operators charge terminal handling fees for cargo handling. Port charges can account for between 20 - 25% of the total operational expenditures. Similarly, demurrage and detention charges are levied when shipments are delayed. All these charges can add up and significantly impact the total cost of shipping goods.
The chart below shows an overview of the total cost of ownership:
Ocean freight container spot rates have risen dramatically since the start of May 2024. The trade route from the 'Far East to North Europe' experienced the largest spot rate increase of 30% between April 1, 2024, and May 16, 2024. This was followed by a 29% rate increase on the trade route from the 'Far East to the U.S. West Coast' and a 22% rate increase from the 'Far East to the Mediterranean' during the same period. There are many reasons for the rate increase; however, the rapid pace of the uptick caused unsettlement in the market. The increased demand in Q1 2024 put pressure on the shipping capacity during the Red Sea situation.
At the end of May 2024, a sudden container capacity crunch ahead of the peak shipping season reportedly caused freight rates to spike and remain elevated till June 2024. Trade flow on key routes was disrupted by the start of the peak shipping season, combined with longer transits to avoid the Red Sea and bad weather in Asia. Ocean carriers were either bypassing ports or spending less time at ports and were not picking up empty containers to maintain their vessels' delivery schedule. The gap between ocean freight spot rates and long-term rates kept widening. Since the end of April 2024, ocean freight rates have spiked to USD 1,500 on average on routes to the U.S. coasts. Capacity constraints were being experienced on the 'Asia to Latin America' trade lane, Transpacific routes, and 'Asia to Europe' routes.
Sourcing Intelligence
“What are some of the sourcing strategies followed by companies?”
One of the most crucial decisions supply chain managers or procurement executives must make is selecting the appropriate carrier. This is because shipping carriers have a comprehensive infrastructure combined with extensive networks and partnerships to ensure smooth delivery of products across regions. A major responsibility of a shipping company is to determine the best routes for moving cargo, considering distance, traffic, and customs laws. As a result, during the procurement of this category services, companies evaluate suppliers to determine if they can provide various container options based on the type of goods being shipped. They also assess whether suppliers can offer specialized equipment for perishable or temperature-sensitive products and accommodate oversized cargo. Some other considerations include assessing the suppliers' route and coverage, transit times, shippers' reputation, availability of containers, costs and surcharges, tracking capabilities, customs expertise, and safety and compliance track record.
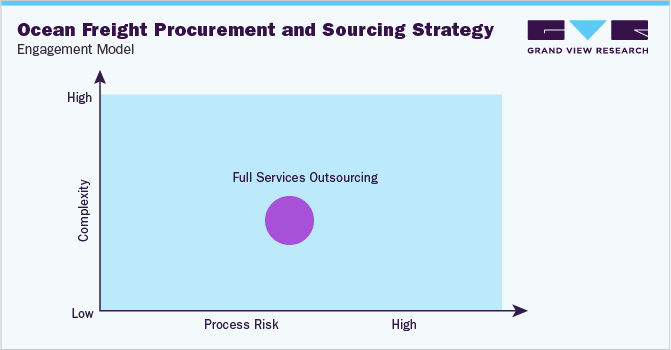
“In the full services outsourcing model, the client outsources the complete operation/manufacturing to single or multiple companies.”
Almost 40 - 70% of B2B companies opt for a full outsourcing model for their sea freight activities. For instance, end-use companies in retail, FMCG, or pharmaceuticals generally engage with 3PL/4PL firms or specialized freight forwarders. Outsourcing can enable companies to streamline their supply chain operations, scale their operations as per demand fluctuations, and focus on their core operations while achieving better cost savings.
For this category, low-cost country sourcing entails taking advantage of the benefits provided by countries with competitive shipping rates, well-functioning port facilities, and other factors that support cost-efficient marine transportation. For instance, nations having robust and integrated port infrastructure can efficiently handle large cargo volumes. This can, in turn, reduce the handling charges and transit times. Ports having automated technology with modern equipment can streamline the flow of products, minimize delays, and save costs. On the other hand, countries with strategic geographical locations can be positioned as ideal hubs for shipping routes owing to connectivity with major markets worldwide. A few instances of such nations include China, India, Singapore, Thailand, and Mexico.
The report also provides details regarding peer analysis, recent supplier developments, supply-demand analysis, competitive landscape, KPIs, SLAs, risk assessment, negotiation strategies and low-cost/best-cost sourcing analysis. In the report, we have tried to provide a holistic industry perspective, an overview of the supplier landscape - the presence of different types of players and the competitive pressure within the industry as a whole (PORTER’s). Fuel is a significant expense in this market owing to the massive size of vessels operating in this space. Similarly, the supply chain practices under sourcing and procurement are also covered. One such instance is the operating model that encompasses all the business processes conducted within an organization. It is an integral aspect of the company's operations and plays a crucial role in its success.
Ocean Freight Procurement Intelligence Report Scope
|
Report Attribute |
Details |
|
Growth Rate |
CAGR of 4.8% from 2024 to 2030 |
|
Base Year for Estimation |
2023 |
|
Pricing Growth Outlook |
10 - 22% (Annually) |
|
Pricing Models |
Volume-based, ad-valorem pricing, flat or fixed rates, spot or contract rate pricing models. |
|
Supplier Selection Scope |
Cost and pricing, past engagements, productivity, geographical presence |
|
Supplier Selection Criteria |
Cargo handling capacities, FCL or LCL, cargo insurance, temperature control capabilities, online tracking, technical specifications, and other operational and functional capabilities |
|
Report Coverage |
Revenue forecast, supplier ranking, supplier matrix, emerging technology, pricing models, cost structure, competitive landscape, growth factors, trends, engagement, and operating model |
|
Key Companies Profiled |
Mediterranean Shipping Company (MSC), A.P. Moller - Maersk, CMA CGM Group, China COSCO Shipping Corporation Limited, Hapag-Lloyd AG, DB Schenker AG, DSV A/S, Hellmann Worldwide Logistics Inc., Nippon Express Co., Ltd, DHL Group, Kuehne + Nagel International AG, C.H. Robinson Worldwide, Inc., Kerry Logistics Network Limited, Dachser Group SE & Co. KG, and GEODIS S.A. |
|
Regional Scope |
Global |
|
Revenue Forecast in 2030 |
USD 105.2 billion |
|
Historical Data |
2021 - 2022 |
|
Quantitative Units |
Revenue in USD billion and CAGR from 2024 to 2030 |
|
Customization Scope |
Up to 48 hours of customization free with every report. |
|
Pricing and Purchase Options |
Avail customized purchase options to meet your exact research needs. Explore purchase options |
Frequently Asked Questions About This Report
b. The global ocean freight market size was valued at USD 75.8 billion in 2023 and is estimated to witness a CAGR of 4.8% from 2024 to 2030.
b. Factors such as advancements in technology coupled with rising demand for e-commerce, and the escalating level of competition are some of the main elements contributing to the growth of this ocean freight industry.
b. According to LCC/BCC analysis, China, India, Singapore, Thailand, and Mexico.
b. The ocean freight industry is fragmented. Some of the leading players are Mediterranean Shipping Company (MSC), A.P. Moller - Maersk, CMA CGM Group, China COSCO Shipping Corporation Limited, Hapag-Lloyd AG, DB Schenker AG, DSV A/S, Hellmann Worldwide Logistics Inc., Nippon Express Co., Ltd, DHL Group, Kuehne + Nagel International AG, C.H. Robinson Worldwide, Inc., Kerry Logistics Network Limited, Dachser Group SE & Co. KG, and GEODIS S.A
b. The total cost of ownership (TCO) for an ocean freight service provider includes the cost of cargo ships/mega-ships, fuel and surcharges, port, demurrage and detention charges, labor, customs clearance charges, terminal handling cost, insurance and ancillary charges.
b. As part of their procurement strategy, companies evaluate suppliers if they can provide various container options based on the type of goods being shipped. They also assess whether suppliers can offer specialized equipment for perishable or temperature-sensitive products and accommodate oversized cargo. Some other considerations include assessing the suppliers' route and coverage, transit times, shippers' reputation, availability of containers, costs and surcharges, tracking capabilities, customs expertise, and safety and compliance track record.
Add-on Services
Should Cost Analysis
Component wise cost break down for better negotiation for the client, highlights the key cost drivers in the market with future price fluctuation for different materials (e.g.: steel, aluminum, etc.) used in the production process
Rate Benchmarking
Offering cost transparency for different products / services procured by the client. A typical report involves 2-3 case scenarios helping clients to select the best suited engagement with the supplier
Salary Benchmarking
Determining and forecasting salaries for specific skill set labor to make decision on outsourcing vs in-house.
Supplier Newsletter
A typical newsletter study by capturing latest information for specific suppliers related to: M&As, technological innovations, expansion, litigations, bankruptcy etc.


