
Natural Rubber Procurement Intelligence Report, 2024 - 2030 (Revenue Forecast, Supplier Ranking & Matrix, Emerging Technologies, Pricing Models, Cost Structure, Engagement & Operating Model, Competitive Landscape)
- Published Date: Jul, 2024
- Base Year for Estimate: 2023
- Report ID: GVR-P-10591
- Format: Electronic (PDF)
- Historical Data: 2021 - 2022
- Number of Pages: 60
Natural Rubber - Procurement Trends
“Rising use of jute composites or biocomposites, coupled with an increasing demand for sustainable sourcing, is driving the market demand.”
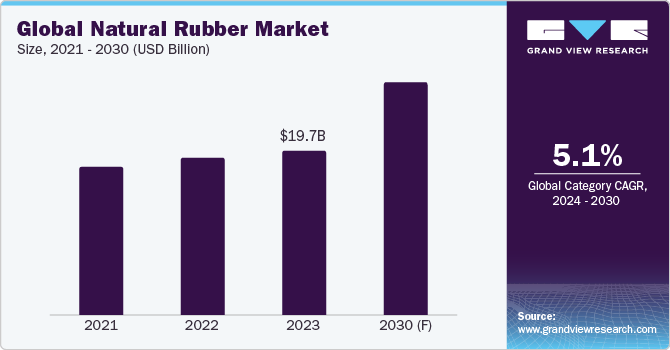
Natural rubber procurement is a vital activity as it is a key product across major industries like automotive, manufacturing, and healthcare. The market is expected to grow at a CAGR of 5.09% from 2024 to 2030. This commodity is considered a critical raw material (CRM) in the EU.The European tire and rubber industry is heavily reliant on this commodity, which accounts for 100% of its imports. It serves as a key enabler for the automotive industry. Currently, almost 60%-75% of the total global natural rubber production is absorbed by the tire industry followed by medical gloves, with a share of 12%-17%. Over 20% of the commodity used in the EU is currently procured from Africa.
The U.S. heavily depends on synthetic rubber; however, the increasing demand for natural rubber (used in the manufacturing of medical gloves and devices) in the domestic market due to various diseases and threats is contributing to the growth of the market. Similar to the EU, the U.S. relies entirely on imports for this category.
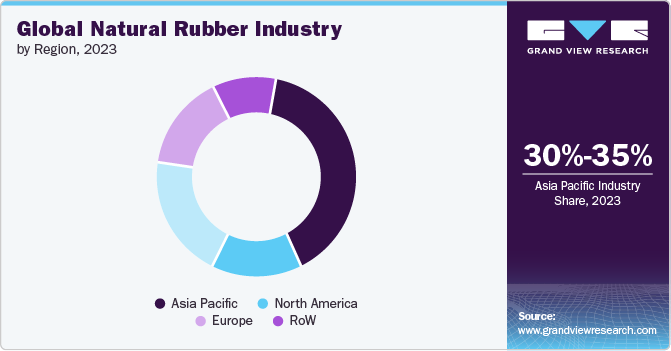
The global natural rubber market size was estimated at USD 19.73 billion in 2023. On a geographical front, the Asia Pacific region accounted for 30%-35% of the total share. This can be mainly attributed to the presence of a large number of suppliers and manufacturers across Thailand, Malaysia, and Indonesia. In terms of supply, Thailand is responsible for 35%-38% of the market share followed by Indonesia, having a share of 22%-28%. China and India are among the top consumers of this commodity. In 2023, global consumption of this category amounted to 13.9 million tons compared to 14.3 million tons in 2022. In 2023, China's consumption amounted to 5.91 million tons. The demand for this product from China is also rising steadily due to its robust EV and automobile market.
One of the key trends in the market is the growing use of new types of jute composites, biocomposites or green composites combined with natural rubber. These materials are increasingly being used in construction materials, such as boards and flooring materials, interior moldings (vehicles), shoe soles (footwear), and anti-static moldings. Thus, the increasing demand from the automotive industry, expanding applications across construction, healthcare, footwear, and consumer goods, combined with increasing environmental concerns and a shift towards sustainable practices, are driving the growth of this market.
Globally, automobile manufacturers are, in particular, very significant. This is because, as per WWF, a single company often purchases 50 million new tires every year. It is estimated that by 2050, with the increasing growth of automobiles, companies that manufacture or use tires will have a significant impact on forests and, thus, the environment. In line with sustainable practices, companies are increasingly incorporating sustainability into their supply chain frameworks. For instance, Michelin, Pirelli, Bridgestone, Goodyear, Sumitomo, Continental, Yokohama, Hankook, Toyo Tires, and General Motors are following the practice of responsible and sustainable rubber sourcing. Many companies are also partnering with governments to restore unlawful acres and plantations to semi-natural forests.
Supplier Intelligence
“What is the natural rubber industry's supplier landscape?"
This industry’s supply chain is complex and highly fragmented. The industry encompasses different types of players, such as smallholder farmers, raw materials suppliers/dealers, processors and plant harvesters, rubber products manufacturers and eventually traders or distributors. Most of the supplier or manufacturer fragmentation occurs from these specific regions - Southeast Asia, Africa, and South America. Many product manufacturers are smallholder farmers who do not have the economies of scale and resources to compete with large-scale players. On the other hand, many companies have rubber plantations dispersed across various regions and nations across the globe which further contributes to fragmentation. The trend is attributed to each region having its own set of market dynamics, regulatory requirements and challenges.
Post latex harvesting; the latex processing is done by numerous players at local, regional, national and international levels before arriving at tire or end-user industries. The supply zone bases of the processors are also extensive. There are more than 6 million smallholder farmers for this commodity worldwide. These farmers sell their production to about 100,000 dealers, who then forward it to more than 500 factories.
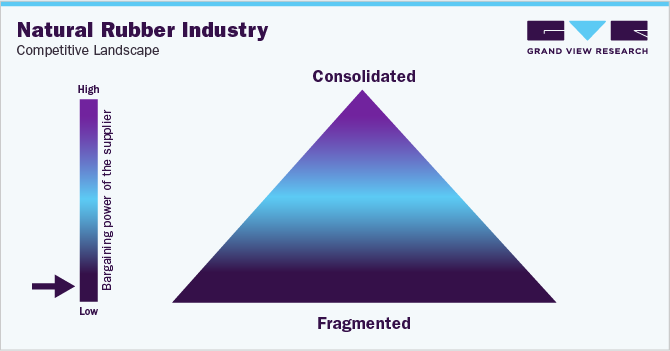
According to the European Tyre & Rubber Association, natural rubber sourced from Hevea trees remains irreplaceable across all current applications. Hence, the threat of substitutes is almost low to negligible in the tire industry. However, in other applications, alternatives, such as synthetic rubber [for instance, Styrene Butadiene Rubber (SBR), Polybutadiene Rubber (PR), Nitrile Rubber (NBR) and Ethylene Propylene Diene Monomer (EPDM)], rubber composites, or silicone rubber, may be used in lower proportions. As a result, overall, the threat of substitutes remains low. Similarly, the bargaining power of suppliers is low due to the increased fragmentation.
Key suppliers covered in the industry:
-
Vietnam Rubber Industry Group
-
Hevea-Tec (Pirelli & C. S.p.A)
-
Thai Hua Rubber Company Limited (Guangdong Guangken Rubber Group)
-
Sri Trang Agro-Industry Plc
-
Tong Thai Rubber Co., Ltd.
-
Kuala Lumpur Kepong Berhad
-
Thai Rubber Latex Group Public Company Limited
-
Hainan Natural Rubber Industry Group Co., Ltd.
-
Feltex Co., Ltd
-
Enghuat Industries Limited
-
Southland Holding Company
- Von Bundit Co., Ltd.
Pricing and Cost Intelligence
“What are some of the major costs associated with the natural rubber industry?"
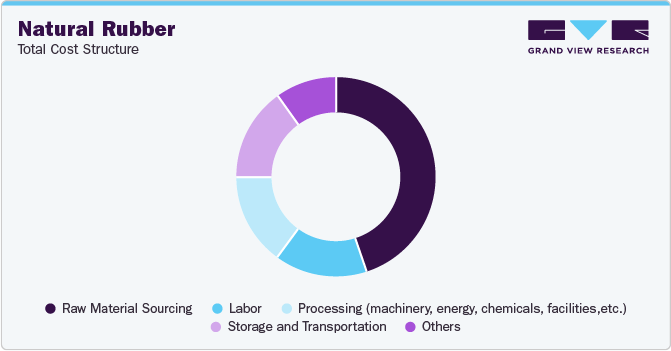
The total cost structure consists of raw material sourcing, labor, processing (machinery, energy, chemicals and facilities), storage and transportation, and others. Other costs may include investments in R&D, compliance and testing, utilities and administrative expenses. Raw materials sourcing includes acquiring and maintaining rubber plantations, land costs, and harvesting expenses, all of which constitute a significant portion of the production costs. Labor costs entail different activities, such as planting, tapping, packaging and processing.
Skilled labor is of essential importance and may come with higher wage demand. Processing this commodity requires huge amounts of energy, particularly for heating, drying and other stages. As a result, fluctuations in the prices of different materials, including latex, chemicals, additives, activators, and agents, combined with changes in energy prices, can significantly impact the cost structure.
In April 2024, global category prices were on the elevated side due to several changes in major importing and exporting nations. Thailand, one of the key players, faced a lot of disruptions in raw material production as many areas stopped cutting operations. Thai adhesives, as a result of category supply constraints, caused a lot of price fluctuations in the middle of April. Similarly, Vietnam and China continued to face manufacturing problems. Vietnam's production zones were yet to begin harvesting, while China's drought-related concerns hampered rubber-cutting efforts.
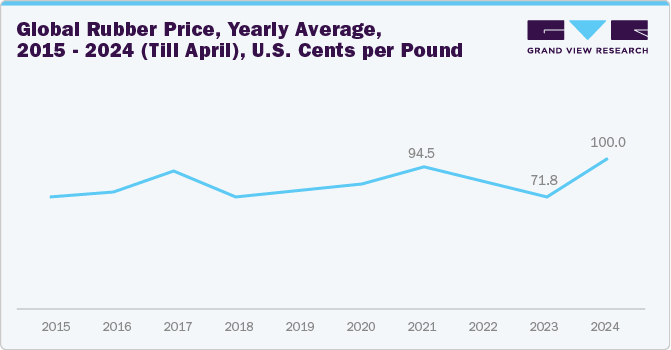
Regardless of these problems, China's Hainan province, aided by high temperatures, witnessed an increase in rubber-cutting activities at the end of April 2024. This, combined with supply increases and soaring raw material prices in Hainan, supported the commodity market. Robust production from the tire manufacturing segment contributed to sustained demand for this category in both April and May 2024. However, tire companies continue to exercise caution in their procurement practices as rubber prices rise.
In April 2024, the global prices reached 107.78 U.S. cents per pound. In May 2024, Thailand's rubber prices (unsmoked sheet) reached USD 2.18 per kg. Ribbed smoked sheet prices reached USD 2.31 per kg in Thailand at the end of May 2024.
Sourcing Intelligence
“What are some of the sourcing strategies followed by companies? What are the export statistics for natural rubber?"
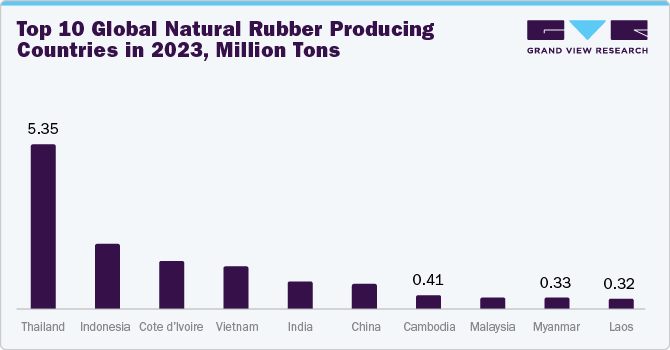
The top manufacturing countries are Thailand, Indonesia, Vietnam, India, and China. These nations are likely to be the most suitable for procurement based on LCC/BCC analysis. Other notable producing countries include Malaysia, the Philippines, Côte d'Ivoire, and Cambodia. In 2023, global production for this commodity amounted to 14.5 million tons. Thailand is the dominant producer of this commodity and produced 5.35 million tons in 2023. The nation accounted for 30%-33% of global exports in 2023, translating to 3.98 million tons of export of natural rubber, followed by Vietnam and Indonesia. The total global exports for this product in 2023 were around 12.6 million tons.
In terms of natural rubber sourcing intelligence, tire companies, for instance, use a combination of procurement strategies like direct sourcing, supplier partnerships, and a vertical integration approach to ensure a reliable, sustainable, and cost-efficient supply chain. Direct sourcing from plantations allows companies to have more control over quality and product. One of the most popular examples is that of the Michelin Group, which procures this category (product) either from independent suppliers or from natural rubber joint ventures where Michelin has a lower minority shareholding. All commodity sourcing can be traced back to the processing factory. The company directly owns some plantations and processing facilities in Brazil and Indonesia.
Further, the company has associations or joint ventures with 6 to 8 companies. Third-party commodity sourcing accounts for a nominal 2%-3% of the company's sourcing operations. 65% of Michelin's natural rubber is procured from smallholders that can be traced back to the jurisdiction level. 80% of the commodity is sourced from industrial and medium plantations.
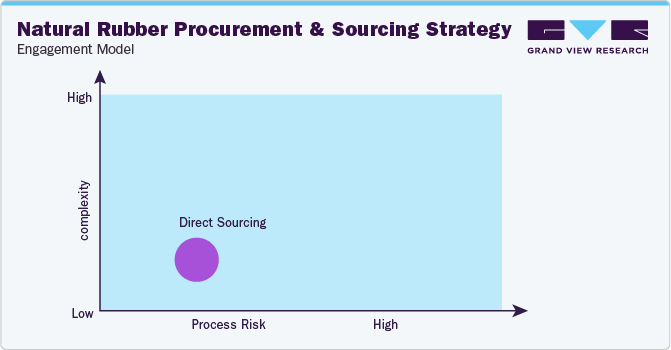
“In the direct sourcing model, the client or end-user company procures the commodity directly from plantations or farmers to have more control over the quality and the finished product".
Most of the other end-user companies in adhesives, footwear, healthcare, and engineering/construction follow direct sourcing and a mix of supplier partnerships model. Companies evaluate suppliers on multiple parameters, such as international standards, sustainability practices, and certifications. They ensure that their suppliers are responsibly sourcing raw materials, following ethical practices, and meeting high-quality and standards such as ISO, ASTM, or any specific control measures required by the country or region. Additionally, suppliers' production capacity is assessed to check if they can meet the client's requirements and delivery schedules and handle demand fluctuations.
The report also provides details regarding peer analysis, recent supplier developments, supply-demand analysis, competitive landscape, KPIs, SLAs, risk assessment, negotiation strategies and low-cost/best-cost sourcing analysis. In the report, we have tried to provide a holistic industry perspective, an overview of the supplier landscape - the presence of different types of players and the competitive pressure within the industry as a whole (PORTER’s). Raw material sourcing is a significant expense in this industry because acquiring, planting, and harvesting make up a substantial portion of production expenses. Similarly, the supply chain practices under sourcing and procurement are also covered. One such instance is the operating model that encompasses all the business processes conducted within an organization. It is an integral aspect of the company's operations and plays a crucial role in its success.
Natural Rubber Procurement Intelligence Report Scope
|
Report Attribute |
Details |
|
Growth Rate |
CAGR of 5.09% from 2024 to 2030 |
|
Base Year for Estimation |
2023 |
|
Pricing Growth Outlook |
3%-8% (Annual) |
|
Pricing Models |
Spot pricing, long term contract pricing, cost plus pricing, market based or competitive pricing model |
|
Supplier Selection Scope |
Cost and pricing, past engagements, productivity, geographical presence |
|
Supplier Selection Criteria |
Type of natural rubber, production capacity, grades offered, technical specifications, and other operational and functional capabilities |
|
Report Coverage |
Revenue forecast, supplier ranking, supplier matrix, emerging technology, pricing models, cost structure, competitive landscape, growth factors, trends, engagement, and operating model |
|
Key Companies Profiled |
Vietnam Rubber Industry Group, Hevea-Tec, Thai Hua Rubber Company Limited (Guangdong Guangken Rubber Group), Sri Trang Agro-Industry Plc, Tong Thai Rubber Co., Ltd., Kuala Lumpur Kepong Berhad, Thai Rubber Latex Group Public Company Limited, Hainan Natural Rubber Industry Group Co., Ltd., Feltex Co., Ltd, Enghuat Industries Limited, Southland Holding Company, Von Bundit Co., Ltd. |
|
Regional Scope |
Global |
|
Revenue Forecast in 2030 |
USD 27.93 billion |
|
Historical Data |
2021 - 2022 |
|
Quantitative Units |
Revenue in USD billion and CAGR from 2024 to 2030 |
|
Customization Scope |
Up to 48 hours of customization free with every report. |
|
Pricing and Purchase Options |
Avail customized purchase options to meet your exact research needs. Explore purchase options |
Frequently Asked Questions About This Report
b. The global natural rubber market size was valued at USD 19.73 billion in 2023 and is estimated to witness a CAGR of 5.09% from 2024 to 2030.
b. Factors such as the high demand for tires globally owing to robust growth in automobile manufacturing, increasing demand for environmentally sustainable products, and expansion in construction industries are driving the growth of natural rubber.
b. According to LCC/BCC analysis, Thailand, Indonesia, Vietnam, India, and China are the ideal countries for sourcing natural rubber.
b. The natural rubber industry is highly fragmented. Some of the leading players are Vietnam Rubber Industry Group, Hevea-Tec (Pirelli & C. S.p.A), Thai Hua Rubber Company Limited (Guangdong Guangken Rubber Group), Sri Trang Agro-Industry Plc, Tong Thai Rubber Co., Ltd., Kuala Lumpur Kepong Berhad, Thai Rubber Latex Group Public Company Limited, Hainan Natural Rubber Industry Group Co., Ltd., Feltex Co., Ltd, Enghuat Industries Limited, Southland Holding Company, Von Bundit Co., Ltd.
b. Some of the key cost components include raw material sourcing, labor, processing (machinery, energy, chemicals, facilities, etc.), storage and transportation, and others. Other costs may include investments in R&D, compliance and testing, utilities and administrative expenses.
b. As part of their procurement strategy, companies ensure that their suppliers are responsibly sourcing raw materials, following ethical practices, and meeting high-quality and standards such as ISO, ASTM, or any specific control measures required by the country or region. Additionally, they evaluate the supplier's production capacity to check if it can meet the client's requirements, delivery schedules, and handle demand fluctuations.
Add-on Services
Should Cost Analysis
Component wise cost break down for better negotiation for the client, highlights the key cost drivers in the market with future price fluctuation for different materials (e.g.: steel, aluminum, etc.) used in the production process
Rate Benchmarking
Offering cost transparency for different products / services procured by the client. A typical report involves 2-3 case scenarios helping clients to select the best suited engagement with the supplier
Salary Benchmarking
Determining and forecasting salaries for specific skill set labor to make decision on outsourcing vs in-house.
Supplier Newsletter
A typical newsletter study by capturing latest information for specific suppliers related to: M&As, technological innovations, expansion, litigations, bankruptcy etc.


