
Corn Procurement Intelligence Report, 2024 - 2030 (Revenue Forecast, Supplier Ranking & Matrix, Emerging Technologies, Pricing Models, Cost Structure, Engagement & Operating Model, Competitive Landscape)
- Published Date: Aug, 2023
- Base Year for Estimate: 2023
- Report ID: GVR-P-10524
- Format: Electronic (PDF)
- Historical Data: 2021 - 2022
- Number of Pages: 60
Corn - Procurement Trends
“The corn market growth is driven by the increasing demand for animal feed, biofuels, and processed meals.”
Corn procurement has witnessed heightened demand in light of the soaring penetration of animal feed, biofuels, and processed meals. The global market is expected to depict a CAGR of 3.6% from 2024 to 2030. Burgeoning demand for meat is likely to shape the dynamics of corn, a primary ingredient in animal feed. It is a key element of nearly every type of compound food used for animals, such as ruminant species, poultry, swine, and fisheries. Therefore, to meet the growing demand for feed, the supply of corn is also increased at the appropriate scale by increasing production globally.
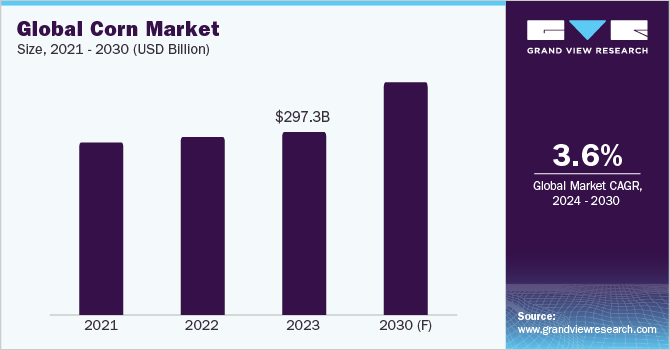
The global corn market size was estimated at USD 297.27 billion in 2023. Corn is used to make ethanol, a biofuel that can be used in place of gasoline. Concerns about climate change and pollution are projected to drive up demand for biofuels. It is also a key ingredient in many processed foods, including cornflakes, corn chips, and tortillas. Because of the convenience and affordable cost associated with it, processed foods are projected to rise in popularity in the coming years, which will further drive market growth.
Precision farming, drip irrigation, harvesting robots, and storage & transportation are the various technologies used to improve the production, efficiency, and quality of corn. Precision farming uses data collected from GPS, yield monitors, and soil sensors to help farmers make more informed decisions about how to manage their crops. Drip irrigation delivers water directly to the roots of plants, which can help to conserve water and improve crop yields. Harvesting robots can help to reduce the cost of harvesting and improve the quality of the harvested crops. Storage and transportation technologies, such as grain silos, grain elevators, and refrigerated trucks, are used to store and transport corn properly so that it does not spoil. Biotechnology has also enabled the development of genetically modified corn varieties that are resistant to pests and diseases. They can also be engineered to have higher nutritional content or to produce more ethanol for fuel.
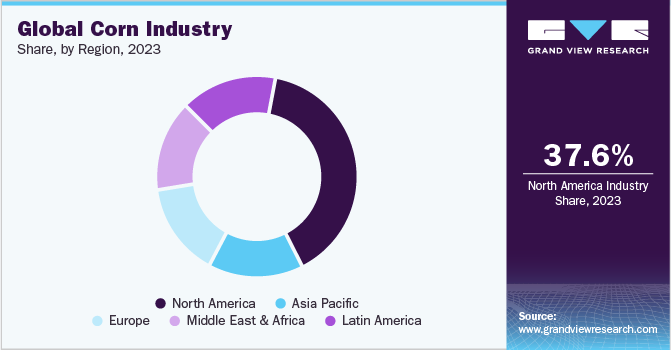
North America is the world's largest corn producer, accounting for 37.6% of global production in 2023. China is the top producer and importer in APAC, whereas the U.S. is the top producer and exporter in North America. France is Europe's top producer, followed by Germany, and the demand is driven by uses in the food and feed industry. Egypt is the region's top producer in MEA, followed by South Africa. Brazil is the country in Latin America that produces the most corn, followed by Argentina and Mexico.
Supplier Intelligence
“How can the nature of the global corn industry be best described? Who are the key players in this market?”
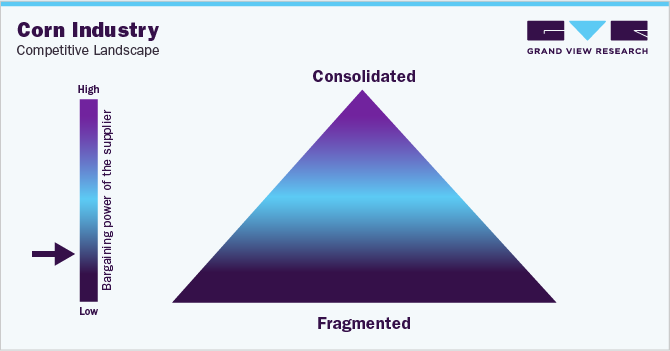
The industry exhibits a highly fragmented landscape, with a large number of producers, processors, and traders of maize, and each of these groups having a relatively small market share. The prevailing dynamics make it difficult for any one company to have a significant impact on the market price of corn. It is a relatively easy crop to grow, and many farmers around the world produce it. A versatile crop can be used for a variety of purposes, which makes it attractive to a wide range of buyers. The fragmentation in this category has created challenges for farmers and traders, as it is difficult to access information about prices, quality standards, and market demand.
The industry has also created opportunities for innovation and entrepreneurship, as smaller players are often more agile and responsive to changing market conditions. For example, a small trader may be able to quickly identify an opportunity to buy corn at a low price and sell it at a higher price. This is because they have a smaller trading desk and can make decisions more quickly than a larger trader.
The global nature of the industry suggests companies can sell their products to customers all over the world. This gives small and medium-sized companies access to a large market, which can help them grow and succeed. Achieving a dominant market share in this category is challenging due to the large number of small and medium-sized companies. Additionally, the market's fragmentation makes it challenging for companies to innovate due to the diverse market segments with unique needs.
Sanitary and phytosanitary regulations prevent pest and disease spread in corn, covering insecticides and pesticide use, and labeling. Technical barriers to trade regulations ensure these products meet quality and safety standards, including labeling, testing, and traceability. Trade agreements set minimum standards for safety and quality, as well as rules for trade. These regulations are essential for maintaining the integrity of the products and ensuring their safety and quality, thereby redefining the procurement landscape.
Key suppliers covered in the industry:
-
Bayer AG
-
Corteva Agriscience
-
Syngenta Group
-
Satake
-
Bunge Global SA
-
Glencore plc
-
Cargill, Incorporated
-
Groupe Limagrain Holding
-
Archer Daniels Midland Company (ADM)
-
The Scoular Company
-
CHS Inc.
-
Ingredion Incorporated
Pricing and Cost Intelligence
“What are some of the key cost components or elements involved in the corn industry? Which factors influence the prices?”
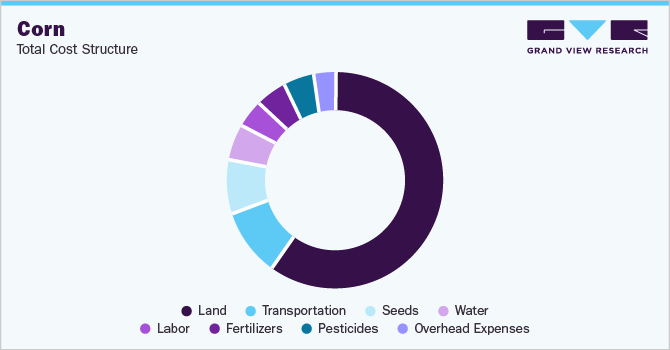
The land is the largest cost component in this market. Land costs can vary depending on the region where the corn is grown along with the quality of the land and the market conditions. Raising a crop has cost around USD 882 per acre, which is 19% more in 2022 than in 2021. The cost of seeds is also the major cost component; the cost varies depending on the variety of corn grown. The cultivation is an expensive venture, with the four key cost components being seeds, fertilizer, insecticides, and water. The cost of each component varies depending on the type of corn farmed, farming techniques used, and farm location.
The cost of seeds, for example, can vary based on the species of corn sown. Because hybrid corn seeds are developed to produce larger yields, they are often more expensive than traditional seeds. A bag of hybrid seeds costs around USD 160 - USD 180. The cost of fertilizer varies based on the type of fertilizer utilized. Pesticide prices might also vary based on the type of pesticide utilized. In general, insecticides are more expensive than herbicides. Water costs can also differ based on where the farm is located. Farms located in water-stressed areas may have to pay extra for water. Corn crop yields require 600,000 gallons per acre, which costs around USD 1,000 per acre.
The following chart provides various costs incurred in this industry; the major cost heads are shown below:
Businesses generally use volume-based pricing where the price of corn is based on the amount being sold. This can encourage larger purchases since the price per unit will decrease as the volume of maize increases. By selling larger quantities of corn at a lower price per unit, producers and suppliers can generate more revenue while keeping their costs relatively low. This can lead to increased profitability and foster procurement decisions.
Sourcing Intelligence
“Which countries are the leading sourcing destinations in the corn category?”
The United States is the largest producer of this sector. The country’s vast agricultural land, favorable climate, and advanced farming techniques make it the world’s most efficient producer of this commodity. The U.S. market is expected to continue to grow in the coming years, as the demand for corn-based products such as ethanol and animal feed increases. The United States is well-positioned to remain the world's largest producer in this field, as it has the resources and infrastructure to support continued growth.

China is another top competitor in this landscape and has grown significantly in recent years due to its government policies aimed at supporting agricultural production and increasing food security. China’s livestock industry is a major consumer of corn, as the crop is used for animal feed. The country has invested in irrigation and other infrastructure to support agricultural production, which has helped to increase yields and production levels.
In terms of corn procurement sourcing intelligence, most suppliers opt for an in-house service provider, which is used through a forward contract between corn suppliers and producers to purchase or sell a certain amount of the product at a future date and a fixed price. It allows producers to secure a market for their maize and provides buyers with a reliable source of supply. It has also involved vertical integration, where companies in the corn supply chain work together to create a more efficient and streamlined production process. It also involves the use of technology to improve supply chain efficiency. For example, the use of blockchain helps to create more transparent and traceable supply chains, which can improve quality control and reduce the risk of fraud.
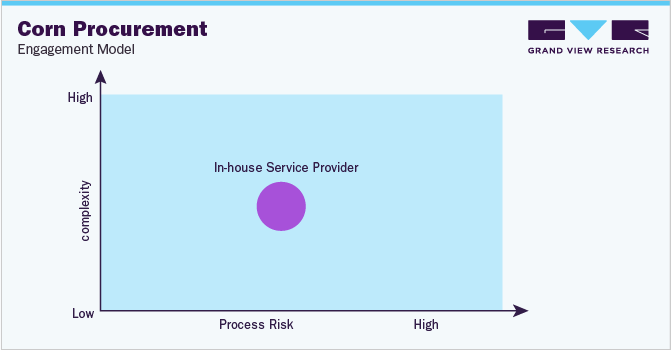
“In the in-house service provider model, the client carries out the complete operations in-house operation.”
An in-house engagement model in the procurement of corn involves a company handling all aspects of its corn trading operations internally, including sourcing, risk management, trading contracts, and delivering corn to customers. This model offers several advantages, including complete control over operations, cost reduction, and building relationships with producers and buyers, which are crucial for securing long-term contracts. Companies can react quickly to market changes and implement their own trading strategies, benefiting from the flexibility and cost-effectiveness of this business model.
The report also provides details regarding peer analysis, recent supplier developments, supply-demand analysis, competitive landscape, KPIs, SLAs, risk assessment, negotiation strategies and low-cost/best-cost sourcing analysis. In the report, we have tried to provide a holistic industry perspective, an overview of the supplier landscape – the presence of different types of players and the competitive pressure within the industry as a whole (PORTER’s). Similarly, the supply chain practices under sourcing are also covered. One such instance is the operating or engagement model which encompasses all the business processes conducted within an organization. It is an integral aspect of the company's operations and plays a crucial role in its success.
Corn Procurement Intelligence Report Scope
|
Report Attribute |
Details |
|
Growth Rate |
CAGR of 3.6% from 2024 to 2030 |
|
Base Year for Estimation |
2023 |
|
Pricing Growth Outlook |
3% - 5% (Annual) |
|
Pricing Models |
Volume-based pricing model and cost-plus pricing model |
|
Supplier Selection Scope |
Cost and pricing, past engagements, productivity, geographical presence |
|
Supplier Selection Criteria |
Sustainability, price, quality, reliability, flexibility, technical specifications, operational capabilities, regulatory standards and mandates, category innovations, and others. |
|
Report Coverage |
Revenue forecast, supplier ranking, supplier positioning matrix, emerging technology, pricing models, cost structure, competitive landscape, growth factors, trends, engagement, and operating model |
|
Key Companies Profiled |
Bayer AG, Corteva Agriscience, Groupe Limagrain, Bunge Global SA, Syngenta Group, Satake, Glencore plc, Cargill, Incorporated, Groupe Limagrain, Archer Daniels Midland Company (ADM), The Scoular Company, CHS Inc., Ingredion Incorporated |
|
Regional Scope |
Global |
|
Historical Data |
2021 - 2022 |
|
Revenue Forecast in 2030 |
USD 377.27 billion |
|
Quantitative Units |
Revenue in USD billion and CAGR from 2024 to 2030 |
|
Customization Scope |
Up to 48 hours of customization free with every report. |
|
Pricing and Purchase Options |
Avail customized purchase options to meet your exact research needs. Explore purchase options |
Frequently Asked Questions About This Report
b. The global corn market size was valued at approximately USD 297.27 billion in 2023 and is estimated to witness a CAGR of 3.6% from 2024 to 2030.
b. Increasing use of corn for biofuels, growing demand for feed and increasing global population are driving the growth of the market.
b. According to the LCC/BCC sourcing analysis, the US and China are the ideal destinations for sourcing corn category.
b. This category is highly fragmented with the presence of many large players competing for the market share. Some of the key players are Bayer AG, Corteva Agriscience, Groupe Limagrain, Bunge, Syngenta Group, Satake, Glencore, Cargill, Groupe Limagrain, and ADM.
b. Seeds, land, and transportation cost are the major key components of this industry. Other key cost includes labor, fertilizers and pesticides
b. Select appropriate logistics partners, monitor the market to get the fair price and consider a future contract are some of the best sourcing practices in this market.
Add-on Services
Should Cost Analysis
Component wise cost break down for better negotiation for the client, highlights the key cost drivers in the market with future price fluctuation for different materials (e.g.: steel, aluminum, etc.) used in the production process
Rate Benchmarking
Offering cost transparency for different products / services procured by the client. A typical report involves 2-3 case scenarios helping clients to select the best suited engagement with the supplier
Salary Benchmarking
Determining and forecasting salaries for specific skill set labor to make decision on outsourcing vs in-house.
Supplier Newsletter
A typical newsletter study by capturing latest information for specific suppliers related to: M&As, technological innovations, expansion, litigations, bankruptcy etc.


