The global women’s health market size was valued at USD 44.36 billion in 2023 and is expected to grow at a compound annual growth rate (CAGR) of 5.7% from 2024 to 2030. Market growth can be attributed to the increase in the geriatric population of women and the introduction of new advanced therapeutic products for women’s health, such as Relugoliz and Orilissa. Furthermore, favorable policies initiated by governments to improve women’s health and raise awareness are likely to drive market growth during the forecast period. The market exhibited slower growth during the pandemic.
Access to gynecological testing and contraception has fallen, raising the rate of unsafe abortions and unwanted pregnancies, especially in developing nations. Moreover, according to BMC, in low- and middle-income countries, there has been around a 10% decline in the use of long- and short-acting reversible contraceptives and about a 10% decline in basic services related to pregnancy care. These factors led to a reduction in market growth during the pandemic. Women are more exposed to various diseases such as osteoporosis, endometriosis, osteoarthritis, and menstrual health disorders.
Approximately 73% of postmenopausal women experience fatigue, hot flashes, and sleep disturbances, which increase dependency on medications, decreasing the quality of life. With aging population and the rising prevalence of obesity, osteoporosis is expected to grow. Some of the major factors leading to hormonal imbalance in women are changes in dietary habits, stress, and alcohol consumption, which are expected to cause fertility issues in women. Ovulation problems, PCOS, and endometriosis are some of the major causes of infertility. In August 2023, the University at Buffalo published new research on the relationship between pain in endometriosis and endometrial lesions. The research is expected to lead to new therapies for this painful, chronic, and inadequately understood condition that affects around 5-10% of women globally and costs an estimated USD 69 billion in surgical and medical expenses.
These factors are anticipated to fuel market growth. According to the Society of Family Planning's #WeCount Report, in the U.S., from July 2022 to June 2023, the average monthly number of abortions was 82,298. Owing to the high unmet need for publicly funded contraceptive services and products, federal & state governments are actively working toward improving family planning services and improving access to modern contraceptives. Market players are adopting various market strategies, such as collaboration and awareness and marketing campaigns, to increase their market penetration in the country. For instance, in October 2022, Abbott conducted a survey in partnership with Ipsos to raise awareness and support women during the menopause phase. Moreover, Abbott is planning to launch, The Next Chapter campaign, to raise awareness among women with menopause
According to the United Nations Population Fund's (UNFPA) article published in September 2023, philanthropies and governments invest in family planning supplies. The Bill & Melinda Gates Foundation invested up to USD 100 million in the UNFPA Supplies Partnership. The Government of Germany invested USD 50.5 million to support the UNFPA Supplies Partnership. Furthermore, agencies such as USAID conduct family planning & reproductive health programs in more than 30 countries, including South Africa & other African countries, where there is a high unmet need for contraception. However, there are various complications and negative effects of the continuous use of contraceptives, which lead to an increase in the adoption of traditional contraceptive methods.
The market growth stage is high, and the market growth is accelerating. The women’s healthcare market is characterized by a high degree of innovation due to rapid technological advancements driven by next-generation contraceptives, artificial intelligence (AI) powered ultrasounds, and future-ready diagnostics tools. Furthermore, in September 2023, according to the National Institutes of Health’s study, AI and machine learning (ML) can effectively detect PCOS.
The women’s health market is also characterized by a high level of merger and acquisition (M&A) activity by the leading players. This is due to several factors, including the desire to gain access to new AI technologies and talent, need to consolidate in a rapidly growing market, and increasing strategic importance of AI, and more.
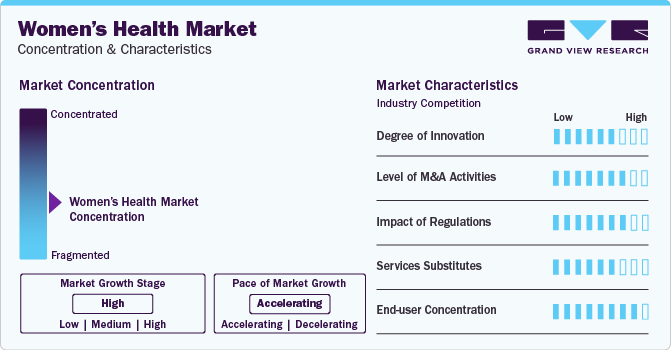
The women’s health market is also subject to increasing regulatory scrutiny. For instance, the unfavorable regulations regarding abortion in the U.S. have a significant impact on the market. Rising emphasis on personalized medicine for women is one of the major trends for market growth.Advancements in medical technology, such as telehealth & genetic testing, offer avenues for enhanced accessibility and tailored treatments. The expanding focus on mental health within women's healthcare further opens doors for novel interventions.Emerging markets and a growing trend toward preventive care create a favorable landscape for industry players.
The market has a presence of several players catering to different areas in the women’s health market. Furthermore, the players actively develop and launch products to treat various women’s health issues and other business initiatives to strengthen their position in the market. Hence, it has promoted strong competition in the market globally.
End-user concentration is a significant factor in the women’s health market. Since there are several end-user industries that are driving demand for women’s healthcare facilities. The concentration of demand of end-user industries creates opportunities for companies that focus on developing women’s health solutions for these industries. However, it also creates challenges for companies that are trying to compete in the market.
The contraceptives segment held the highest market share of more than 35.25% of the global revenue in 2023 due to increased awareness about family planning and rapid technological advancements in contraception. In addition, the approval and launch of new contraceptives contribute to the market growth. For instance, in July 2023, the U.S. FDA approved a nonprescription tablet, Opill (norgestrel). It is the first daily oral contraceptive in the U.S. to use without a prescription.Supportive reimbursement policies by private & government organizations are further estimated to boost market growth. According to a report published by the UN Department of Economic and Social Affairs, around 922 million women of reproductive age (or their partners) were using some form of contraception, and pills were the most common form of contraceptive method used in the U.S.
The menopause segment is expected to grow at the highest CAGR of 9.6% for the forecast period. The growth can be attributed to the increasing population of women reaching menopause and issues and the launch of new products for these conditions. For instance, in December 2023, Astellas Pharma Inc. announced the approval of VEOZA (fezolinetant) 45 mg to treat vasomotor symptoms caused by menopause.
Prolia segment led the market in 2023 and is expected to grow at fastest growth rate over the forecast period. Prolia is a medication used in the field of women's health for the treatment and prevention of osteoporosis in postmenopausal women. The generic name for Prolia is denosumab. Prolia is a monoclonal antibody that works by inhibiting a protein called RANK ligand, which plays a key role in the process of bone resorption. By blocking the RANK ligand, Prolia helps reduce bone loss, increase bone density, and decrease the risk of fractures in postmenopausal women with osteoporosis. It is typically administered as an injection every 6 months by a healthcare professional.
Minastrin 24 Fe segment is expected to grow at the lucrative CAGR over the forecast period. Minastrin 24 Fe is a brand name for a combination birth control pill used in women's health. It contains two hormones: norethindrone acetate (a progestin) and ethinyl estradiol (an estrogen). It is primarily prescribed as an oral contraceptive to prevent pregnancy. Minastrin 24 Fe works by preventing ovulation (the release of an egg from the ovary), thickening the cervical mucus to inhibit sperm movement, and affecting the lining of the uterus to make it less receptive to implantation. As indicated by its name, Minastrin 24 Fe is designed to be taken for 24 consecutive days, followed by a 4-day pill-free period. This results in menstrual-like withdrawal bleeding during the pill-free days.
Based on the age group segment, the market has been further divided into 50 years & above and others. The others segment dominated the market in 2023 and is expected to sustain the position for the forecast period. Women aged below 50 years are more likely to face issues associated with fertility, such as endometriosis, hormonal infertility, and polycystic ovary syndrome. According to the UNICEF, in 2023, there are around 1.16 billion females below 18 years old globally. Hence, the significant population is prone to several women’s health issues, thereby promoting the market.
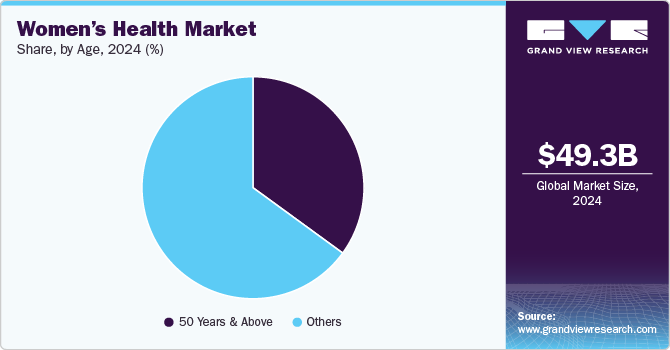
The 50 years & above age segment is expected to register the fastest growth rate over the forecast period as an increase in life expectancy is boosting the overall menopausal population across the globe. In addition, with a rise in the geriatric population, diseases, such as postmenopausal osteoporosis are also increasing. According to an article published in NCBI, the prevalence of postmenopausal osteoporosis in women aged 60 to 69 is around 10.95% and about 26.45% in women aged 70 & above. Other women’s health issues, such as endometriosis, are more likely to occur in reproductive age groups; however, it also affects a small percentage of postmenopausal women.All these factors are expected to drive the growth of this segment in the years to come.
The North American region dominated the market in 2023 with a market share of 41.44%. This growth was attributed to the favorable reimbursement policies, approval & commercialization of products, supportive government laws, and high awareness about the importance of maintaining good health. For instance, in July 2023, Canada announced funding to promote women's health and rights at the 2023 Women Deliver Conference. The country allocated USD 10 million for the "Advancing Sexual and Reproductive Health and Rights project" under Canada's SheSOARS initiative. Moreover, in May 2023, U.S. Department of Health and Human Services announced over USD 65 million to 35 HRSA-funded health centers to address the maternal mortality crisis.
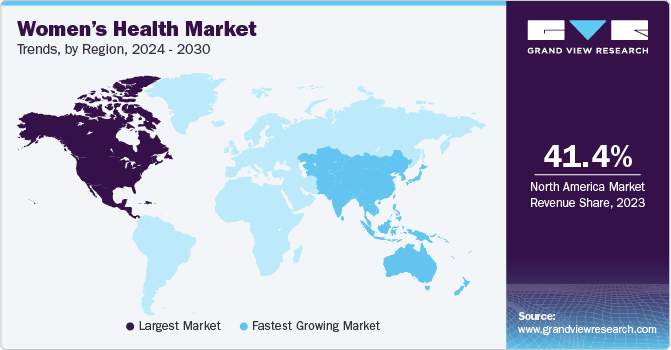
Furthermore, Asia Pacific is expected to witness the fastest CAGR from 2024 to 2030 due to the factors, such as increasing awareness about women’s health and wellbeing, rising geriatric population, and various government initiatives for increasing health awareness. India is one of the lucrative markets for women’s health owing to high unmet needs, large patient base, increasing awareness among people, and favorable government initiatives undertaken by government bodies.For instance, according to the PRS Legislative Research, for 2023-2024, the Government of India allocated around USD 10.68 billion, an increase of 13% from the previous year.Moreover, the prevalence of anemia among pregnant women and nonpregnant women in India was approximately 50.3% and 53.2%, respectively, in 2018. Such a high prevalence of anemia is boosting the growth of women’s health market in India.
Some of the key players operating in the market include AbbVie, Inc., Bayer AG, Merck & Co., Inc., and Pfizer, Inc. These players have wide range of product portfolio by key players, covering a wide range of women’s health solutions to serve diverse consumer pool further increasing the competition among leading players. However, this increase in competition among the players results in decreasing profitability.
TherapeuticsMD, Inc. and Mithra Pharmaceuticals are some of the emerging market participants in the women’s health market. These players usually focus on strategic collaborations and partnerships with leading players to diversify and attain a position in the market.
In December 2023, Theramex completed the acquisition of the Femoston and Duphaston in Europe from Viatris. The company acquired these products for the consolidation of its menopause portfolio.
In September 2023, Merck KGaA, Darmstadt, Germany, announced the launch of an extensive Fertility Benefit program from October 2023. The program was expected to launch in Germany, Switzerland, the UK, China, Taiwan, India, Brazil, and Mexico.
In September 2023, Bayer Indonesia, along with the National Family Planning Coordinating Board (BKKBN) and the Indonesian Midwives Association (IBI), announced the launch of the "Bayer for Her" campaign in Indonesia. It promotes the necessity to improve reproductive health.
In June 2023, Pfizer Inc. announced the restock of DUAVEE, an estrogen-based menopause hormone therapy in the U.S.
Report Attribute |
Details |
Market size value in 2024 |
USD 48.15 billion |
Revenue forecast in 2030 |
USD 67.07 billion |
Growth rate |
CAGR of 5.7% from 2024 to 2030 |
Actual data |
2018 - 2022 |
Forecast period |
2024 - 2030 |
Quantitative units |
Revenue in USD Billion and CAGR from 2024 to 2030 |
Report coverage |
Revenue forecast, company ranking, competitive landscape, growth factors, and trends |
Segments covered |
Application, age, drug, region |
Regional scope |
North America; Europe; Asia Pacific; Latin America; Middle East & Africa |
Country scope |
U.S.; Canada; U.K.; Germany; France; Spain; Italy; Denmark; Sweden; Norway; Japan; China; India; Australia; South Korea; Thailand; Brazil; Mexico; Argentina; South Africa; Saudi Arabia; UAE; Kuwait |
Key companies profiled |
AbbVie, Inc.; Bayer AG; Merck & Co., Inc.; Pfizer, Inc; Teva Pharmaceutical Industries Ltd.; Agile Therapeutics; Amgen, Inc; Apothecus Pharmaceutical Corp.; Blairex Laboratories, Inc.; and Ferring B.V. |
Customization scope |
Free report customization (equivalent up to 8 analysts working days) with purchase. Addition or alteration to country, regional & segment scope. |
Pricing and purchase options |
Avail customized purchase options to meet your exact research needs. Explore purchase options |
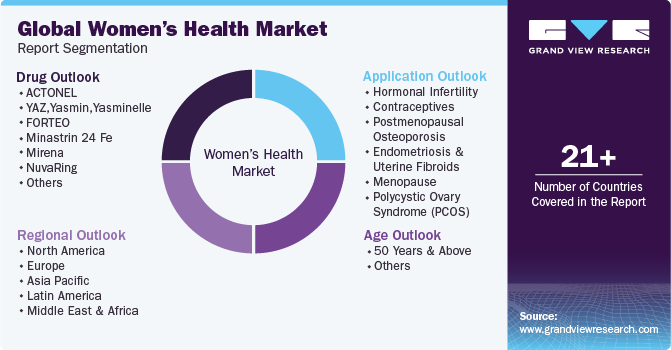
This report forecasts revenue growth at the global, regional, and country levels and provides an analysis of the latest industry trends in each of the sub-segments from 2018 to 2030. For the purpose of this study, Grand View Research has segmented the global women’s health market report on the basis of age, application, drugs, and region:
Application Outlook (Revenue, USD Million, 2018 - 2030)
Hormonal Infertility
Contraceptives
Postmenopausal Osteoporosis
Endometriosis & Uterine Fibroids
Menopause
Polycystic Ovary Syndrome (PCOS)
Drug Outlook (Revenue, USD Million, 2018 - 2030)
ACTONEL
YAZ,Yasmin,Yasminelle
FORTEO
Minastrin 24 Fe
Mirena
NuvaRing
ORTHO TRI-CY LO
Premarin
Prolia
Reclast/Aclasta
XGEVA
Zometa
Others
Age Outlook (Revenue, USD Million, 2018 - 2030)
50 years and above
Postmenopausal Osteoporosis
Endometriosis & Uterine Fibroids
Menopause
Others
Others
Regional Outlook (Revenue, USD Million; 2018 - 2030)
North America
U.S.
Canada
Europe
Germany
U.K.
France
Italy
Spain
Denmark
Sweden
Norway
Asia Pacific
China
India
Japan
Australia
South Korea
Thailand
Latin America
Brazil
Mexico
Argentina
Middle East & Africa
South Africa
Saudi Arabia
UAE
Kuwait
b. The global women's health market size was estimated at USD 44.36 billion in 2023 and is expected to reach USD 48.15 billion in 2024.
b. The global women's health market is expected to grow at a compound annual growth rate of 5.7% from 2024 to 2030 to reach USD 67.07 billion by 2030.
b. The contraceptives segment accounted for the largest share of more than 35.25% of the women’s health market in 2023, due to the growing awareness regarding the usage of contraceptives, favorable reimbursement policies, and rising government and non-profit organization initiatives.
b. Some of the key players operating in the women’s health market are AbbVie, Inc.; Bayer AG; Merck & Co., Inc.; Pfizer; Teva Pharmaceuticals; Agile Therapeutics; Amgen, Inc.; AstraZeneca; Bristol-Myers Squibb; and Ferring B.V.
b. An increase in the population of women aged over 60, a rise in unhealthy lifestyle habits, the introduction of novel medicines for women's health, and the impending approval of pipeline products are some of the factors that drive market growth.
Table of Contents
Chapter 1. Women’s Health Market: Methodology and Scope
1.1. Market Segmentation & Scope
1.2. Segment Definitions
1.2.1. Application
1.2.2. Age
1.2.3. Regional scope
1.2.4. Estimates and forecasts timeline
1.3. Research Methodology
1.4. Information Procurement
1.4.1. Purchased database
1.4.2. GVR’s internal database
1.4.3. Secondary sources
1.4.4. Primary research
1.4.5. Details of primary research
1.4.5.1. Data for primary interviews in North America
1.4.5.2. Data for primary interviews in Europe
1.4.5.3. Data for primary interviews in Asia Pacific
1.4.5.4. Data for primary interviews in Latin America
1.4.5.5. Data for Primary interviews in MEA
1.5. Information or Data Analysis
1.5.1. Data analysis models
1.6. Market Formulation & Validation
1.7. Model Details
1.7.1. Commodity flow analysis (Model 1)
1.7.2. Approach 1: Commodity flow approach
1.7.3. Volume price analysis (Model 2)
1.7.4. Approach 2: Volume price analysis
1.8. List of Secondary Sources
1.9. List of Primary Sources
1.10. Objectives
Chapter 2. Women’s Health Market: Executive Summary
2.1. Market Outlook
2.2. Segment Outlook
2.2.1. Application outlook
2.2.2. Age outlook
2.2.3. Regional outlook
2.3. Competitive Insights
Chapter 3. Women’s Health Market: Variables, Trends & Scope
3.1. Market Lineage Outlook
3.1.1. Parent market outlook
3.1.2. Related/ancillary market outlook
3.2. Market Dynamics
3.2.1. Market driver analysis
3.2.1.1. Rising incidence of target diseases
3.2.1.2. Increasing initiatives by government and various organizations
3.2.1.3. Rising publicly funded family planning services
3.2.2. Market restraint analysis
3.2.2.1. Patent expiry of major drugs
3.2.2.2. Lawsuits related to products
3.2.2.3. Adverse effects associated with use of contraceptive drugs and devices
3.3. Women’s Health Market Analysis Tools
3.3.1. Industry Analysis - Porter’s
3.3.1.1. Supplier power
3.3.1.2. Buyer power
3.3.1.3. Substitution threat
3.3.1.4. Threat of new entrant
3.3.1.5. Competitive rivalry
3.3.2. PESTEL Analysis
3.3.2.1. Political landscape
3.3.2.2. Technological landscape
3.3.2.3. Economic landscape
3.3.3. Pricing Analysis
Chapter 4. Women’s Health Market: Application Estimates & Trend Analysis
4.1. Application Market Share, 2023 & 2030
4.2. Segment Dashboard
4.3. Global Women’s Health Market by Application Outlook
4.4. Market Size & Forecasts and Trend Analyses, 2018 to 2030 for the following
4.4.1. Hormonal infertility
4.4.1.1. Market estimates and forecasts 2018 to 2030 (USD Million)
4.4.2. Contraceptives
4.4.2.1. Market estimates and forecasts 2018 to 2030 (USD Million)
4.4.3. Postmenopausal osteoporosis
4.4.3.1. Market estimates and forecasts 2018 to 2030 (USD Million)
4.4.4. Endometriosis & uterine fibroids
4.4.4.1. Market estimates and forecasts 2018 to 2030 (USD Million)
4.4.5. Menopause
4.4.5.1. Market estimates and forecasts 2018 to 2030 (USD Million)
4.4.6. Polycystic ovary syndrome (PCOS)
4.4.6.1. Market estimates and forecasts 2018 to 2030 (USD Million)
Chapter 5. Women’s Health Market: Drug Estimates & Trend Analysis
5.1. Drug Market Share, 2023 & 2030
5.2. Segment Dashboard
5.3. Global Women’s Health Market by Drug Outlook
5.4. Market Size & Forecasts and Trend Analyses, 2018 to 2030 for the following
5.4.1. ACTONEL
5.4.1.1. Market estimates and forecasts 2018 to 2030 (USD Million)
5.4.2. YAZ, Yasmin, Yasminelle
5.4.2.1. Market estimates and forecasts 2018 to 2030 (USD Million)
5.4.3. FORTEO
5.4.3.1. Market estimates and forecasts 2018 to 2030 (USD Million)
5.4.4. Minastrin 24 Fe
5.4.4.1. Market estimates and forecasts 2018 to 2030 (USD Million)
5.4.5. Mirena
5.4.5.1. Market estimates and forecasts 2018 to 2030 (USD Million)
5.4.6. NuvaRing
5.4.6.1. Market estimates and forecasts 2018 to 2030 (USD Million)
5.4.7. ORTHO TRI-CY LO
5.4.7.1. Market estimates and forecasts 2018 to 2030 (USD Million)
5.4.8. Premarin
5.4.8.1. Market estimates and forecasts 2018 to 2030 (USD Million)
5.4.9. Prolia
5.4.9.1. Market estimates and forecasts 2018 to 2030 (USD Million)
5.4.10. Reclast/Aclasta
5.4.10.1. Market estimates and forecasts 2018 to 2030 (USD Million)
5.4.11. XGEVA
5.4.11.1. Market estimates and forecasts 2018 to 2030 (USD Million)
5.4.12. Zometa
5.4.12.1. Market estimates and forecasts 2018 to 2030 (USD Million)
5.4.13. Others
5.4.13.1. Market estimates and forecasts 2018 to 2030 (USD Million)
Chapter 6. Women’s Health Market: Age Estimates & Trend Analysis
6.1. Age Market Share, 2023 & 2030
6.2. Segment Dashboard
6.3. Global Women’s Health Market by Age Outlook
6.4. Market Size & Forecasts and Trend Analyses, 2018 to 2030 for the following
6.4.1. 50 years and above
6.4.1.1. Market estimates and forecasts 2018 to 2030 (USD Million)
6.4.1.2. Postmenopausal osteoporosis
6.4.1.2.1. Market estimates and forecasts 2018 to 2030 (USD Million)
6.4.1.3. Endometriosis & uterine fibroids
6.4.1.3.1. Market estimates and forecasts 2018 to 2030 (USD Million)
6.4.1.4. Menopause
6.4.1.4.1. Market estimates and forecasts 2018 to 2030 (USD Million)
6.4.1.5. Others
6.4.1.5.1. Market estimates and forecasts 2018 to 2030 (USD Million)
6.4.2. Others
6.4.2.1. Market estimates and forecasts 2018 to 2030 (USD Million)
Chapter 7. Women’s Health Market: Regional Estimates & Trend Analysis
7.1. Regional Market Share Analysis, 2023 & 2030
7.2. Regional Market Dashboard
7.3. Global Regional Market Snapshot
7.4. Market Size, & Forecasts Trend Analysis, 2018 to 2030:
7.5. North America
7.5.1. U.S.
7.5.1.1. Key country dynamics
7.5.1.2. Regulatory framework/ reimbursement structure
7.5.1.3. Competitive scenario
7.5.1.4. U.S. market estimates and forecasts 2018 to 2030 (USD Million)
7.5.2. Canada
7.5.2.1. Key country dynamics
7.5.2.2. Regulatory framework/ reimbursement structure
7.5.2.3. Competitive scenario
7.5.2.4. Canada market estimates and forecasts 2018 to 2030 (USD Million)
7.6. Europe
7.6.1. UK
7.6.1.1. Key country dynamics
7.6.1.2. Regulatory framework/ reimbursement structure
7.6.1.3. Competitive scenario
7.6.1.4. UK market estimates and forecasts 2018 to 2030 (USD Million)
7.6.2. Germany
7.6.2.1. Key country dynamics
7.6.2.2. Regulatory framework/ reimbursement structure
7.6.2.3. Competitive scenario
7.6.2.4. Germany market estimates and forecasts 2018 to 2030 (USD Million)
7.6.3. France
7.6.3.1. Key country dynamics
7.6.3.2. Regulatory framework/ reimbursement structure
7.6.3.3. Competitive scenario
7.6.3.4. France market estimates and forecasts 2018 to 2030 (USD Million)
7.6.4. Italy
7.6.4.1. Key country dynamics
7.6.4.2. Regulatory framework/ reimbursement structure
7.6.4.3. Competitive scenario
7.6.4.4. Italy market estimates and forecasts 2018 to 2030 (USD Million)
7.6.5. Spain
7.6.5.1. Key country dynamics
7.6.5.2. Regulatory framework/ reimbursement structure
7.6.5.3. Competitive scenario
7.6.5.4. Spain market estimates and forecasts 2018 to 2030 (USD Million)
7.6.6. Norway
7.6.6.1. Key country dynamics
7.6.6.2. Regulatory framework/ reimbursement structure
7.6.6.3. Competitive scenario
7.6.6.4. Norway market estimates and forecasts 2018 to 2030 (USD Million)
7.6.7. Sweden
7.6.7.1. Key country dynamics
7.6.7.2. Regulatory framework/ reimbursement structure
7.6.7.3. Competitive scenario
7.6.7.4. Sweden market estimates and forecasts 2018 to 2030 (USD Million)
7.6.8. Denmark
7.6.8.1. Key country dynamics
7.6.8.2. Regulatory framework/ reimbursement structure
7.6.8.3. Competitive scenario
7.6.8.4. Denmark market estimates and forecasts 2018 to 2030 (USD Million)
7.7. Asia Pacific
7.7.1. Japan
7.7.1.1. Key country dynamics
7.7.1.2. Regulatory framework/ reimbursement structure
7.7.1.3. Competitive scenario
7.7.1.4. Japan market estimates and forecasts 2018 to 2030 (USD Million)
7.7.2. China
7.7.2.1. Key country dynamics
7.7.2.2. Regulatory framework/ reimbursement structure
7.7.2.3. Competitive scenario
7.7.2.4. China market estimates and forecasts 2018 to 2030 (USD Million)
7.7.3. India
7.7.3.1. Key country dynamics
7.7.3.2. Regulatory framework/ reimbursement structure
7.7.3.3. Competitive scenario
7.7.3.4. India market estimates and forecasts 2018 to 2030 (USD Million)
7.7.4. Australia
7.7.4.1. Key country dynamics
7.7.4.2. Regulatory framework/ reimbursement structure
7.7.4.3. Competitive scenario
7.7.4.4. Australia market estimates and forecasts 2018 to 2030 (USD Million)
7.7.5. South Korea
7.7.5.1. Key country dynamics
7.7.5.2. Regulatory framework/ reimbursement structure
7.7.5.3. Competitive scenario
7.7.5.4. South Korea market estimates and forecasts 2018 to 2030 (USD Million)
7.7.6. Thailand
7.7.6.1. Key country dynamics
7.7.6.2. Regulatory framework/ reimbursement structure
7.7.6.3. Competitive scenario
7.7.6.4. Thailand market estimates and forecasts 2018 to 2030 (USD Million)
7.8. Latin America
7.8.1. Brazil
7.8.1.1. Key country dynamics
7.8.1.2. Regulatory framework/ reimbursement structure
7.8.1.3. Competitive scenario
7.8.1.4. Brazil market estimates and forecasts 2018 to 2030 (USD Million)
7.8.2. Mexico
7.8.2.1. Key country dynamics
7.8.2.2. Regulatory framework/ reimbursement structure
7.8.2.3. Competitive scenario
7.8.2.4. Mexico market estimates and forecasts 2018 to 2030 (USD Million)
7.8.3. Argentina
7.8.3.1. Key country dynamics
7.8.3.2. Regulatory framework/ reimbursement structure
7.8.3.3. Competitive scenario
7.8.3.4. Argentina market estimates and forecasts 2018 to 2030 (USD Million)
7.9. MEA
7.9.1. South Africa
7.9.1.1. Key country dynamics
7.9.1.2. Regulatory framework/ reimbursement structure
7.9.1.3. Competitive scenario
7.9.1.4. South Africa market estimates and forecasts 2018 to 2030 (USD Million)
7.9.2. Saudi Arabia
7.9.2.1. Key country dynamics
7.9.2.2. Regulatory framework/ reimbursement structure
7.9.2.3. Competitive scenario
7.9.2.4. Saudi Arabia market estimates and forecasts 2018 to 2030 (USD Million)
7.9.3. UAE
7.9.3.1. Key country dynamics
7.9.3.2. Regulatory framework/ reimbursement structure
7.9.3.3. Competitive scenario
7.9.3.4. UAE market estimates and forecasts 2018 to 2030 (USD Million)
7.9.4. Kuwait
7.9.4.1. Key country dynamics
7.9.4.2. Regulatory framework/ reimbursement structure
7.9.4.3. Competitive scenario
7.9.4.4. Kuwait market estimates and forecasts 2018 to 2030 (USD Million)
Chapter 8. Competitive Landscape
8.1. Recent Developments & Impact Analysis, By Key Market Participants
8.2. Company/Competition Categorization
8.3. Vendor Landscape
8.3.1. List of key distributors and channel partners
8.3.2. Key customers
8.3.3. Key company market share analysis, 2023
8.3.4. AbbVie, Inc.
8.3.4.1. Company overview
8.3.4.2. Financial performance
8.3.4.3. Product benchmarking
8.3.4.4. Strategic initiatives
8.3.5. Bayer AG
8.3.5.1. Company overview
8.3.5.2. Financial performance
8.3.5.3. Product benchmarking
8.3.5.4. Strategic initiatives
8.3.6. Merck & Co., Inc.
8.3.6.1. Company overview
8.3.6.2. Financial performance
8.3.6.3. Product benchmarking
8.3.6.4. Strategic initiatives
8.3.7. Pfizer, Inc.
8.3.7.1. Company overview
8.3.7.2. Financial performance
8.3.7.3. Product benchmarking
8.3.7.4. Strategic initiatives
8.3.8. Teva Pharmaceutical Industries Ltd.
8.3.8.1. Company overview
8.3.8.2. Financial performance
8.3.8.3. Product benchmarking
8.3.8.4. Strategic initiatives
8.3.9. Agile Therapeutics
8.3.9.1. Company overview
8.3.9.2. Financial performance
8.3.9.3. Product benchmarking
8.3.9.4. Strategic initiatives
8.3.10. Amgen, Inc.
8.3.10.1. Company overview
8.3.10.2. Financial performance
8.3.10.3. Product benchmarking
8.3.10.4. Strategic initiatives
8.3.11. Apothecary Pharmaceutical Corp.
8.3.11.1. Company overview
8.3.11.2. Financial performance
8.3.11.3. Product benchmarking
8.3.11.4. Strategic initiatives
8.3.12. Blairex Laboratories, Inc.
8.3.12.1. Company overview
8.3.12.2. Financial performance
8.3.12.3. Product benchmarking
8.3.12.4. Strategic initiatives
8.3.13. Ferring B.V.
8.3.13.1. Company overview
8.3.13.2. Financial performance
8.3.13.3. Product benchmarking
8.3.13.4. Strategic initiatives
List of Tables
Table 1 List of abbreviation
Table 2 North America women’s health market, by region, 2018 - 2030 (USD Million)
Table 3 North America women’s health market, by application, 2018 - 2030 (USD Million)
Table 4 North America women’s health market, by drug, 2018 - 2030 (USD Million)
Table 5 North America women’s health market, by age, 2018 - 2030 (USD Million)
Table 6 U.S. women’s health market, by application, 2018 - 2030 (USD Million)
Table 7 U.S. women’s health market, by drug, 2018 - 2030 (USD Million)
Table 8 U.S. women’s health market, by age, 2018 - 2030 (USD Million)
Table 9 Canada women’s health market, by application, 2018 - 2030 (USD Million)
Table 10 Canada women’s health market, by drug, 2018 - 2030 (USD Million)
Table 11 Canada women’s health market, by age, 2018 - 2030 (USD Million)
Table 12 Europe women’s health market, by region, 2018 - 2030 (USD Million)
Table 13 Europe women’s health market, by application, 2018 - 2030 (USD Million)
Table 14 Europe women’s health market, by drug, 2018 - 2030 (USD Million)
Table 15 Europe women’s health market, by age, 2018 - 2030 (USD Million)
Table 16 Germany women’s health market, by application, 2018 - 2030 (USD Million)
Table 17 Germany women’s health market, by drug, 2018 - 2030 (USD Million)
Table 18 Germany women’s health market, by age, 2018 - 2030 (USD Million)
Table 19 UK women’s health market, by application, 2018 - 2030 (USD Million)
Table 20 UK women’s health market, by drug, 2018 - 2030 (USD Million)
Table 21 UK women’s health market, by age, 2018 - 2030 (USD Million)
Table 22 France women’s health market, by application, 2018 - 2030 (USD Million)
Table 23 France women’s health market, by drug, 2018 - 2030 (USD Million)
Table 24 France women’s health market, by age, 2018 - 2030 (USD Million)
Table 25 Italy women’s health market, by application, 2018 - 2030 (USD Million)
Table 26 Italy women’s health market, by drug, 2018 - 2030 (USD Million)
Table 27 Italy women’s health market, by age, 2018 - 2030 (USD Million)
Table 28 Spain women’s health market, by application, 2018 - 2030 (USD Million)
Table 29 Spain women’s health market, by drug, 2018 - 2030 (USD Million)
Table 30 Spain women’s health market, by age, 2018 - 2030 (USD Million)
Table 31 Denmark women’s health market, by application, 2018 - 2030 (USD Million)
Table 32 Denmark women’s health market, by drug, 2018 - 2030 (USD Million)
Table 33 Denmark women’s health market, by age, 2018 - 2030 (USD Million)
Table 34 Sweden women’s health market, by application, 2018 - 2030 (USD Million)
Table 35 Sweden women’s health market, by drug, 2018 - 2030 (USD Million)
Table 36 Sweden women’s health market, by age, 2018 - 2030 (USD Million)
Table 37 Norway women’s health market, by application, 2018 - 2030 (USD Million)
Table 38 Norway women’s health market, by drug, 2018 - 2030 (USD Million)
Table 39 Norway women’s health market, by age, 2018 - 2030 (USD Million)
Table 40 Asia Pacific women’s health market, by region, 2018 - 2030 (USD Million)
Table 41 Asia Pacific women’s health market, by application, 2018 - 2030 (USD Million)
Table 42 Asia Pacific women’s health market, by drug, 2018 - 2030 (USD Million)
Table 43 Asia Pacific women’s health market, by age, 2018 - 2030 (USD Million)
Table 44 China women’s health market, by application, 2018 - 2030 (USD Million)
Table 45 China women’s health market, by drug, 2018 - 2030 (USD Million)
Table 46 China women’s health market, by age, 2018 - 2030 (USD Million)
Table 47 Japan women’s health market, by application, 2018 - 2030 (USD Million)
Table 48 Japan women’s health market, by drug, 2018 - 2030 (USD Million)
Table 49 Japan women’s health market, by age, 2018 - 2030 (USD Million)
Table 50 India women’s health market, by application, 2018 - 2030 (USD Million)
Table 51 India women’s health market, by drug, 2018 - 2030 (USD Million)
Table 52 India women’s health market, by age, 2018 - 2030 (USD Million)
Table 53 South Korea women’s health market, by application, 2018 - 2030 (USD Million)
Table 54 South Korea women’s health market, by drug, 2018 - 2030 (USD Million)
Table 55 South Korea women’s health market, by age, 2018 - 2030 (USD Million)
Table 56 Australia women’s health market, by application, 2018 - 2030 (USD Million)
Table 57 Australia women’s health market, by drug, 2018 - 2030 (USD Million)
Table 58 Australia women’s health market, by age, 2018 - 2030 (USD Million)
Table 59 Thailand women’s health market, by application, 2018 - 2030 (USD Million)
Table 60 Thailand women’s health market, by drug, 2018 - 2030 (USD Million)
Table 61 Thailand women’s health market, by age, 2018 - 2030 (USD Million)
Table 62 Latin America women’s health market, by region, 2018 - 2030 (USD Million)
Table 63 Latin America women’s health market, by age, 2018 - 2030 (USD Million)
Table 64 Latin America women’s health market, by drug, 2018 - 2030 (USD Million)
Table 65 Latin America women’s health market, by application, 2018 - 2030 (USD Million)
Table 66 Brazil women’s health market, by application, 2018 - 2030 (USD Million)
Table 67 Brazil women’s health market, by drug, 2018 - 2030 (USD Million)
Table 68 Brazil women’s health market, by age, 2018 - 2030 (USD Million)
Table 69 Mexico women’s health market, by application, 2018 - 2030 (USD Million)
Table 70 Mexico women’s health market, by drug, 2018 - 2030 (USD Million)
Table 71 Mexico women’s health market, by age, 2018 - 2030 (USD Million)
Table 72 Argentina women’s health market, by application, 2018 - 2030 (USD Million)
Table 73 Argentina women’s health market, by drug, 2018 - 2030 (USD Million)
Table 74 Argentina women’s health market, by age, 2018 - 2030 (USD Million)
Table 75 MEA women’s health market, by region, 2018 - 2030 (USD Million)
Table 76 MEA women’s health market, by application, 2018 - 2030 (USD Million)
Table 77 MEA women’s health market, by drug, 2018 - 2030 (USD Million)
Table 78 MEA women’s health market, by age, 2018 - 2030 (USD Million)
Table 79 South Africa women’s health market, by application, 2018 - 2030 (USD Million)
Table 80 South Africa women’s health market, by drug, 2018 - 2030 (USD Million)
Table 81 South Africa women’s health market, by age, 2018 - 2030 (USD Million)
Table 82 Saudi Arabia women’s health market, by application, 2018 - 2030 (USD Million)
Table 83 Saudi Arabia women’s health market, by drug, 2018 - 2030 (USD Million)
Table 84 Saudi Arabia women’s health market, by age, 2018 - 2030 (USD Million)
Table 85 UAE women’s health market, by application, 2018 - 2030 (USD Million)
Table 86 UAE women’s health market, by drug, 2018 - 2030 (USD Million)
Table 87 UAE women’s health market, by age, 2018 - 2030 (USD Million)
Table 88 Kuwait women’s health market, by application, 2018 - 2030 (USD Million)
Table 89 Kuwait women’s health market, by drug, 2018 - 2030 (USD Million)
Table 90 Kuwait women’s health market, by age, 2018 - 2030 (USD Million)
List of Figures
Fig. 1 Market research process
Fig. 2 Data triangulation techniques
Fig. 3 Primary research pattern
Fig. 4 Primary interviews in North America
Fig. 5 Primary interviews in Europe
Fig. 6 Primary interviews in APAC
Fig. 7 Primary interviews in Latin America
Fig. 8 Primary interviews in MEA
Fig. 9 Market research approaches
Fig. 10 Value-chain-based sizing & forecasting
Fig. 11 QFD modeling for market share assessment
Fig. 12 Market formulation & validation
Fig. 13 Women’s health market: market outlook
Fig. 14 Women’s health competitive insights
Fig. 15 Parent market outlook
Fig. 16 Related/ancillary market outlook
Fig. 17 Penetration and growth prospect mapping
Fig. 18 Industry value chain analysis
Fig. 19 Women’s health market driver impact
Fig. 20 Women’s health market restraint impact
Fig. 21 Women’s health market strategic initiatives analysis
Fig. 22 Women’s health market: Application movement analysis
Fig. 23 Women’s health market: Application outlook and key takeaways
Fig. 24 Hormonal infertility market estimates and forecast, 2018 - 2030
Fig. 25 Contraceptives estimates and forecast, 2018 - 2030
Fig. 26 Postmenopausal osteoporosis market estimates and forecast, 2018 - 2030
Fig. 27 Endometriosis & uterine fibroids estimates and forecast, 2018 - 2030
Fig. 28 Menopause market estimates and forecast, 2018 - 2030
Fig. 29 Polycystic ovary syndrome (PCOS) estimates and forecast, 2018 - 2030
Fig. 30 Women’s health market: Drug movement analysis
Fig. 31 Women’s health market: Drug outlook and key takeaways
Fig. 32 ACTONEL market estimates and forecast, 2018 - 2030
Fig. 33 YAZ, Yasmin, Yasminelle estimates and forecast, 2018 - 2030
Fig. 34 FORTEO market estimates and forecast, 2018 - 2030
Fig. 35 Minastrin 24 Fe estimates and forecast, 2018 - 2030
Fig. 36 Mirena market estimates and forecast, 2018 - 2030
Fig. 37 NuvaRing estimates and forecast, 2018 - 2030
Fig. 38 ORTHO TRI-CY LO market estimates and forecast, 2018 - 2030
Fig. 39 Premarin estimates and forecast, 2018 - 2030
Fig. 40 Prolia market estimates and forecast, 2018 - 2030
Fig. 41 Reclast/Aclasta estimates and forecast, 2018 - 2030
Fig. 42 XGEVA market estimates and forecast, 2018 - 2030
Fig. 43 Zometa estimates and forecast, 2018 - 2030
Fig. 44 Others estimates and forecast, 2018 - 2030
Fig. 45 Women’s health Market: Age movement Analysis
Fig. 46 Women’s health market: Age outlook and key takeaways
Fig. 47 50 years and above market estimates and forecasts, 2018 - 2030
Fig. 48 Postmenopausal osteoporosis market estimates and forecasts,2018 - 2030
Fig. 49 Endometriosis & uterine fibroids market estimates and forecasts,2018 - 2030
Fig. 50 Menopause market estimates and forecasts,2018 - 2030
Fig. 51 Others market estimates and forecasts,2018 - 2030
Fig. 52 Others market estimates and forecasts,2018 - 2030
Fig. 53 Global women’s health market: Regional movement analysis
Fig. 54 Global women’s health market: Regional outlook and key takeaways
Fig. 55 Global women’s health market share and leading players
Fig. 56 North America market share and leading players
Fig. 57 Europe market share and leading players
Fig. 58 Asia Pacific market share and leading players
Fig. 59 Latin America market share and leading players
Fig. 60 Middle East & Africa market share and leading players
Fig. 61 North America: SWOT
Fig. 62 Europe SWOT
Fig. 63 Asia Pacific SWOT
Fig. 64 Latin America SWOT
Fig. 65 MEA SWOT
Fig. 66 North America, by country
Fig. 67 North America
Fig. 68 North America market estimates and forecasts, 2018 - 2030
Fig. 69 U.S.
Fig. 70 U.S. market estimates and forecasts, 2018 - 2030
Fig. 71 Canada
Fig. 72 Canada market estimates and forecasts, 2018 - 2030
Fig. 73 Europe
Fig. 74 Europe market estimates and forecasts, 2018 - 2030
Fig. 75 UK
Fig. 76 UK market estimates and forecasts, 2018 - 2030
Fig. 77 Germany
Fig. 78 Germany market estimates and forecasts, 2018 - 2030
Fig. 79 France
Fig. 80 France market estimates and forecasts, 2018 - 2030
Fig. 81 Italy
Fig. 82 Italy market estimates and forecasts, 2018 - 2030
Fig. 83 Spain
Fig. 84 Spain market estimates and forecasts, 2018 - 2030
Fig. 85 Denmark
Fig. 86 Denmark market estimates and forecasts, 2018 - 2030
Fig. 87 Sweden
Fig. 88 Sweden market estimates and forecasts, 2018 - 2030
Fig. 89 Norway
Fig. 90 Norway market estimates and forecasts, 2018 - 2030
Fig. 91 Asia Pacific
Fig. 92 Asia Pacific market estimates and forecasts, 2018 - 2030
Fig. 93 China
Fig. 94 China market estimates and forecasts, 2018 - 2030
Fig. 95 Japan
Fig. 96 Japan market estimates and forecasts, 2018 - 2030
Fig. 97 India
Fig. 98 India market estimates and forecasts, 2018 - 2030
Fig. 99 Thailand
Fig. 100 Thailand market estimates and forecasts, 2018 - 2030
Fig. 101 South Korea
Fig. 102 South Korea market estimates and forecasts, 2018 - 2030
Fig. 103 Australia
Fig. 104 Australia market estimates and forecasts, 2018 - 2030
Fig. 105 Latin America
Fig. 106 Latin America market estimates and forecasts, 2018 - 2030
Fig. 107 Brazil
Fig. 108 Brazil market estimates and forecasts, 2018 - 2030
Fig. 109 Mexico
Fig. 110 Mexico market estimates and forecasts, 2018 - 2030
Fig. 111 Argentina
Fig. 112 Argentina market estimates and forecasts, 2018 - 2030
Fig. 113 Middle East and Africa
Fig. 114 Middle East and Africa market estimates and forecasts, 2018 - 2030
Fig. 115 South Africa
Fig. 116 South Africa market estimates and forecasts, 2018 - 2030
Fig. 117 Saudi Arabia
Fig. 118 Saudi Arabia market estimates and forecasts, 2018 - 2030
Fig. 119 UAE
Fig. 120 UAE market estimates and forecasts, 2018 - 2030
Fig. 121 Kuwait
Fig. 122 Kuwait market estimates and forecasts, 2018 - 2030
Fig. 123 Market share of key market players- Women’s health market
Market Segmentation
Governments and private organizations across the globe are increasing their focus on women’s health, which is likely to drive market growth. In developed economies, coverage provided to women is one of the key factors expected to drive the market. For instance, various coverage plans in the U.S. provide preventive services for women without copayment charges, which include folic acid supplements for women trying to get pregnant, contraceptives, and screening for breast cancer, anemia, & hepatitis B. Canada has made investments to promote the health and equality of women all around the world. The government has increased its funding to USD 1.4 billion annually, to promote women’s health from 2023. The initiative includes around USD 700 million from the annual funds for Sexual and Reproductive Health and Rights (SRHR).
Various initiatives undertaken by countries in Asia Pacific, such as Japan, India, China, Singapore, and Australia, are likely to boost the market over the forecast period. For instance, in January 2023, Australia’s Ministry of Health announced funding USD 24 million for medical and health research activities focusing on women’s health to develop novel treatments & improve patient outcomes. In addition, in May 2021, the Australian government announced an investment of USD 353.9 million in activities to improve women’s health as part of its 2021-2022 budget. The government planned to allocate and disburse this amount over the next 4 years to various organizations focusing on women’s health.
Manufacturers and providers of OTC medicines & supplements face significant loss of revenue on claim settlement due to lawsuits on their products. Consumers, including women, have filed lawsuits against several OTC medication and supplement manufacturers & sellers, such as Rite Aid and Bayer AG, due to false advertising and misleading information regarding the ingredients used. This includes products that are marketed to have natural ingredients when they have synthetic ones. For instance, Bayer AG was accused of falsely advertising that its multivitamin natural fruit bites brand One a Day was natural. Consumers claimed that the company used synthetic ingredients while making and marketing these products. Such activities of major players can damage consumer trust in their products and are expected to negatively impact the women’s health market over the forecast period.
The U.S. FDA claims that contraceptives containing drospirenone may increase the risk of blood clot formation. Many patients proposed the recall of pills containing drospirenone and replacing them with safer & more effective alternatives. Furthermore, in October 2022, the U.S. FDA postponed the approval of Opill for a prescription-to-OTC switch, stating that the agency needed more time to gain additional information associated with the safety & efficacy of the drug. Thus, delays in approval of new products are anticipated to restrain market growth.
With rising global awareness regarding women's health issues, there is an increasing demand for comprehensive and personalized healthcare solutions. Advancements in medical technology, such as telehealth & genetic testing, offer avenues for enhanced accessibility and tailored treatments. The expanding focus on mental health within women's healthcare further opens doors for novel interventions. In addition, rising developments by market players toward innovation and research are also projected to offer a favorable opportunity for market growth during the forecast period. For instance, in July 2022, Lisa Health and Mayo Clinic entered into a collaboration to develop a personalized app for menopause. The app would incorporate AI technology for better menopause management. In March 2023, the partnership of Blue Care Network and Blue Cross Blue Shield of Michigan announced a new health solution to guide women through healthy menopause.
This section will provide insights into the contents included in this women’s health market report and help gain clarity on the structure of the report to assist readers in navigating smoothly.
Industry overview
Industry trends
Market drivers and restraints
Market size
Growth prospects
Porter’s analysis
PESTEL analysis
Key market opportunities prioritized
Competitive landscape
Company overview
Financial performance
Product benchmarking
Latest strategic developments
Market size, estimates, and forecast from 2018 to 2030
Market estimates and forecast for product segments up to 2030
Regional market size and forecast for product segments up to 2030
Market estimates and forecast for application segments up to 2030
Regional market size and forecast for application segments up to 2030
Company financial performance
A three-pronged approach was followed for deducing the women’s health market estimates and forecasts. The process has three steps: information procurement, analysis, and validation. The whole process is cyclical, and steps repeat until the estimates are validated. The three steps are explained in detail below:
Information procurement: Information procurement is one of the most extensive and important stages in our research process, and quality data is critical for accurate analysis. We followed a multi-channel data collection process for women’s health market to gather the most reliable and current information possible.
Analysis: We mine the data collected to establish baselines for forecasting, identify trends and opportunities, gain insight into consumer demographics and drivers, and so much more. We utilized different methods of women’s health market data depending on the type of information we’re trying to uncover in our research.
Market Research Efforts: Bottom-up Approach for estimating and forecasting demand size and opportunity, top-down Approach for new product forecasting and penetration, and combined approach of both Bottom-up and Top-down for full coverage analysis.
Value-Chain-Based Sizing & Forecasting: Supply-side estimates for understanding potential revenue through competitive benchmarking, forecasting, and penetration modeling.
Demand-side estimates for identifying parent and ancillary markets, segment modeling, and heuristic forecasting.
Qualitative Functional Deployment (QFD) Modelling for market share assessment.
Market formulation and validation: We mine the data collected to establish baselines for forecasting, identify trends and opportunities, gain insight into consumer demographics and drivers, and so much more. We utilize different methods of data analysis depending on the type of information we’re trying to uncover in our research.
Market Formulation: This step involves the finalization of market numbers. This step on an internal level is designed to manage outputs from the Data Analysis step.
Data Normalization: The final market estimates and forecasts are then aligned and sent to industry experts, in-panel quality control managers for validation.
This step also entails the finalization of the report scope and data representation pattern.
Validation: The process entails multiple levels of validation. All these steps run in parallel, and the study is forwarded for publishing only if all three levels render validated results.
The women’s health market was categorized into four segments, namely application (Hormonal Infertility, Contraceptives, Postmenopausal Osteoporosis, Endometriosis & Uterine Fibroids, Menopause, Polycystic Ovary Syndrome), age (50 years and above), drug (ACTONEL, YAZ, Yasmin, Yasminelle, FORTEO, Minastrin 24 Fe, Mirena, NuvaRing, ORTHO TRI-CY LO, Premarin, Prolia, Reclast/Aclasta, XGEVA, Zometa), and region (North America, Europe, Asia Pacific, Latin America, and Middle East & Africa).
The women’s health market was segmented into application, age, drug, and regions. The demand at a segment level was deduced using a funnel method. Concepts like the TAM, SAM, SOM, etc., were put into practice to understand the demand. We at GVR deploy three methods to deduce market estimates and determine forecasts. These methods are explained below:
Demand estimation of each product across countries/regions summed up to from the total market.
Variable analysis for demand forecast.
Demand estimation via analyzing paid database, and company financials either via annual reports or paid database.
Primary interviews for data revalidation and insight collection.
Used extensively for new product forecasting or analyzing penetration levels.
Tool used invoice product flow and penetration models Use of regression multi-variant analysis for forecasting Involves extensive use of paid and public databases.
Primary interviews and vendor-based primary research for variable impact analysis.
The women’s health market was analyzed at a regional level. The globe was divided into North America, Europe, Asia Pacific, Latin America, and Middle East & Africa, keeping in focus variables like consumption patterns, export-import regulations, consumer expectations, etc. These regions were further divided into twenty-three countries, namely, the U.S.; Canada; the UK; Germany; France; Spain; Italy; Denmark; Sweden; Norway; Japan; China; India; Australia; South Korea; Thailand; Brazil; Mexico; Argentina; South Africa; Saudi Arabia; UAE; Kuwait.
All three above-mentioned market research methodologies were applied to arrive at regional-level conclusions. The regions were then summed up to form the global market.
The women’s health market was analyzed via companies operating in the sector. Analyzing these companies and cross-referencing them to the demand equation helped us validate our assumptions and conclusions. Key market players analyzed include:
Abbvie, Inc. is engaged in developing, manufacturing, and supplying branded pharmaceutical products, medical esthetics, biosimilars, & over-the-counter drugs. In May 2020, it acquired Allergan plc, through which it gained access to Allergan’s range of women’s healthcare, dermatology, ophthalmic, neuroscience, urology, and esthetic products. The company is also taking its step forward to extend its pipeline programs for the treatment of viral diseases, Crohn's disease, wet AMD, neurological conditions, and cancers, among others. It has manufacturing and R&D facilities in about 20 countries and a global presence in more than 75 countries.
Bayer AG is a life sciences company that operates through the following segments - crop science, animal health, pharmaceuticals, and consumer health. In the consumer health segment, it offers nonprescription products in dermatology, allergy, digestive health, foot care, cough & cold, cardiovascular risk prevention, and nutrition categories. These products are offered under well-known brands, such as One a Day, Rennie, Redoxon, Aspirin, Elevit, Aleve, and Seltzer. The company has operations in North America, Latin America, Europe, and Asia Pacific.
Organon & Co. is a global healthcare company involved in the development & marketing of women’s health products, including prescription medicines and medical devices globally. To consolidate its channels, the company is mainly focusing on partnerships and collaborations with government agencies, drug wholesalers & retailers, and hospitals. The company has six manufacturing facilities in Brazil, Belgium, Mexico, Indonesia, Mexico, the Netherlands, and the UK.
Theramex is a global pharmaceutical company engaged in the development & supply of women’s healthcare. The company currently operates in 80 countries. Theramex develops products in contraception, fertility, menopause, and osteoporosis business segments. In March 2022, PAI Partners and Carlyle announced their plan to acquire Theramex.
Amgen, Inc. is an independent biotechnology company that manufactures & develops innovative therapeutics. The company serves clients through various facilities and subsidiaries in the U.S., Finland, Australia, France, Germany, Hong Kong, Greece, Iceland, Mexico, Russia, Thailand, and Turkey. It offers products in therapeutic areas such as nephrology, neuroscience, cardiology, hematology, bone health, and inflammation. Amgen has a presence in over 100 countries globally.
Agile Therapeutics is a women’s health specialty pharmaceutical company that develops contraceptive products. The company uses skin fusion patch technology to create hormone-based contraceptives to deliver ethinyl estradiol and levonorgestrel over 7 days. The company’s patented Skinfusion technology is intended to optimize patient wearability & patch adhesion. The technology includes Twirla (AG200-15), AG200- ER, AG200-SP, and AG200-890.
Pfizer, Inc. manufactures products to treat a wide range of diseases, including diabetes, immunologic conditions, cardiac disorders, cancer, and dermatological diseases. It operates through two segments: Innovative Health and Essential Health. The company operates in five sectors, comprising primary care, oncology, animal & consumer healthcare, emerging economies, and nutrition
Apothecus Pharmaceutical Corporation is a privately held company that specializes in pharmaceuticals. The company manufactures & processes pharmaceutical drugs for human & veterinary use along with products such as lubricants, vaginal contraceptive films, and vaginal contraceptive foams.
Blairex Laboratories, Inc. is a U.S.-based company that manufactures healthcare products for doctors, healthcare facilities, and other end-users. The product portfolio of the company includes sleeping aids, vaginal inserts, and bio-adhesive gels. The company also manufactures wound wash saline, a sterile saline solution for cleaning abrasions, and broncho saline, a sterile solution to dilute bronchodilator inhalation medications.
Ferring B.V. is a biopharmaceutical company specializing in product R&D, manufacturing, and marketing. The company’s portfolio consists of urology, women’s health, endocrinology, gastroenterology, and orthopedic products. It has a direct marketing presence in 56 countries and distribution in around 110 countries. The company is recognized as a pioneer in developing and selling pharmaceutical products based on natural, pituitary-produced peptide hormones. Ferring has several reproductive health products in the pipeline.
Supply Side Estimates
Company revenue estimation via referring to annual reports, investor presentations, and Hoover’s.
Segment revenue determination via variable analysis and penetration modeling.
Competitive benchmarking to identify market leaders and their collective revenue shares.
Forecasting via analyzing commercialization rates, pipelines, market initiatives, distribution networks, etc.
Demand side estimates
Identifying parent markets and ancillary markets
Segment penetration analysis to obtain pertinent
revenue/volume
Heuristic forecasting with the help of subject matter experts
Forecasting via variable analysis
Understanding market dynamics (in terms of drivers, restraints, & opportunities) in the countries.
Understanding trends & variables in the individual countries & their impact on growth and using analytical tools to provide high-level insights into the market dynamics and the associated growth pattern.
Understanding market estimates and forecasts (with the base year as 2023, historic information from 2018 to 2022, and forecast from 2024 to 2030). Regional estimates & forecasts for each category are available and are summed up to form the global market estimates.
The report provides market value for the base year 2023 and a yearly forecast till 2030 in terms of revenue/volume or both. The market for each of the segment outlooks has been provided on region & country basis for the above-mentioned forecast period.
The key industry dynamics, major technological trends, and application markets are evaluated to understand their impact on the demand for the forecast period. The growth rates were estimated using correlation, regression, and time-series analysis.
We have used the bottom-up approach for market sizing, analyzing key regional markets, dynamics, & trends for various products and end-users. The total market has been estimated by integrating the country markets.
All market estimates and forecasts have been validated through primary interviews with the key industry participants.
Inflation has not been accounted for to estimate and forecast the market.
Numbers may not add up due to rounding off.
Europe consists of EU-8, Central & Eastern Europe, along with the Commonwealth of Independent States (CIS).
Asia Pacific includes South Asia, East Asia, Southeast Asia, and Oceania (Australia & New Zealand).
Latin America includes Central American countries and the South American continent
Middle East includes Western Asia (as assigned by the UN Statistics Division) and the African continent.
GVR strives to procure the latest and unique information for reports directly from industry experts, which gives it a competitive edge. Quality is of utmost importance to us, therefore every year we focus on increasing our experts’ panel. Primary interviews are one of the critical steps in identifying recent market trends and scenarios. This process enables us to justify and validate our market estimates and forecasts to our clients. With more than 8,000 reports in our database, we have connected with some key opinion leaders across various domains, including healthcare, technology, consumer goods, and the chemical sector. Our process starts with identifying the right platform for a particular type of report, i.e., emails, LinkedIn, seminars, or telephonic conversation, as every report is unique and requires a differentiated approach.
We send out questionnaires to different experts from various regions/ countries, which is dependent on the following factors:
Report/Market scope: If the market study is global, we send questionnaires to industry experts across various regions, including North America, Europe, Asia Pacific, Latin America, and MEA.
Market Penetration: If the market is driven by technological advancements, population density, disease prevalence, or other factors, we identify experts and send out questionnaires based on region or country dominance.
The time to start receiving responses from industry experts varies based on how niche or well-penetrated the market is. Our reports include a detailed chapter on the KoL opinion section, which helps our clients understand the perspective of experts already in the market space.
NEED A CUSTOM REPORT?
We can customize every report - free of charge - including purchasing stand-alone sections or country-level reports, as well as offer affordable discounts for start-ups & universities. Contact us now
We are GDPR and CCPA compliant! Your transaction & personal information is safe and secure. For more details, please read our privacy policy.
"The quality of research they have done for us has been excellent."