The global traffic road marking coatings market size was estimated at USD 5.48 billion in 2023 and is expected to grow at a compound annual growth rate (CAGR) of 6.2% from 2024 to 2030. Increasing spending on infrastructure development for constructing new highways and focusing on repair & maintenance operations are expected to be the key driving factors for the global market. The industry is not only associated with new road construction activities but also with existing maintenance businesses, which drives the demand for repainting.
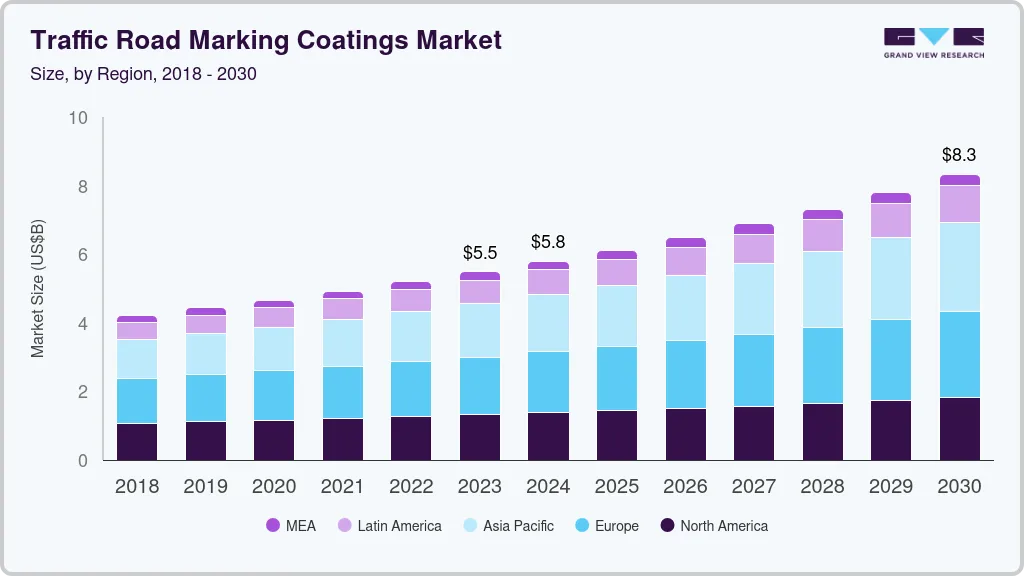
The market has witnessed increasing investments in intelligent street marking systems and machines that help in recording the driver speed, driving conditions, and temperature while communicating it to the vehicle’s sensor system. Paint is widely used for travel lanes, loading zone, and parking space markings. Thermoplastic coat, which is also known as hot melt marking, is gaining advantage owing to its properties, such as longevity and retro-reflectivity.
Preformed polymer tape is a plastic sheet applied to mark traffic lanes, stop bars, and crosswalks. Epoxy is another option that is both reliable and economical, consisting of a pigmented resin base and a catalyst. This type of coating is preferred over plastic due to its low cost and high reliability. Manufacturers are developing temperature-sensitive paints in response to adverse weather conditions like snowfall and heavy rain.
Rising demand in the markings for public and private parking spaces is expected to boost the market growth. Regulatory bodies across the globe are continuously formulating guidelines to improve road safety. While a well-established regulatory structure is already present in developed regions, such as North America and Europe, emerging economies are still working toward enhancing the framework to ensure road safety and maintenance.
Despite considerable supply chain instability during the initial months of the COVID-19 pandemic, several road maintenances and building projects increased due to reduced traffic. Aside from road building, the crisis and flight reductions provided a chance to evaluate runway construction windows. For example, in May 2020, Auckland Airport declared intentions to capitalize on the opportunity created by traffic restrictions during the pandemic to forward its runway pavement replacement project.
Manufacturers within the traffic road marking coatings market prioritize the development of innovative products, such as temperature-sensitive, durable, and reflective paints. These manufacturers anticipate a significant level of forward integration within the market to enhance their global market positioning.
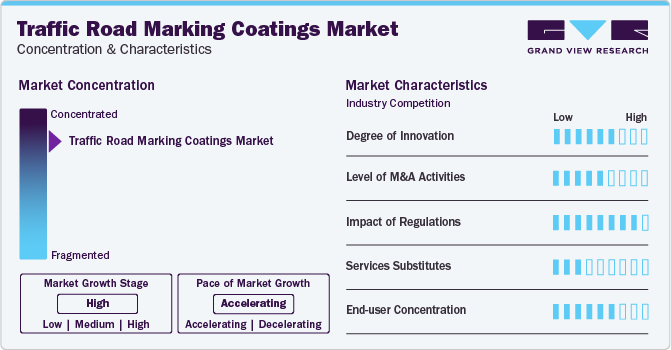
Major companies operating in the market include Dow Inc., 3M Company, and Asian Paints PPG Pvt. Ltd. The products manufactured by these companies are used in applications such as metropolitan road markings, highway markings, and airfield markings. They are also used in footpath markings and indoor & parking spaces markings. Sporting surfaces markings and kern markings are also among a few other road safety applications for the company’s products. Companies are majorly using strategies such as joint ventures, mergers & acquisitions, production capacity expansions, and new product developments to drive their revenues and increase their market shares.
For instance, Ingevity Corporation has announced its deal to purchase the privately held entities Ozark Materials, LLC and Ozark Logistics, LLC in a cash transaction valued at $325 million. The completion of the acquisition is contingent upon regulatory endorsement and standard closing prerequisites, with Ingevity anticipating the transaction to conclude in the early stages of the fourth quarter of 2022.
The emerging & key companies estimate a huge potential demand from developed markets in the countries of North America and Europe. Traffic road marking coatings manufacturers also collaborate with other players in the market to sustain and grow in the marketplace. For instance, in January 2022, Geveko Markings was acquired and commenced operations under the ownership of Oré Peinture, a French manufacturer of road marking paint and safety materials. This acquisition resulted in the expansion of Geveko Markings' presence in France, as well as an increase in its overall assets and production capacity.
Thermoplastic coating is projected to emerge as the fastest-growing product segment and accounted for a revenue share of over 23.0% in 2023. Conventional paint is ideal for markings on private spaces and public streets. These paints are available in different colors, each symbolizing a different function, viz. best reflectors, areas frequented by a heavy fork-lift truck, essential for temporary marks. In December 2020, SWARCO Road Marking Systems collaborated with students to research the practicality of integrating natural polymers in thermoplastic street markings, and their efforts earned them the Borealis Student Innovation Prize.
Thermoplastic markings are applied in a thick/built-up layer to create rumble strips. This coating sets quickly and adheres firmly to the surface. Extra additives can be added to retain its color over time, thus improving its reflective capabilities. High strength and resistance make them wear resistance.
Preformed polymer tapes, also referred to as tape or cold plastic, are placed either over the surface of the pavement or the asphalt concrete during the hardening process. Along with its use for crosswalks and stop bars, it is also supplied in sheets from which unique shapes, forms, or letters can be designed. In February 2021, Dow released its DURATRACKTM 2K Technology for big area markings like green cycling lanes. Dow's green bicycle lane coatings combine the simplicity and sprayability of waterborne solutions with the reliability and performance of a two-component solution. The solution was designed to provide residents of the economy with safer multi-modal traveling alternatives.
Based on the type, the market is segmented into permanent and removable traffic road marking coatings. Permanent traffic road marking includes pavement tapes and paints. Aerosol permanent paints are widely used for traffic line marking. They exhibit an extremely high percentage of solid and resin content, contributing to exterior durability and water, weather, and abrasion resistance. Aerosol paints are available in a variety of colors but white and yellow are mostly preferred in several applications including crosswalks, streets, highways, airport runways, and parking lots. These paints have a longer life compared to conventional paints. In January 2019, Ennis-Flint, Inc., a manufacturer, and supplier of pavement marking materials, made progress toward a new production facility in the Triad. The new facility focused on increasing the processing capacity of premade thermoplastic pavement markings for the company's specialty market goods.
Removable traffic road markings are primarily used for painting signs, identification numbers, and direction arrows on warehouse floors, road construction zones, synthetic turf fields, and others. These paints are tough and durable, however, can be easily removed or can wear off when exposed to the environment in a year.
Road marking lines emerged as the largest application segment with a market share of 55.1% in terms of revenue in 2023. The rising usage of road marking lines to guide the vehicles on the road is expected to propel the demand for road marking lines in the coming years. The marking indicates the delineation of traffic path and lateral clearance from traffic hazards for safe and smooth movement on the road. It also serves as a tool for providing information, controlling traffic, and warning road users.
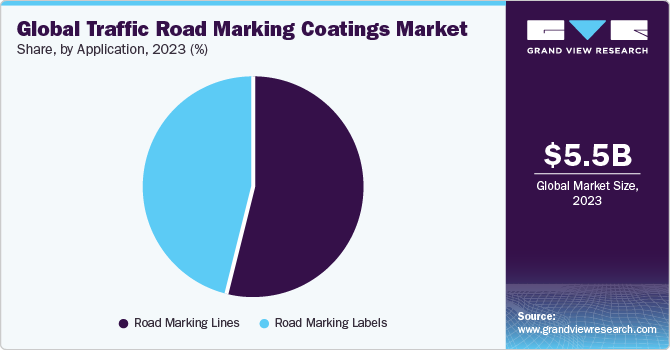
Road marking labels is projected to emerge as the fastest-growing application segment owing to their high suitability for roads, public highways, and on-site applications. Traffic road marking labels promote traffic safety, notify drivers of the speed limit, and provide directions and other useful information to all road users including pedestrians and cyclists. Basic road labeling includes regulatory warnings, roadwork signs, and informational signs. All road marking labels must comply with the road traffic regulations.
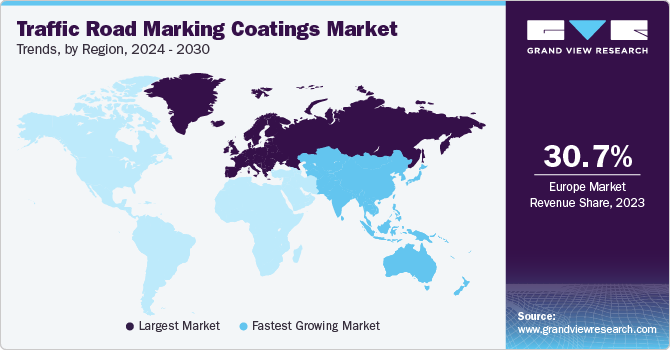
Europe has emerged as the largest market while the Asia Pacific is projected to witness the highest growth during the forecast period. The European Union Road Federation, as a part of its ongoing efforts, is actively researching to develop standard recommendations to reach its goal of reducing highway fatalities. Usage of high-quality building materials, safety measures, training, and better surveillance of contractors are expected to augment the demand in the coming years.
The U.S. government has rolled out initiatives to enhance road infrastructure and encourage the development of durable, high-performance coating products with enhanced visibility and skid resistance. Facilitating vertical market integration by launching manufacturing units for motorway marking and traffic paints will give contractors and applicators a chance to acquire better control over the cost and quality of products. This is expected to support the regional market growth during the forecast period.
Key companies are adopting several organic and inorganic growth strategies, such as capacity expansion, mergers & acquisitions, and joint ventures, to maintain and expand their market share.
Sherwin-Williams Company is engaged in increasing its product offering for traffic road marking coatings market. The company has a wide product portfolio of about nine coating materials catering to road marking coating applications.
The following are the leading companies in the traffic road marking coatings market. These companies collectively hold the largest market share and dictate industry trends. Financials, strategy maps & products of these traffic road marking coatings companies are analyzed to map the supply network.
Report Attribute |
Details |
Market size value in 2024 |
USD 5.80 billion |
Revenue forecast in 2030 |
USD 8.33 billion |
Growth rate |
CAGR of 6.2% from 2024 to 2030 |
Historical data |
2018 - 2023 |
Forecast period |
2024 - 2030 |
Quantitative Units |
Volume in kilotons, revenue in USD million, and CAGR from 2024 to 2030 |
Report coverage |
Volume forecast, revenue forecast, competitive landscape, growth factors, and trends |
Segments covered |
Product, type, application, region |
Regional scope |
North America; Europe; Asia Pacific; Central & South America; Middle East & Africa |
Country scope |
U.S.; Canada; Mexico; Germany; U.K.; France; Russia; Italy; China; India; Japan; Australia; Brazil; Argentina; Saudi Arabia, South Africa |
Key companies profiled |
AutoMark Technologies (India) Pvt. Ltd.; The Sherwin-Williams Company; Geveko Markings; Ennis Flint, Inc.; Crown Techno; Dow Inc; The 3M Company; Swarco |
Customization scope |
Free report customization (equivalent up to 8 analysts working days) with purchase. Addition or alteration to country, regional & segment scope. |
Pricing and purchase options |
Avail customized purchase options to meet your exact research needs. Explore purchase options |
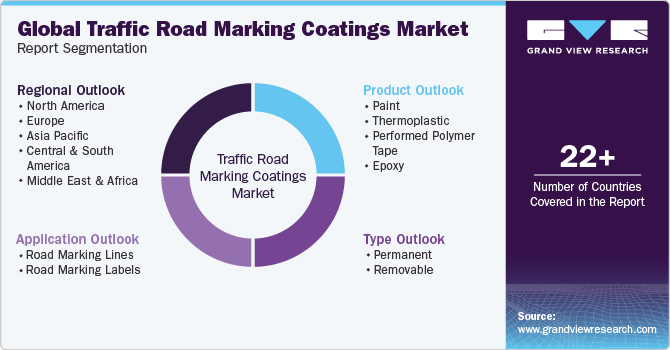
This report forecasts revenue and volume growth at the global, regional, and country levels and provides an analysis of the latest industry trends and opportunities in each of the sub-segments from 2018 to 2030. For this study, Grand View Research has segmented the global traffic road marking coatings market report based on product, type, application, and region:
Product Outlook (Volume, Kilotons; Revenue, USD Million, 2018 - 2030)
Paint
Thermoplastic
Performed Polymer Tape
Epoxy
Type Outlook (Volume, Kilotons; Revenue, USD Million, 2018 - 2030)
Permanent
Removable
Application Outlook (Volume, Kilotons; Revenue, USD Million, 2018 - 2030)
Road Marking Lines
Road Marking Labels
Regional Outlook (Volume, Kilotons; Revenue, USD Billion, 2018 - 2030)
North America
U.S.
Canada
Mexico
Europe
Germany
France
U.K.
Russia
Italy
Asia Pacific
China
Japan
Australia
India
Central & South America
Brazil
Argentina
Middle East & Africa
Saudi Arabia
South Africa
b. The global traffic road marking market size was estimated at USD 4.92 billion in 2021 and is expected to reach USD 5.21 billion in 2022.
b. The global traffic road marking market is expected to grow at a compound annual growth rate of 6.0% from 2022 to 2030 to reach USD 8.27 billion by 2030.
b. Europe dominated the traffic road marking market with a share over of 31% in 2021. This is attributable to the rising usage of high-quality building materials, safety measures, training, and better surveillance on contractors to reduce highway fatalities and increase road safety.
b. Some key players operating in the traffic road marking market include AutoMark Technologies (India) Pvt. Ltd.; Sherwin-Williams Company; Geveko Markings; Ennis Flint, Inc.; Crown Techno; Dow Inc.; 3M Company; and Swarco.
b. Key factors that are driving the traffic road marking market growth include traffic road marking application for signals, signs, and traffic road markings, and an increase in highway and street construction initiatives by the various government across the world.
Table of Contents
Chapter 1. Methodology and Scope
1.1. Market Segmentation & Scope
1.2. Market Definition
1.3. Information Procurement
1.3.1. Purchased Database
1.3.2. GVR’s Internal Database
1.3.3. Secondary Sources & Third-Party Perspectives
1.3.4. Primary Research
1.4. Information Analysis
1.4.1. Data Analysis Models
1.5. Market Formulation & Data Visualization
1.6. Data Validation & Publishing
Chapter 2. Executive Summary
2.1. Market Insights
2.2. Segmental Outlook
2.3. Competitive Outlook
Chapter 3. Traffic Road Marking Coatings Market Variables, Trends & Scope
3.1. Global Traffic Road Marking Coatings Market Outlook
3.2. Industry Value Chain Analysis
3.2.1. Raw Material Outlook
3.3. Technology Overview
3.4. Regulatory Framework
3.5. Market Dynamics
3.5.1. Market Driver Analysis
3.5.2. Market Restraint Analysis
3.5.3. Industry Challenges
3.5.4. Industry Opportunity
3.6. Porter’s Five Forces Analysis
3.6.1. Supplier Power
3.6.2. Buyer Power
3.6.3. Substitution Threat
3.6.4. Threat from New Entrant
3.6.5. Competitive Rivalry
3.7. PESTEL Analysis
3.7.1. Political Landscape
3.7.2. Economic Landscape
3.7.3. Social Landscape
3.7.4. Technological Landscape
3.7.5. Environmental Landscape
3.7.6. Legal Landscape
Chapter 4. Traffic Road Marking Coatings Market: Product Outlook Estimates & Forecasts
4.1. Traffic Road Marking Coatings Market: Product Movement Analysis, 2023 & 2030
4.2. Paint
4.2.1. Market estimates and forecast, 2018 - 2030 (USD Million) (Kilotons)
4.3. Thermoplastic
4.3.1. Market estimates and forecast, 2018 - 2030 (USD Million) (Kilotons)
4.4. Performed Polymer Tape
4.4.1. Market estimates and forecast, 2018 - 2030 (USD Million) (Kilotons)
4.5. Epoxy
4.5.1. Market estimates and forecast, 2018 - 2030 (USD Million) (Kilotons)
Chapter 5. Traffic Road Marking Coatings Market: Type Outlook Estimates & Forecasts
5.1. Traffic Road Marking Coatings Market: Type Movement Analysis, 2023 & 2030
5.2. Permanent
5.2.1. Market estimates and forecast, 2018 - 2030 (USD Million) (Kilotons)
5.3. Removable
5.3.1. Market estimates and forecast, 2018 - 2030 (USD Million) (Kilotons)
Chapter 6. Traffic Road Marking Coatings Market: Application Outlook Estimates & Forecasts
6.1. Traffic Road Marking Coatings Market: Application Movement Analysis, 2023 & 2030
6.2. Road Marking Lines
6.2.1. Market estimates and forecast, 2018 - 2030 (USD Million) (Kilotons)
6.3. Road Marking Labels
6.3.1. Market estimates and forecast, 2018 - 2030 (USD Million) (Kilotons)
6.3.2.
Chapter 7. Traffic Road Marking Coatings Market Regional Outlook Estimates & Forecasts
7.1. Regional Snapshot
7.2. Traffic Road Marking Coatings Market: Regional Movement Analysis, 2023 & 2030
7.3. North America
7.3.1. Market estimates and forecast, 2018 - 2030 (USD Million) (Kilotons)
7.3.2. Market estimates and forecast, by product, 2018 - 2030 (USD Million) (Kilotons)
7.3.3. Market estimates and forecast, by type, 2018 - 2030 (USD Million) (Kilotons)
7.3.4. Market estimates and forecast, by application, 2018 - 2030 (USD Million) (Kilotons)
7.3.5. U.S.
7.3.5.1. Market estimates and forecast, 2018 - 2030 (USD Million) (Kilotons)
7.3.5.2. Market estimates and forecast, by product, 2018 - 2030 (USD Million) (Kilotons)
7.3.5.3. Market estimates and forecast, by type, 2018 - 2030 (USD Million) (Kilotons)
7.3.5.4. Market estimates and forecast, by application, 2018 - 2030 (USD Million) (Kilotons)
7.3.6. Canada
7.3.6.1. Market estimates and forecast, 2018 - 2030 (USD Million) (Kilotons)
7.3.6.2. Market estimates and forecast, by product, 2018 - 2030 (USD Million) (Kilotons)
7.3.6.3. Market estimates and forecast, by type, 2018 - 2030 (USD Million) (Kilotons)
7.3.6.4. Market estimates and forecast, by application, 2018 - 2030 (USD Million) (Kilotons)
7.3.7. Mexico
7.3.7.1. Market estimates and forecast, 2018 - 2030 (USD Million) (Kilotons)
7.3.7.2. Market estimates and forecast, by product, 2018 - 2030 (USD Million) (Kilotons)
7.3.7.3. Market estimates and forecast, by type, 2018 - 2030 (USD Million) (Kilotons)
7.3.7.4. Market estimates and forecast, by application, 2018 - 2030 (USD Million) (Kilotons)
7.4. Europe
7.4.1. Market estimates and forecast, 2018 - 2030 (USD Million) (Kilotons)
7.4.2. Market estimates and forecast, by product, 2018 - 2030 (USD Million) (Kilotons)
7.4.2.1. Market estimates and forecast, by product, 2018 - 2030 (USD Million) (Kilotons)
7.4.2.2. Market estimates and forecast, by type, 2018 - 2030 (USD Million) (Kilotons)
7.4.2.3. Market estimates and forecast, by application, 2018 - 2030 (USD Million) (Kilotons)
7.4.3. Germany
7.4.3.1. Market estimates and forecast, 2018 - 2030 (USD Million) (Kilotons)
7.4.3.2. Market estimates and forecast, by product, 2018 - 2030 (USD Million) (Kilotons)
7.4.3.3. Market estimates and forecast, by type, 2018 - 2030 (USD Million) (Kilotons)
7.4.3.4. Market estimates and forecast, by application, 2018 - 2030 (USD Million) (Kilotons)
7.4.4. France
7.4.4.1. Market estimates and forecast, 2018 - 2030 (USD Million) (Kilotons)
7.4.4.2. Market estimates and forecast, by product, 2018 - 2030 (USD Million) (Kilotons)
7.4.4.3. Market estimates and forecast, by type, 2018 - 2030 (USD Million) (Kilotons)
7.4.4.4. Market estimates and forecast, by application, 2018 - 2030 (USD Million) (Kilotons)
7.4.5. UK
7.4.5.1. Market estimates and forecast, 2018 - 2030 (USD Million) (Kilotons)
7.4.5.2. Market estimates and forecast, by product, 2018 - 2030 (USD Million) (Kilotons)
7.4.5.3. Market estimates and forecast, by type, 2018 - 2030 (USD Million) (Kilotons)
7.4.5.4. Market estimates and forecast, by application, 2018 - 2030 (USD Million) (Kilotons)
7.4.6. Russia
7.4.6.1. Market estimates and forecast, 2018 - 2030 (USD Million) (Kilotons)
7.4.6.2. Market estimates and forecast, by product, 2018 - 2030 (USD Million) (Kilotons)
7.4.6.3. Market estimates and forecast, by type, 2018 - 2030 (USD Million) (Kilotons)
7.4.6.4. Market estimates and forecast, by application, 2018 - 2030 (USD Million) (Kilotons)
7.4.7. Italy
7.4.7.1. Market estimates and forecast, 2018 - 2030 (USD Million) (Kilotons)
7.4.7.2. Market estimates and forecast, by product, 2018 - 2030 (USD Million) (Kilotons)
7.4.7.3. Market estimates and forecast, by type, 2018 - 2030 (USD Million) (Kilotons)
7.4.7.4. Market estimates and forecast, by application, 2018 - 2030 (USD Million) (Kilotons)
7.5. Asia Pacific
7.5.1. Market estimates and forecast, 2018 - 2030 (USD Million) (Kilotons)
7.5.2. Market estimates and forecast, by product, 2018 - 2030 (USD Million) (Kilotons)
7.5.3. Market estimates and forecast, by type, 2018 - 2030 (USD Million) (Kilotons)
7.5.4. Market estimates and forecast, by application, 2018 - 2030 (USD Million) (Kilotons)
7.5.5. China
7.5.5.1. Market estimates and forecast, 2018 - 2030 (USD Million) (Kilotons)
7.5.5.2. Market estimates and forecast, by form, 2018 - 2030 (USD Million) (Kilotons)
7.5.5.3. Market estimates and forecast, by product, 2018 - 2030 (USD Million) (Kilotons)
7.5.5.4. Market estimates and forecast, by type, 2018 - 2030 (USD Million) (Kilotons)
7.5.5.5. Market estimates and forecast, by application, 2018 - 2030 (USD Million) (Kilotons)
7.5.6. Australia
7.5.6.1. Market estimates and forecast, 2018 - 2030 (USD Million) (Kilotons)
7.5.6.2. Market estimates and forecast, by product, 2018 - 2030 (USD Million) (Kilotons)
7.5.6.3. Market estimates and forecast, by type, 2018 - 2030 (USD Million) (Kilotons)
7.5.6.4. Market estimates and forecast, by application, 2018 - 2030 (USD Million) (Kilotons)
7.5.7. Japan
7.5.7.1. Market estimates and forecast, 2018 - 2030 (USD Million) (Kilotons)
7.5.7.2. Market estimates and forecast, by product, 2018 - 2030 (USD Million) (Kilotons)
7.5.7.3. Market estimates and forecast, by type, 2018 - 2030 (USD Million) (Kilotons)
7.5.7.4. Market estimates and forecast, by application, 2018 - 2030 (USD Million) (Kilotons)
7.5.8. India
7.5.8.1. Market estimates and forecast, 2018 - 2030 (USD Million) (Kilotons)
7.5.8.2. Market estimates and forecast, by product, 2018 - 2030 (USD Million) (Kilotons)
7.5.8.3. Market estimates and forecast, by type, 2018 - 2030 (USD Million) (Kilotons)
7.5.8.4. Market estimates and forecast, by application, 2018 - 2030 (USD Million) (Kilotons)
7.6. Central & South America
7.6.1. Market estimates and forecast, 2018 - 2030 (USD Million) (Kilotons)
7.6.2. Market estimates and forecast, by product, 2018 - 2030 (USD Million) (Kilotons)
7.6.3. Market estimates and forecast, by type, 2018 - 2030 (USD Million) (Kilotons)
7.6.4. Market estimates and forecast, by application, 2018 - 2030 (USD Million) (Kilotons)
7.6.5. Brazil
7.6.5.1. Market estimates and forecast, 2018 - 2030 (USD Million) (Kilotons)
7.6.5.2. Market estimates and forecast, by product, 2018 - 2030 (USD Million) (Kilotons)
7.6.5.3. Market estimates and forecast, by type, 2018 - 2030 (USD Million) (Kilotons)
7.6.5.4. Market estimates and forecast, by application, 2018 - 2030 (USD Million) (Kilotons)
7.6.6. Argentina
7.6.6.1. Market estimates and forecast, 2018 - 2030 (USD Million) (Kilotons)
7.6.6.2. Market estimates and forecast, by product, 2018 - 2030 (USD Million) (Kilotons)
7.6.6.3. Market estimates and forecast, by type, 2018 - 2030 (USD Million) (Kilotons)
7.6.6.4. Market estimates and forecast, by application, 2018 - 2030 (USD Million) (Kilotons)
7.7. Middle East & Africa
7.7.1. Market estimates and forecast, 2018 - 2030 (USD Million) (Kilotons)
7.7.2. Market estimates and forecast, by product, 2018 - 2030 (USD Million) (Kilotons)
7.7.3. Market estimates and forecast, by type, 2018 - 2030 (USD Million) (Kilotons)
7.7.4. Market estimates and forecast, by application, 2018 - 2030 (USD Million) (Kilotons)
7.7.5. Saudi Arabia
7.7.5.1. Market estimates and forecast, 2018 - 2030 (USD Million) (Kilotons)
7.7.5.2. Market estimates and forecast, by product, 2018 - 2030 (USD Million) (Kilotons)
7.7.5.3. Market estimates and forecast, by type, 2018 - 2030 (USD Million) (Kilotons)
7.7.5.4. Market estimates and forecast, by application, 2018 - 2030 (USD Million) (Kilotons)
7.7.6. South Africa
7.7.6.1. Market estimates and forecast, 2018 - 2030 (USD Million) (Kilotons)
7.7.6.2. Market estimates and forecast, by product, 2018 - 2030 (USD Million) (Kilotons)
7.7.6.3. Market estimates and forecast, by type, 2018 - 2030 (USD Million) (Kilotons)
7.7.6.4. Market estimates and forecast, by application, 2018 - 2030 (USD Million) (Kilotons)
Chapter 8. Competitive Landscape
8.1. Recent Developments & Impact Analysis, By Key Market Participants
8.2. Company Categorization
8.3. Heat Map Analysis
8.4. Market Strategies
8.5. Vendor Landscape
8.5.1. List of distributors, and channel partners
8.5.2. List of potential end-users
8.6. Strategy Mapping
8.7. Company Profiles/Listing
8.7.1. AutoMark Technologies (India) Pvt. Ltd.
8.7.1.1. Company Overview
8.7.1.2. Financial Performance
8.7.1.3. Product Benchmarking
8.7.2. The Sherwin-Williams Company
8.7.2.1. Company Overview
8.7.2.2. Financial Performance
8.7.2.3. Product Benchmarking
8.7.3. Geveko Markings
8.7.3.1. Company Overview
8.7.3.2. Financial Performance
8.7.3.3. Product Benchmarking
8.7.4. Ennis Flint, Inc.
8.7.4.1. Company Overview
8.7.4.2. Financial Performance
8.7.4.3. Product Benchmarking
8.7.5. Crown Techno
8.7.5.1. Company Overview
8.7.5.2. Financial Performance
8.7.5.3. Product Benchmarking
8.7.6. Dow Inc.
8.7.6.1. Company Overview
8.7.6.2. Financial Performance
8.7.6.3. Product Benchmarking
8.7.7. The 3M Company
8.7.7.1. Company Overview
8.7.7.2. Financial Performance
8.7.7.3. Product Benchmarking
8.7.8. Swarco
8.7.8.1. Company Overview
8.7.8.2. Financial Performance
8.7.8.3. Product Benchmarking
List of Tables
Table 1. Traffic road marking coatings market estimates and forecasts, 2018 - 2030 (USD Million) (Kilotons)
Table 2. Traffic road marking coatings market estimates and forecasts, by paint, 2018 - 2030 (USD Million) (Kilotons)
Table 3. Traffic road marking coatings market estimates and forecasts, by thermoplastic, 2018 - 2030 (USD Million) (Kilotons)
Table 4. Traffic road marking coatings market estimates and forecasts, by performed polymer tape, 2018 - 2030 (USD Million) (Kilotons)
Table 5. Traffic road marking coatings market estimates and forecasts, by epoxy, 2018 - 2030 (USD Million) (Kilotons)
Table 6. Traffic road marking coatings market estimates and forecasts, by permanent, 2018 - 2030 (USD Million) (Kilotons)
Table 7. Traffic road marking coatings market estimates and forecasts, by removable, 2018 - 2030 (USD Million) (Kilotons)
Table 8. Traffic road marking coatings market estimates and forecasts, by road marking line, 2018 - 2030 (USD Million) (Kilotons)
Table 9. Traffic road marking coatings market estimates and forecasts, by road marking labels, 2018 - 2030 (USD Million) (Kilotons)
Table 10. North America Traffic road marking coatings market estimates and forecasts, 2018 - 2030 (USD Million) (Kilotons)
Table 11. North America Traffic road marking coatings market estimates and forecasts, by product, 2018 - 2030 (USD Million)
Table 12. North America Traffic road marking coatings market estimates and forecasts, by product, 2018 - 2030 (Kilotons)
Table 13. North America Traffic road marking coatings market estimates and forecasts, by type, 2018 - 2030 (USD Million)
Table 14. North America Traffic road marking coatings market estimates and forecasts, by type, 2018 - 2030 (Kilotons)
Table 15. North America Traffic road marking coatings market estimates and forecasts, by application, 2018 - 2030 (USD Million)
Table 16. North America Traffic road marking coatings market estimates and forecasts, by application, 2018 - 2030 (Kilotons)
Table 17. U.S. Traffic road marking coatings market estimates and forecasts, 2018 - 2030 (USD Million) (Kilotons)
Table 18. U.S. Traffic road marking coatings market estimates and forecasts, by product, 2018 - 2030 (USD Million)
Table 19. U.S. Traffic road marking coatings market estimates and forecasts, by product, 2018 - 2030 (Kilotons)
Table 20. U.S. Traffic road marking coatings market estimates and forecasts, by type, 2018 - 2030 (USD Million)
Table 21. U.S. Traffic road marking coatings market estimates and forecasts, by type, 2018 - 2030 (Kilotons)
Table 22. U.S. Traffic road marking coatings market estimates and forecasts, by application, 2018 - 2030 (USD Million)
Table 23. U.S. Traffic road marking coatings market estimates and forecasts, by application, 2018 - 2030 (Kilotons)
Table 24. Canada Traffic road marking coatings market estimates and forecasts, 2018 - 2030 (USD Million) (Kilotons)
Table 25. Canada Traffic road marking coatings market estimates and forecasts, by product, 2018 - 2030 (USD Million)
Table 26. Canada Traffic road marking coatings market estimates and forecasts, by product, 2018 - 2030 (Kilotons)
Table 27. Canada Traffic road marking coatings market estimates and forecasts, by type, 2018 - 2030 (USD Million)
Table 28. Canada Traffic road marking coatings market estimates and forecasts, by type, 2018 - 2030 (Kilotons)
Table 29. Canada Traffic road marking coatings market estimates and forecasts, by application, 2018 - 2030 (USD Million)
Table 30. Canada Traffic road marking coatings market estimates and forecasts, by application, 2018 - 2030 (Kilotons)
Table 31. Mexico Traffic road marking coatings market estimates and forecasts, 2018 - 2030 (USD Million) (Kilotons)
Table 32. Mexico Traffic road marking coatings market estimates and forecasts, by product, 2018 - 2030 (USD Million)
Table 33. Mexico Traffic road marking coatings market estimates and forecasts, by product, 2018 - 2030 (Kilotons)
Table 34. Mexico Traffic road marking coatings market estimates and forecasts, by type, 2018 - 2030 (USD Million)
Table 35. Mexico Traffic road marking coatings market estimates and forecasts, by type, 2018 - 2030 (Kilotons)
Table 36. Mexico Traffic road marking coatings market estimates and forecasts, by application, 2018 - 2030 (USD Million)
Table 37. Mexico Traffic road marking coatings market estimates and forecasts, by application, 2018 - 2030 (Kilotons)
Table 38. Europe Traffic road marking coatings market estimates and forecasts, 2018 - 2030 (USD Million) (Kilotons)
Table 39. Europe Traffic road marking coatings market estimates and forecasts, by product, 2018 - 2030 (USD Million)
Table 40. Europe Traffic road marking coatings market estimates and forecasts, by product, 2018 - 2030 (Kilotons)
Table 41. Europe Traffic road marking coatings market estimates and forecasts, by type, 2018 - 2030 (USD Million)
Table 42. Europe Traffic road marking coatings market estimates and forecasts, by type, 2018 - 2030 (Kilotons)
Table 43. Europe Traffic road marking coatings market estimates and forecasts, by application, 2018 - 2030 (USD Million)
Table 44. Europe Traffic road marking coatings market estimates and forecasts, by application, 2018 - 2030 (Kilotons)
Table 45. Germany Traffic road marking coatings market estimates and forecasts, 2018 - 2030 (USD Million) (Kilotons)
Table 46. Germany Traffic road marking coatings market estimates and forecasts, by product, 2018 - 2030 (USD Million)
Table 47. Germany Traffic road marking coatings market estimates and forecasts, by product, 2018 - 2030 (Kilotons)
Table 48. Germany Traffic road marking coatings market estimates and forecasts, by type, 2018 - 2030 (USD Million)
Table 49. Germany Traffic road marking coatings market estimates and forecasts, by type, 2018 - 2030 (Kilotons)
Table 50. Germany Traffic road marking coatings market estimates and forecasts, by application, 2018 - 2030 (USD Million)
Table 51. Germany Traffic road marking coatings market estimates and forecasts, by application, 2018 - 2030 (Kilotons)
Table 52. France Traffic road marking coatings market estimates and forecasts, 2018 - 2030 (USD Million) (Kilotons)
Table 53. France Traffic road marking coatings market estimates and forecasts, by product, 2018 - 2030 (USD Million)
Table 54. France Traffic road marking coatings market estimates and forecasts, by product, 2018 - 2030 (Kilotons)
Table 55. France Traffic road marking coatings market estimates and forecasts, by type, 2018 - 2030 (USD Million)
Table 56. France Traffic road marking coatings market estimates and forecasts, by type, 2018 - 2030 (Kilotons)
Table 57. France Traffic road marking coatings market estimates and forecasts, by application, 2018 - 2030 (USD Million)
Table 58. France Traffic road marking coatings market estimates and forecasts, by application, 2018 - 2030 (Kilotons)
Table 59. U.K. Traffic road marking coatings market estimates and forecasts, 2018 - 2030 (USD Million) (Kilotons)
Table 60. U.K. Traffic road marking coatings market estimates and forecasts, by product, 2018 - 2030 (USD Million)
Table 61. U.K. Traffic road marking coatings market estimates and forecasts, by product, 2018 - 2030 (Kilotons)
Table 62. U.K. Traffic road marking coatings market estimates and forecasts, by type, 2018 - 2030 (USD Million)
Table 63. U.K. Traffic road marking coatings market estimates and forecasts, by type, 2018 - 2030 (Kilotons)
Table 64. U.K. Traffic road marking coatings market estimates and forecasts, by application, 2018 - 2030 (USD Million)
Table 65. U.K. Traffic road marking coatings market estimates and forecasts, by application, 2018 - 2030 (Kilotons)
Table 66. Russia Traffic road marking coatings market estimates and forecasts, 2018 - 2030 (USD Million) (Kilotons)
Table 67. Russia Traffic road marking coatings market estimates and forecasts, by product, 2018 - 2030 (USD Million)
Table 68. Russia Traffic road marking coatings market estimates and forecasts, by product, 2018 - 2030 (Kilotons)
Table 69. Russia Traffic road marking coatings market estimates and forecasts, by type, 2018 - 2030 (USD Million)
Table 70. Russia Traffic road marking coatings market estimates and forecasts, by type, 2018 - 2030 (Kilotons)
Table 71. Russia Traffic road marking coatings market estimates and forecasts, by application, 2018 - 2030 (USD Million)
Table 72. Russia Traffic road marking coatings market estimates and forecasts, by application, 2018 - 2030 (Kilotons)
Table 73. Russia Traffic road marking coatings market estimates and forecasts, 2018 - 2030 (USD Million) (Kilotons)
Table 74. Italy Traffic road marking coatings market estimates and forecasts, by product, 2018 - 2030 (USD Million)
Table 75. Italy Traffic road marking coatings market estimates and forecasts, by product, 2018 - 2030 (Kilotons)
Table 76. Italy Traffic road marking coatings market estimates and forecasts, by type, 2018 - 2030 (USD Million)
Table 77. Italy Traffic road marking coatings market estimates and forecasts, by type, 2018 - 2030 (Kilotons)
Table 78. Italy Traffic road marking coatings market estimates and forecasts, by application, 2018 - 2030 (USD Million)
Table 79. Italy Traffic road marking coatings market estimates and forecasts, by application, 2018 - 2030 (Kilotons)
Table 80. Asia Pacific Traffic road marking coatings market estimates and forecasts, 2018 - 2030 (USD Million) (Kilotons)
Table 81. Asia Pacific Traffic road marking coatings market estimates and forecasts, by product, 2018 - 2030 (USD Million)
Table 82. Asia Pacific Traffic road marking coatings market estimates and forecasts, by product, 2018 - 2030 (Kilotons)
Table 83. Asia Pacific Traffic road marking coatings market estimates and forecasts, by type, 2018 - 2030 (USD Million)
Table 84. Asia Pacific Traffic road marking coatings market estimates and forecasts, by type, 2018 - 2030 (Kilotons)
Table 85. Asia Pacific Traffic road marking coatings market estimates and forecasts, by application, 2018 - 2030 (USD Million)
Table 86. Asia Pacific Traffic road marking coatings market estimates and forecasts, by application, 2018 - 2030 (Kilotons)
Table 87. China Traffic road marking coatings market estimates and forecasts, 2018 - 2030 (USD Million) (Kilotons)
Table 88. China Traffic road marking coatings market estimates and forecasts, by product, 2018 - 2030 (USD Million)
Table 89. China Traffic road marking coatings market estimates and forecasts, by product, 2018 - 2030 (Kilotons)
Table 90. China Traffic road marking coatings market estimates and forecasts, by type, 2018 - 2030 (USD Million)
Table 91. China Traffic road marking coatings market estimates and forecasts, by type, 2018 - 2030 (Kilotons)
Table 92. China Traffic road marking coatings market estimates and forecasts, by application, 2018 - 2030 (USD Million)
Table 93. China Traffic road marking coatings market estimates and forecasts, by application, 2018 - 2030 (Kilotons)
Table 94. Japan Traffic road marking coatings market estimates and forecasts, 2018 - 2030 (USD Million) (Kilotons)
Table 95. Japan Traffic road marking coatings market estimates and forecasts, by product, 2018 - 2030 (USD Million)
Table 96. Japan Traffic road marking coatings market estimates and forecasts, by product, 2018 - 2030 (Kilotons)
Table 97. Japan Traffic road marking coatings market estimates and forecasts, by type, 2018 - 2030 (USD Million)
Table 98. Japan Traffic road marking coatings market estimates and forecasts, by type, 2018 - 2030 (Kilotons)
Table 99. Japan Traffic road marking coatings market estimates and forecasts, by application, 2018 - 2030 (USD Million)
Table 100. Japan Traffic road marking coatings market estimates and forecasts, by application, 2018 - 2030 (Kilotons)
Table 101. Australia Traffic road marking coatings market estimates and forecasts, 2018 - 2030 (USD Million) (Kilotons)
Table 102. Australia Traffic road marking coatings market estimates and forecasts, by product, 2018 - 2030 (USD Million)
Table 103. Australia Traffic road marking coatings market estimates and forecasts, by product, 2018 - 2030 (Kilotons)
Table 104. Australia Traffic road marking coatings market estimates and forecasts, by type, 2018 - 2030 (USD Million)
Table 105. Australia Traffic road marking coatings market estimates and forecasts, by type, 2018 - 2030 (Kilotons)
Table 106. Australia Traffic road marking coatings market estimates and forecasts, by application, 2018 - 2030 (USD Million)
Table 107. Australia Traffic road marking coatings market estimates and forecasts, by application, 2018 - 2030 (Kilotons)
Table 108. India Traffic road marking coatings market estimates and forecasts, 2018 - 2030 (USD Million) (Kilotons)
Table 109. India Traffic road marking coatings market estimates and forecasts, by product, 2018 - 2030 (USD Million)
Table 110. India Traffic road marking coatings market estimates and forecasts, by product, 2018 - 2030 (Kilotons)
Table 111. India Traffic road marking coatings market estimates and forecasts, by type, 2018 - 2030 (USD Million)
Table 112. India Traffic road marking coatings market estimates and forecasts, by type, 2018 - 2030 (Kilotons)
Table 113. India Traffic road marking coatings market estimates and forecasts, by application, 2018 - 2030 (USD Million)
Table 114. India Traffic road marking coatings market estimates and forecasts, by application, 2018 - 2030 (USD Kilotons)
Table 115. Central & South America Traffic road marking coatings market estimates and forecasts, 2018 - 2030 (USD Million) (Kilotons)
Table 116. Central & South America Traffic road marking coatings market estimates and forecasts, by product, 2018 - 2030 (USD Million)
Table 117. Central & South America Traffic road marking coatings market estimates and forecasts, by product, 2018 - 2030 (Kilotons)
Table 118. Central & South America Traffic road marking coatings market estimates and forecasts, by type, 2018 - 2030 (USD Million)
Table 119. Central & South America Traffic road marking coatings market estimates and forecasts, by type, 2018 - 2030 (Kilotons)
Table 120. Central & South America Traffic road marking coatings market estimates and forecasts, by application, 2018 - 2030 (USD Million)
Table 121. Central & South America Traffic road marking coatings market estimates and forecasts, by application, 2018 - 2030 (Kilotons)
Table 122. Brazil Traffic road marking coatings market estimates and forecasts, 2018 - 2030 (USD Million) (Kilotons)
Table 123. Brazil Traffic road marking coatings market estimates and forecasts, by product, 2018 - 2030 (USD Million)
Table 124. Brazil Traffic road marking coatings market estimates and forecasts, by product, 2018 - 2030 (Kilotons)
Table 125. Brazil Traffic road marking coatings market estimates and forecasts, by type, 2018 - 2030 (USD Million)
Table 126. Argentina Traffic road marking coatings market estimates and forecasts, by type, 2018 - 2030 (Kilotons)
Table 127. Argentina Traffic road marking coatings market estimates and forecasts, by application, 2018 - 2030 (USD Million)
Table 128. Argentina Traffic road marking coatings market estimates and forecasts, 2018 - 2030 (USD Million) (Kilotons)
Table 129. Argentina Traffic road marking coatings market estimates and forecasts, by product, 2018 - 2030 (USD Million)
Table 130. Argentina Traffic road marking coatings market estimates and forecasts, by product, 2018 - 2030 (Kilotons)
Table 131. Argentina Traffic road marking coatings market estimates and forecasts, by type, 2018 - 2030 (USD Million)
Table 132. Argentina Traffic road marking coatings market estimates and forecasts, by type, 2018 - 2030 (Kilotons)
Table 133. Argentina Traffic road marking coatings market estimates and forecasts, by application, 2018 - 2030 (USD Million)
Table 134. Middle East & Africa Traffic road marking coatings market estimates and forecasts, 2018 - 2030 (USD Million) (Kilotons)
Table 135. Middle East & Africa Traffic road marking coatings market estimates and forecasts, by product, 2018 - 2030 (USD Million)
Table 136. Middle East & Africa Traffic road marking coatings market estimates and forecasts, by product, 2018 - 2030 (Kilotons)
Table 137. Middle East & Africa Traffic road marking coatings market estimates and forecasts, by type, 2018 - 2030 (USD Million)
Table 138. Middle East & Africa Traffic road marking coatings market estimates and forecasts, by type, 2018 - 2030 (Kilotons)
Table 139. Middle East & Africa Traffic road marking coatings market estimates and forecasts, by application, 2018 - 2030 (USD Million)
Table 140. Middle East & Africa Traffic road marking coatings market estimates and forecasts, by application, 2018 - 2030 (Kilotons)
Table 141. Saudi Arabia Traffic road marking coatings market estimates and forecasts, 2018 - 2030 (USD Million) (Kilotons)
Table 142. Saudi Arabia Traffic road marking coatings market estimates and forecasts, by product, 2018 - 2030 (USD Million)
Table 143. Saudi Arabia Traffic road marking coatings market estimates and forecasts, by product, 2018 - 2030 (Kilotons)
Table 144. Saudi Arabia Traffic road marking coatings market estimates and forecasts, by type, 2018 - 2030 (USD Million)
Table 145. Saudi Arabia Traffic road marking coatings market estimates and forecasts, by type, 2018 - 2030 (Kilotons)
Table 146. Saudi Arabia Traffic road marking coatings market estimates and forecasts, by application, 2018 - 2030 (USD Million)
Table 147. South Africa Traffic road marking coatings market estimates and forecasts, 2018 - 2030 (USD Million) (Kilotons)
Table 148. South Africa Traffic road marking coatings market estimates and forecasts, by product, 2018 - 2030 (USD Million)
Table 149. South Africa Traffic road marking coatings market estimates and forecasts, by product, 2018 - 2030 (Kilotons)
Table 150. South Africa Traffic road marking coatings market estimates and forecasts, by type, 2018 - 2030 (USD Million)
Table 151. South Africa Traffic road marking coatings market estimates and forecasts, by type, 2018 - 2030 (Kilotons)
Table 152. South Africa Traffic road marking coatings market estimates and forecasts, by application, 2018 - 2030 (USD Million)
List of Figures
Fig 1. Market segmentation
Fig 2. Information procurement
Fig 3. Data Analysis Models
Fig 4. Market Formulation and Validation
Fig 5. Market snapshot
Fig 6. Segmental outlook- Product, type, and application
Fig 7. Competitive outlook
Fig 8. Traffic road marking coatings market, 2018 - 2030 (USD Million) (Kilotons)
Fig 9. Value chain analysis
Fig 10. Market dynamics
Fig 11. Porter’s Analysis
Fig 12. PESTEL Analysis
Fig 13. Traffic road marking coatings market, by product: Key takeaways
Fig 14. Traffic road marking coatings market, by product: Market share, 2023 & 2030
Fig 15. Traffic road marking coatings market, by type: Key takeaways
Fig 16. Traffic road marking coatings market, by type: Market share, 2023 & 2030
Fig 17. Traffic road marking coatings market, by application: Key takeaways
Fig 18. Traffic road marking coatings market, by application: Market share, 2023 & 2030
Fig 19. Traffic road marking coatings market, by region: Key takeaways
Fig 20. Traffic road marking coatings market, by region: Market share, 2023 & 2030
Market Segmentation
Roads are one of the significant modes of transportation for a majority of individuals. Several individuals commute through road networks daily, increasing the need to manage traffic and ensure safety. Therefore, different means, including signals, signs, and traffic road markings, are used to manage traffic by communicating or delivering information to people traveling by road. According to WHO, as of 2018, developing countries had more unmanaged traffic than developed countries. Unmanaged traffic often leads to a higher number of road accidents, which results in serious injuries and fatalities. WHO statistics claim that every year, over 1.35 million people die in road accidents, while approximately 20 million to 50 million people suffer from non-fatal injuries. Road injuries were ranked as the 8th leading cause of death in 2016 and are expected to emerge as the 5th leading cause of death by 2030. Furthermore, the same report suggests that middle-income and low-income areas account for a share of 90% of the total global road fatalities.
The traffic road marking coatings demand is directly linked to road infrastructure spending. An increase in highway and street construction initiatives is expected to boost the use of traffic road markings to manage traffic flow, which, in turn, is expected to augment the overall product demand.
Traffic marking is essential for all roads, including highways and streets, to ensure traffic flow management. A consistent road maintenance routine ensures road safety and prevents accidents. The demand for road safety products is heavily influenced by government initiatives to improve road safety in their regions.A consistent road maintenance routine ensures road safety and prevents accidents. The demand for road safety products is heavily influenced by government initiatives to improve road safety in their regions. In recent years, a high number of road fatalities has resulted in the formation of more stringent national standards as well as the regulatory framework for road marking reflectivity, which, in turn, has accelerated the demand for frequent restriping. The demand for traffic-keeping coatings is not only associated with road construction activities but also depends on the maintenance, repair, and repainting of existing roads. While most countries focus on constructing new highways and streets, few also invest in repainting and maintenance activities. For instance, in Germany, the maintenance of highways has become essential to maintain road quality and traffic flow, for which the country requires a massive amount of funds and investments.
This section will provide insights into the contents included in this traffic road marking coatings market report and help gain clarity on the structure of the report to assist readers in navigating smoothly.
Industry overview
Industry trends
Market drivers and restraints
Market size
Growth prospects
Porter’s analysis
PESTEL analysis
Key market opportunities prioritized
Competitive landscape
Company overview
Financial performance
Product benchmarking
Latest strategic developments
Market size, estimates, and forecast from 2018 to 2030
Market estimates and forecast for product segments up to 2030
Regional market size and forecast for product segments up to 2030
Market estimates and forecast for application segments up to 2030
Regional market size and forecast for application segments up to 2030
Company financial performance
A three-pronged approach was followed for deducing the traffic road marking coatings market estimates and forecasts. The process has three steps: information procurement, analysis, and validation. The whole process is cyclical, and steps repeat until the estimates are validated. The three steps are explained in detail below:
Information procurement: Information procurement is one of the most extensive and important stages in our research process, and quality data is critical for accurate analysis. We followed a multi-channel data collection process for traffic road marking coatings market to gather the most reliable and current information possible.
Analysis: We mine the data collected to establish baselines for forecasting, identify trends and opportunities, gain insight into consumer demographics and drivers, and so much more. We utilized different methods of traffic road marking coatings market data depending on the type of information we’re trying to uncover in our research.
Market Research Efforts: Bottom-up Approach for estimating and forecasting demand size and opportunity, top-down Approach for new product forecasting and penetration, and combined approach of both Bottom-up and Top-down for full coverage analysis.
Value-Chain-Based Sizing & Forecasting: Supply-side estimates for understanding potential revenue through competitive benchmarking, forecasting, and penetration modeling.
Demand-side estimates for identifying parent and ancillary markets, segment modeling, and heuristic forecasting.
Qualitative Functional Deployment (QFD) Modelling for market share assessment.
Market formulation and validation: We mine the data collected to establish baselines for forecasting, identify trends and opportunities, gain insight into consumer demographics and drivers, and so much more. We utilize different methods of data analysis depending on the type of information we’re trying to uncover in our research.
Market Formulation: This step involves the finalization of market numbers. This step on an internal level is designed to manage outputs from the Data Analysis step.
Data Normalization: The final market estimates and forecasts are then aligned and sent to industry experts, in-panel quality control managers for validation.
This step also entails the finalization of the report scope and data representation pattern.
Validation: The process entails multiple levels of validation. All these steps run in parallel, and the study is forwarded for publishing only if all three levels render validated results.
The traffic road marking coatings market was categorized into four segments, namely product (Paint, Thermoplastic, Preformed Polymer Tape, Epoxy), type (Permanent, Removable), application (Road Marking Lines, Road Marking Labels), and region (North America, Europe, Asia Pacific, Central & South America, Middle East & Africa).
The traffic road marking coatings market was segmented into product, type, application, and regions. The demand at a segment level was deduced using a funnel method. Concepts like the TAM, SAM, SOM, etc., were put into practice to understand the demand. We at GVR deploy three methods to deduce market estimates and determine forecasts. These methods are explained below:
Demand estimation of each product across countries/regions summed up to from the total market.
Variable analysis for demand forecast.
Demand estimation via analyzing paid database, and company financials either via annual reports or paid database.
Primary interviews for data revalidation and insight collection.
Used extensively for new product forecasting or analyzing penetration levels.
Tool used invoice product flow and penetration models Use of regression multi-variant analysis for forecasting Involves extensive use of paid and public databases.
Primary interviews and vendor-based primary research for variable impact analysis.
The traffic road marking coatings market was analyzed at a regional level. The globe was divided into North America, Europe, Asia Pacific, Central & South America, and Middle East & Africa, keeping in focus variables like consumption patterns, export-import regulations, consumer expectations, etc. These regions were further divided into sixteen countries, namely, the U.S.; Canada; Mexico; Germany; France; Italy; the UK.; Russia; China; India; Japan; Australia; Brazil; Argentina; Saudi Arabia; South Africa.
All three above-mentioned market research methodologies were applied to arrive at regional-level conclusions. The regions were then summed up to form the global market.
The traffic road marking coatings market was analyzed via companies operating in the sector. Analyzing these companies and cross-referencing them to the demand equation helped us validate our assumptions and conclusions. Key market players analyzed include:
3M Company , 3M Company is a diversified technology company established in 1902 and headquartered in Minnesota, U.S. It changed its name from Minnesota Mining and Manufacturing Company to 3M Company in 2002. The company has regional sales and manufacturing units in over 70 countries across North America, Europe, Asia Pacific, the Middle East, and Africa. The company has segmented its product portfolio into products for consumers and products for businesses. Products for businesses have been classified based on their end use, including automotive, commercial solutions, communication, design and construction, electronics, energy, healthcare, manufacturing, mining, oil and gas, safety and graphics, and transportation. Products for consumers have been classified based on the applications, including decorating, organizing and crafts, cleaning and protecting, office, home improvement, school supplies, personal health care, and sports and recreation. The company has been constantly involved in research and development in over 46 technology platforms, including abrasives, adhesives, electronics and software, nanotechnology, nonwoven materials, and surface modification. It had about 95,000 employees at the end of 2020.
Dow Inc. , Dow Inc. was established on April 1, 2019, after being separated from Dupont. The company is headquartered in Midland, U.S. The company operates through three segments: industrial intermediates and infrastructure, performance materials and coatings, and packaging and specialty plastics. The company caters its plastic products to various end-use industries such as consumer goods, healthcare, food & beverage, personal care, construction, life sciences, paints & coatings, and paper. As of April 2019, the company had 109 manufacturing facilities in countries including the U.S., India, Thailand, and South Africa and catered its products to 31 countries with an employee strength of 36,500 individuals.
SWARCO , SWARCO was established in 1969 and is headquartered in Wattens, Austria. The company. SWARCO is a traffic management and safety products manufacturing company. Its product portfolio includes glass beads, waterborne and solvent-borne paints, 2-component systems, thermoplastic systems, safety markings, indoor markings, afterglow systems, and specialty systems. These products find application in road lanes, cycle paths, construction zones, parking, airports, playgrounds, race tracks, and indoor markings. The company specializes in manufacturing and supplying retroreflective road marking systems. It has a presence in 25 countries across regions such as North America, Central America, Europe, and Asia Pacific, and over 3,800 traffic experts working to date.
The Sherwin-Williams Company , The Sherwin-Williams Company manufactures and distributes paints, stains, and coatings for all purposes. The company was formed in 1866 and is established in Cleveland, Ohio, U.S. It has categorized its business into five segments, namely protective & marine coatings; paints, stains, colors & supplies; product finishes; automotive & transportation finishes; and aerospace finishes. Protective & marine coatings include acrylic, aggregates, alkyd, floor coatings, epoxy, fire protection, marine & specialty coatings, heat resistant, pavement marking, polyurethane, and tank linings. It caters to the needs of various end-use industries such as construction, food & beverage, healthcare, marine, mining, oil & gas, utility & energy, pulp & paper, and industrial manufacturing. Pavement markings are manufactured using latex, acrylic copolymers, alkyd, and chlorinated rubber for traffic road marking coatings.The company has operations across North & South America, Europe, Asia-Pacific, and Africa. As of 2020, it had 61,031 employees.
Geveko Markings , Geveko Markings was established in 1924 and is headquartered in Rudkøbing, Denmark. The company is into the business of manufacturing horizontal signage, decorative markings, road marking coatings, and line marking coatings. In addition, it manufactures general products such as road sensor reflectometer, infrared thermometer, gas burners, and primers. The company's product portfolio includes thermoplastic & performed thermoplastic markings, cold plastic road markings, waterborne road marking paints, solvent-borne road marking paints, decorative & colorful markings, tactile markings, surface detect repair systems, indoor marking paints, and antiskid materials. It caters to the needs of indoor and outdoor applications such as roads, pathways, parking spaces, and airports for safety and decorative purposes. It has production sites in 11 countries across the globe to cater to the requirements of its customers.
Ennis Flint, Inc. , Ennis Flint, Inc. was formed in 2012 after the merger between Ennis Traffic Safety Solutions and Flint Trading, Inc. It is headquartered in Greensboro, North Carolina, U.S. and is engaged in the business of providing pavement markings and traffic safety solutions. The company has segmented its products into regulatory pavement markings, decorative pavement markings, and markings for airports & military. Its product portfolio includes marking paints, thermoplastic & performed thermoplastic markings, pavement markers, retro reflectometers, integrated multipolymer, and decorative pavement markings. These marking coatings find application in crosswalks, medians, islands, roundabouts, entryways, logos, taxiways, ramps, aprons, gates, and airfield vehicle roadways. The company has over 25 manufacturing/distribution facilities globally and 9 technical service facilities in North America. Technical services include training, demos & test desks, and assistance with equipment calibration among others.
Crown Technology, LLC , Crown Technology, LLC is headquartered in Woodbury, Georgia, U.S. It manufactures superior pavement marking products and systems. The company started to manufacture thermoplastics in 1994, and in 1996, it shifted its headquarters from Columbus, Georgia, to Woodbury, Georgia. The company classified its product portfolio into hot applied thermoplastics, performed thermoplastics, intersection grade thermoplastics, audible vibratory systems, and reflective pavement markers.
K.M. Contractors Pvt. Ltd. , IEW K.M. Contractors Pvt. Ltd. is headquartered in New Delhi, India. It offers contracting services for infrastructure companies in the domain of thermoplastic road marking paint, road furniture & road signages, and bituminous mastic asphalt. Thermoplastic road marking paints are used in traffic marking and road safety applications. Other services the company provides include fixing of delineators, road studs, and bollards for road safety. Some key clients include AFCONS, VALECHA Eng., CONTINENTAL Eng., and NAVAYUG Eng.
Automark Technologies (India) Pvt. Ltd. , Automark Technologies (India) Pvt. Ltd. was established in 2002 and is headquartered in Nagpur, India. It is involved in manufacturing pavement marking and road striping and marking products. The company started manufacturing thermoplastic materials in 2004 with a production capacity of 5 metric kilotons per day and as of 2019, it produces about 150 metric kilotons a day and 30,000 metric kilotons per annum. Its product portfolio includes curb paints, thermoplastic road marking paints/materials, concrete primer for thermoplastic paints, and machinery for thermoplastic road markings and road/airstrip. The company exports its products to countries such as Hong Kong, Kenya, Botswana, Israel, Cyprus, Ireland, Guyana, Nepal, Uganda, Tanzania, Sri Lanka, Palestine, Ghana, Qatar, Bahrain, and Bangladesh. It caters to various applications such as road markings, airfield markings, kerb markings, markings on old bitumen and concrete surfaces, and others. The company has two subsidiaries, namely Automark Technologies Tanzania Limited and Automark Kenya Limited.
Asian Paints PPG Pvt. Ltd. , Asian Paints PPG Pvt. Ltd. is a joint venture between PPG Industries, U.S., and Asian Paints Ltd., India. The company is headquartered in Mumbai, India. It manufactures coatings and specializes in producing floor, protective, road marking, and powder coatings. Protective coating products are sold under multiple brands including Asian Paints and Sigma, whereas, powder coatings are sold under Hawcoplast and Apcoshield brands. Floor coatings are offered under Apcoflor brand and road marking services are provided under Apcotrak, Apcomark, and Thermoline brands. Road marking coatings provide warning signals and traffic information to travelers. The company's road marking coatings are classified into acrylic retro-reflective waterborne paints, type 2 retro-reflective drop-on glass beads, hot-applied retroreflective thermoplastic material, and conventional water/solvent-based road marking paints, which are available in white, black, and golden yellow colors. Road marking coatings have applications in highways and taxiways at airports. The company has powder coating manufacturing facilities in Himachal Pradesh and Gujarat, India
Supply Side Estimates
Company revenue estimation via referring to annual reports, investor presentations, and Hoover’s.
Segment revenue determination via variable analysis and penetration modeling.
Competitive benchmarking to identify market leaders and their collective revenue shares.
Forecasting via analyzing commercialization rates, pipelines, market initiatives, distribution networks, etc.
Demand side estimates
Identifying parent markets and ancillary markets
Segment penetration analysis to obtain pertinent
revenue/volume
Heuristic forecasting with the help of subject matter experts
Forecasting via variable analysis
Understanding market dynamics (in terms of drivers, restraints, & opportunities) in the countries.
Understanding trends & variables in the individual countries & their impact on growth and using analytical tools to provide high-level insights into the market dynamics and the associated growth pattern.
Understanding market estimates and forecasts (with the base year as 2021, historic information from 2019 to 2020, and forecast from 2022 to 2030). Regional estimates & forecasts for each category are available and are summed up to form the global market estimates.
The report provides market value for the base year 2021 and a yearly forecast till 2030 in terms of revenue/volume or both. The market for each of the segment outlooks has been provided on region & country basis for the above-mentioned forecast period.
The key industry dynamics, major technological trends, and application markets are evaluated to understand their impact on the demand for the forecast period. The growth rates were estimated using correlation, regression, and time-series analysis.
We have used the bottom-up approach for market sizing, analyzing key regional markets, dynamics, & trends for various products and end-users. The total market has been estimated by integrating the country markets.
All market estimates and forecasts have been validated through primary interviews with the key industry participants.
Inflation has not been accounted for to estimate and forecast the market.
Numbers may not add up due to rounding off.
Europe consists of EU-8, Central & Eastern Europe, along with the Commonwealth of Independent States (CIS).
Asia Pacific includes South Asia, East Asia, Southeast Asia, and Oceania (Australia & New Zealand).
Latin America includes Central American countries and the South American continent
Middle East includes Western Asia (as assigned by the UN Statistics Division) and the African continent.
GVR strives to procure the latest and unique information for reports directly from industry experts, which gives it a competitive edge. Quality is of utmost importance to us, therefore every year we focus on increasing our experts’ panel. Primary interviews are one of the critical steps in identifying recent market trends and scenarios. This process enables us to justify and validate our market estimates and forecasts to our clients. With more than 8,000 reports in our database, we have connected with some key opinion leaders across various domains, including healthcare, technology, consumer goods, and the chemical sector. Our process starts with identifying the right platform for a particular type of report, i.e., emails, LinkedIn, seminars, or telephonic conversation, as every report is unique and requires a differentiated approach.
We send out questionnaires to different experts from various regions/ countries, which is dependent on the following factors:
Report/Market scope: If the market study is global, we send questionnaires to industry experts across various regions, including North America, Europe, Asia Pacific, Latin America, and MEA.
Market Penetration: If the market is driven by technological advancements, population density, disease prevalence, or other factors, we identify experts and send out questionnaires based on region or country dominance.
The time to start receiving responses from industry experts varies based on how niche or well-penetrated the market is. Our reports include a detailed chapter on the KoL opinion section, which helps our clients understand the perspective of experts already in the market space.
"The quality of research they have done for us has been excellent."