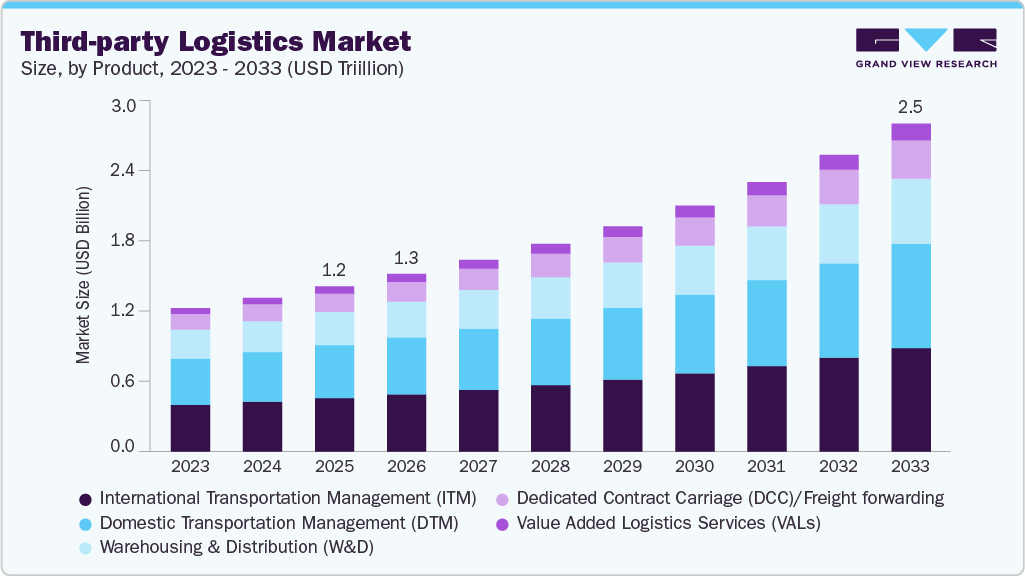
The global third-party logistics market size was estimated at USD 1,095.85 billion in 2023 and is expected to grow at a compound annual growth rate (CAGR) of 8.1% from 2024 to 2030. The development of transport infrastructure in Asia and Middle East, the thriving growth of the e-commerce sector, and the development of new technologies are expected to significantly contribute to the market growth. Shippers are focusing on outsourcing the transport activity to enhance their operations and cost-effectiveness. The increased working capital and globalization lead to the demand for efficient inventory management services. Moreover, the restructuring of the brick and mortar business model continues to provide dynamic growth to the industry.
The changing global supply chain to become more customer-centric enables companies to outsource their supply chain activities to focus on adaptability and responsiveness. Moreover, the volatile international documentation procedure and customs rules & regulations need the expertise to handle the complex supply chain activity. As a result, small and medium-sized businesses are also leveraging third party logistics (3PL) services.
The rise of e-commerce and digital phenomenon, also called 'The Amazon Effect', has changed consumer expectations and buying behavior. End-users are seeking unparalleled expectations in terms of convenience, cost, control, and choice. Omni-channel operation demands reliable, fast, and free shipping services, which has resulted in companies adopting a new business model to provide low-cost and on-demand delivery services. 3PL companies embrace various modifications in supply chain management to address the notable transformations and challenges that e-commerce presents.
The 3PL companies are shifting their focus from long-haul delivery to just-in-time delivery. The suppliers are also transitioning from multiple storage facilities to a single warehouse location. To accommodate an increase in last-mile delivery, 3PL companies invest in smaller trucks and vans, which can support shorter and more frequent deliveries. In the coming years, last-mile delivery is presumed to be one of the key areas of focus for logistics companies.
Fourth-Party Logistics (4PL) is the step ahead that can manage resources, infrastructure, technology, and even external 3PL to provide a holistic supply chain solution. The 4PL companies offer comprehensive consulting services in addition to transport operations. The service includes logistics strategy, inbound and outbound logistics, inventory planning and management, business planning, and analytics. Deloitte, Accenture plc, BDP International, and DB Schenker Logistics are some of the companies that are offering 4PL services. 4PL is a relatively new concept, but it is expected to gain momentum in the coming years from medium and large businesses seeking a complete transportation solution.
The third-party logistics market growth stage is moderate. The market has experienced a significant degree of innovation, marked by the adoption of advanced technologies such as blockchain, artificial intelligence, and predictive analytics. These innovations have streamlined supply chain operations, enhanced visibility, and optimized overall efficiency for both third-party logistics service providers and their clients. The evolving technological landscape highlights that the market players continue to leverage cutting-edge solutions to address challenges and meet the evolving demands of the global supply chain.
The target market is also characterized by a high level of mergers & acquisitions by the leading players. The high level of mergers and acquisitions (M&A) in the third-party logistics (3PL) market is driven by the pursuit of market consolidation and strategic expansion. Leading third-party logistics companies engage in M&A activities to broaden their service offerings, enhance geographical reach, and achieve economies of scale. By acquiring complementary businesses or competitors, these companies aim to strengthen their competitive position, improve operational efficiency, and capitalize on synergies within the dynamic and evolving landscape of the 3PL industry.
The target market is also subject to increasing regulatory scrutiny. The 3PL market faces increasing regulatory scrutiny as governments worldwide focus on enhancing transparency and accountability within supply chain operations. Increased concerns about data privacy, security, and compliance with international trade regulations are driving regulatory bodies to monitor the activities of 3PL providers closely. Stricter enforcement measures and evolving legal frameworks are shaping the regulatory landscape, necessitating adaptability and compliance from companies operating in the dynamic 3PL sector.
While there is a restricted availability of direct service substitutes for 3PL, various alternative methods and technologies, such as in-house logistics management, wherein companies internally manage their supply chain functions, and the advent of 4PL providers that deliver enhanced coordination and management throughout the entire supply chain, can impact the third party logistics (3PL) market. Technological advancements have facilitated the growth of digital platforms connecting shippers directly with carriers, offering a more decentralized and flexible transportation solution. Collaborative supply chain networks, involving multiple organizations pooling resources to share transportation, storage, and distribution capabilities, also act as substitutes for conventional 3PL services.
End user concentration is one of the significant factors in the Third-Party Logistics Market. End-user industry concentration in the 3PL market varies, with sectors such as retail, automotive, and electronics demonstrating notable reliance on third-party logistics services for supply chain management. These industries often leverage 3PL providers to optimize inventory, transportation, and distribution processes, enhancing overall operational efficiency. However, the level of concentration can differ across regions and is subject to dynamic shifts influenced by economic trends and industry-specific demands.
The Domestic Transportation Management (DTM) segment held the largest market share of 32.4 % in 2023. DTM services are performed in conjunction with freight brokers, which deal with shipment origin to their destination. The increasing trade movement among the unloading dock to a warehouse, escalating carrier rates, a surge in cross-docking services, and rising fuel surcharge are driving the growth of the DTM segment. The growing consumer demand in sectors such as retail, healthcare, and the steady GDP growth of various countries is further aiding the segment growth.
The continued growth in global economic activities and a rise in the e-commerce sector have led to an increase in demand for international transportation management services. Trade liberalization policies and cross-border transport activities have increased international trade, thereby propelling the segment growth. Free Trade Agreements (FTAs) are driving the demand for international transportation. The African Continental Free Trade Area (AfCFTA) and Progressive Trans-Pacific Partnership (CPTPP) are the two recent examples of rising multilateral free-trade agreements. Several bilateral free-trade agreements such as Costa Rica- South Korea FTA and Indonesia-Australia comprehensive economic partnership agreement are influencing the demand for international transportation services.
The roadways segment dominated the 3PL market with a share of over 58.2% in 2023. The growing public-private partnerships model and increased emphasis on supply chain infrastructure are expected to drive the growth of roadways over the forecast period. Besides, several government initiatives are fueling the growth of the road transportation segment. The recent regulations imposed by the Federal Motor Carrier Safety Administration that allow the use of cameras as a substitute for rearview mirrors are expected to benefit truck drivers in terms of safety.
The airways segment is expected to emerge as the fastest-growing segment expanding at a CAGR of 9.1% over the forecast period. The recent coronavirus outbreak has put a restriction on the global air freight trade resulting in a massive drop in the air uplift capacity, thereby increasing the carrier rates. Some companies such as CEVA Logistics have started medical relief cargo charters for emergency shipments such as PPE kits, facial masks, gloves, hand sanitizers, disposable gowns, respirators, ventilators, other COVID-19 relief equipment, and supplies.
The manufacturing sector held the largest revenue share of 24.8% in 2023. Manufacturing and logistics go hand in hand as the industry has a complex supply chain process. The manufacturing sector involves the procurement of raw materials and other parts from different resources across the regions. The involvement of various suppliers and distributors makes the transport activity a tedious job. Thereby, the manufacturing sector is outsourcing transportation activities owing to the benefits offered in terms of reduced transportation cost, supply chain visibility, inventory and vendor management, business process development, and improved customer services. The buoyant manufacturing sector in the U.S., Mexico, China, and India has witnessed an increase in outsourced transportation activities. The local manufacturing sector in India is growing with several tax reform policies and government initiatives such as 'Made in the USA' and 'Make in India' projects.
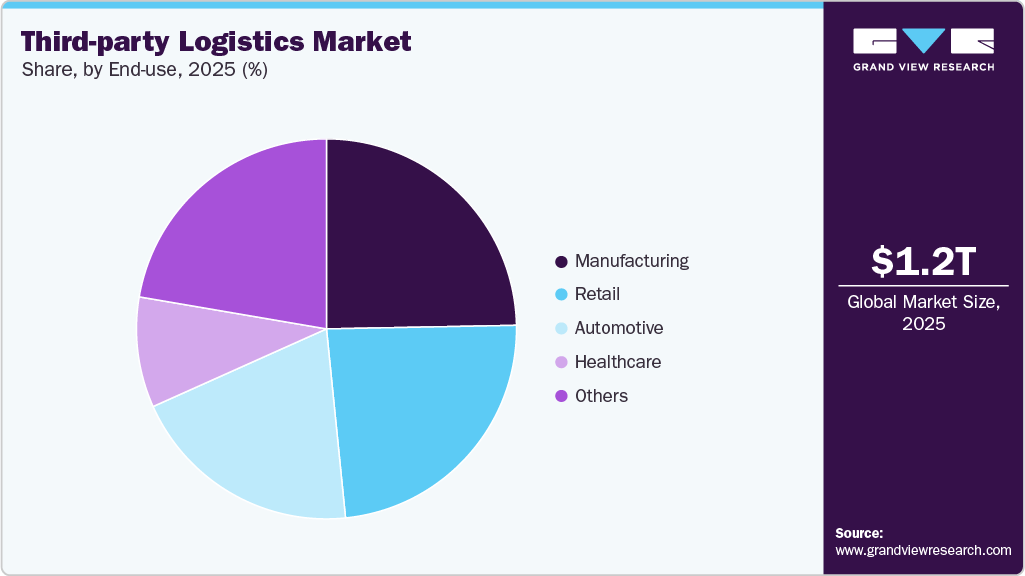
The automotive sector is expected to emerge as the fastest-growing segment expanding at a CAGR of 8.9% over the forecast period. Transportation and supply chain management is the backbone of the modern retail industry, playing a crucial role in same-day delivery and fulfillment capabilities. E-retailing and dedicated transportation services have paved the way for medium scale companies to enter the third-party logistics market, thereby helping the retail companies to expand their operations and offerings in semi-urban areas. Furthermore, 3PL offers flexibility to retail businesses to develop new Transports, enhance capabilities, and expand their regional presence.
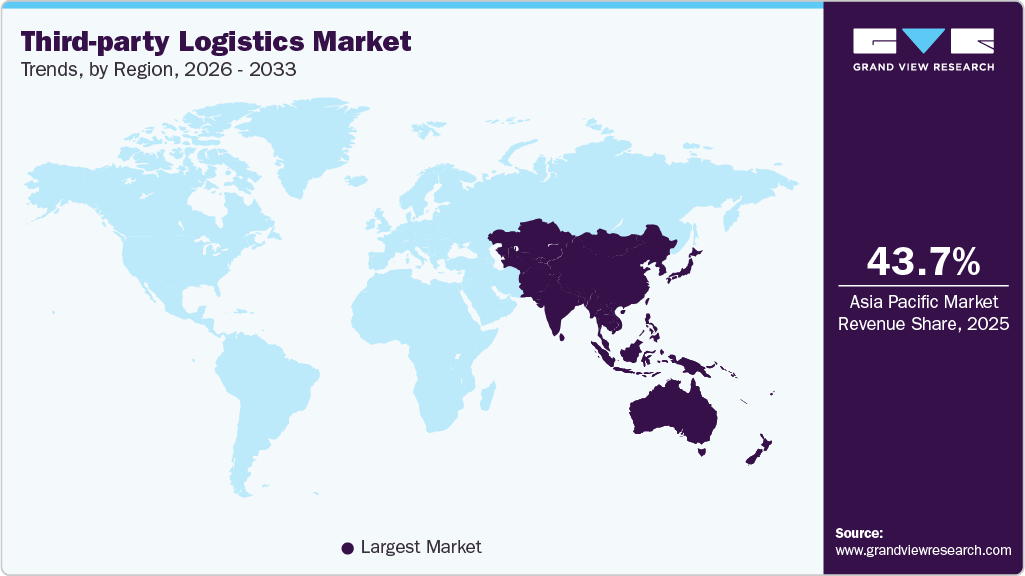
Asia Pacific accounted for the largest revenue share of 42.44% in 2023, and is expected to emerge as the fastest-growing segment over the forecast period. The growing trans-regional trade corridors and gateways are expected to create a huge opportunity for the 3PL providers. The concentration of manufacturing and sourcing in China has led towards the strategic shift of technology, pharmaceuticals, and the automotive sector in other countries. Such a shift is expected to propel market growth in countries, including India, South Korea, Japan, and Vietnam.
The ongoing development of supply chain infrastructure and increasing emphasis on transportation practices in emerging countries are expected to propel the market growth. For instance, the National Highways Authority of India (NHAI) and the National Highways Development Project (NHDP) have taken several initiatives for highway development. Under the Logistics Efficiency Enhancement Program (LEEP) set by the Government of India, the Ministry of Road Transport & Highways (MoRTH) is developing multi-modal logistics parks. Vietnam government proposed the Vietnam Sea Transport Development Plan, vision to 2030 to escalate maritime freight transportation. Under this plan, the government planned to invest in developing the deepwater port, transit port, and international gateway ports.
North America held a significant market share in 2023, with the U.S. spearheading the regional market growth. The tight truck capacity across the U.S. has led the shippers to move towards dedicated contract carriage services. Besides, the rising demand for cold storage in the region is expected to boost the third-party logistics market. Moreover, the presence of key players, including C.H. Robinson Worldwide (CHRW) Inc., XPO Logistics, Inc., UPS Supply Chain Solutions Inc., and Expeditors International of Washington, Inc. aid the regional market growth.
Some of the key players operating in the market include Burris Logistics, and FedEx among others.
Burris Logistics is a U.S.-based family-owned and privately held logistics company having expertise in refrigerated warehousing, food-service redistribution, and retail specialty work. The company uses its in-house software for logistical operations, thereby reducing the time and cutting down costs.
FedEx offers a vast portfolio of e-commerce, transportation, and business services. The company’s operations and activities are categorized under four reportable business segments, namely FedEx Freight, FedEx Express, FedEx Services, and FedEx Ground.
DB Schenker Logistics, and CEVA Logistics. are some of the emerging market participants in the target market.
DB Schenker Logistics, a German company, is involved in providing integrated service solutions. The company specializes in the exchange of goods in ocean and air freight, land transport, and contract logistics.
CEVA Logistics is a Dutch logistics company formed by the merger of EGL Global Logistics and TNT Logistics. CEVA is a non-asset-based supply chain management company, which offers several services based on its Contract Logistics and Freight Management expertise, either on a stand-alone basis or in combination.
The following are the leading companies in the third-party logistics market. These companies collectively hold the largest market share and dictate industry trends. Financials, strategy maps & products of these third-party logistics companies are analyzed to map the supply network.
In December 2023, Yusen Logistics Co. Ltd. entered into a strategic partnership with Pickle Robot Company, a leader in the field of physical Artificial Intelligence (AI) and robotic automation. Plans envisaged commencing the collaboration with the implementation of Pickle Unload solutions at Yusen Logistics Co. Ltd.'s Contract Logistics Group trans-loading operation located in Long Beach, California. By integrating the cutting-edge solution, Yusen Logistics Co. Ltd. will be able to reduce the physical workload for its employees and enhance service reliability. The partnership reflected Yusen Logistics Co. Ltd.’s dedication to introducing the most advanced robotics automation solutions within its warehouses, with the ultimate goal of providing superior service to its valued customers.
In September 2023, C.H. Robinson Worldwide, Inc. announced the opening of a new warehouse facility of 400,000 sq. ft. The warehouse is equipped with 154 dock doors and has the capacity to accommodate up to 700 trailers. This expansion enabled the company to extend its presence for trade along the Mexico border and diversify supply chains to ensure efficient transportation and logistics operations along The Port of Laredo.
In June 2023, Honor Foods, a subsidiary of Burris Logistics, completed the acquisition of Sunny Morning Foods, a renowned dairy brand and foodservice redistributor based in Florida. This strategic initiative enabled Honor Foods to strengthen its presence in the dairy industry and enhance its entire supply chain solutions. Moreover, this acquisition allowed Honor Foods to expand its operations to the Southeast region, including select areas in South America and the Caribbean. Honor Foods is better positioned to cater to the needs of customers in these regions while also gaining a competitive edge in the market.
Report Attribute |
Details |
Market size value in 2024 |
USD 1,174.54 billion |
Revenue forecast in 2030 |
USD 1,877.51 billion |
Growth rate |
CAGR of 8.1% from 2024 to 2030 |
Actual Data |
2017 - 2023 |
Forecast period |
2024 - 2030 |
Report updated |
February 2024 |
Quantitative units |
Revenue in USD billion and CAGR from 2024 to 2030 |
Report coverage |
Revenue forecast, company ranking, competitive landscape, growth factors, and trends |
Segments covered |
Service, transport, end-use, region |
Regional scope |
North America; Europe; Asia Pacific; South America; MEA |
Country scope |
U.S.; Canada; Mexico; Germany; UK; France; China; Japan; India; South Korea; Australia; Brazil; KSA; UAE; South Africa. |
Key companies profiled |
BDP International; Burris Logistics; C.H. Robinson Worldwide, Inc.; CEVA Logistics; DSV; DB Schenker Logistics; FedEx; J.B. Hunt Transport, Inc.; Kuehne + Nagel; Nippon Express; United Parcel Service of America, Inc.; XPO Logistics, Inc; Yusen Logistics Co. Ltd. |
Customization scope |
Free report customization (equivalent up to 8 analysts working days) with purchase. Addition or alteration to country, regional & segment scope. |
Pricing and purchase options |
Avail customized purchase options to meet your exact research needs. Explore purchase options |
This report forecasts revenue growth at global, regional, and country levels and provides an analysis of the latest industry trends in each of the sub-segments from 2017 to 2030. For this study, Grand View Research has segmented the global third-party logistics market report based on service, transport, end-use, and region:
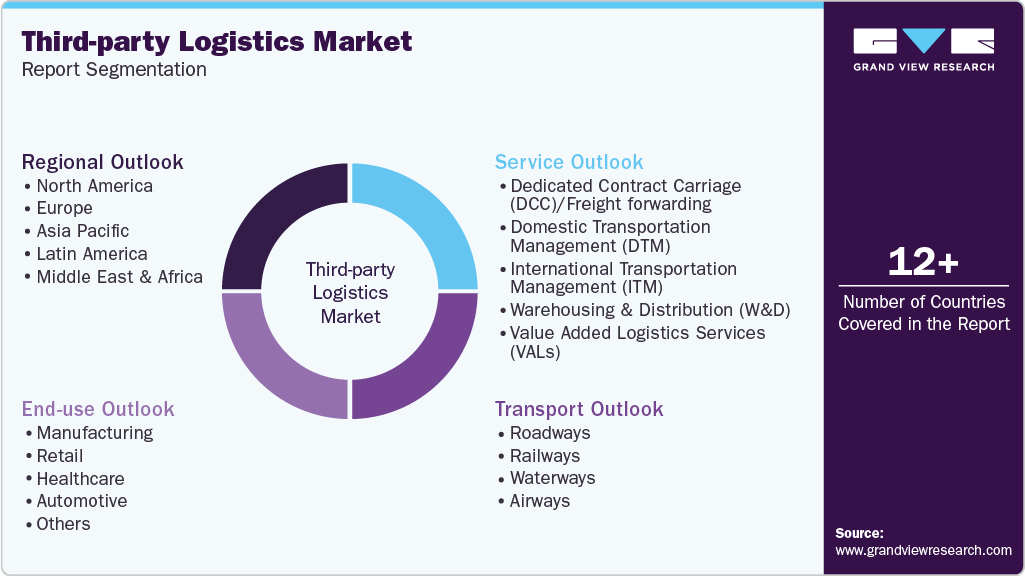
Service Outlook (Revenue, USD Billion, 2017 - 2030)
Dedicated Contract Carriage (DCC)/Freight forwarding
Domestic Transportation Management (DTM)
International Transportation Management (ITM)
Warehousing &Distribution (W&D)
Value Added Logistics Services (VALs)
Transport Outlook (Revenue, USD Billion, 2017 - 2030)
Roadways
Railways
Waterways
Airways
End-use Outlook (Revenue, USD Billion, 2017 - 2030)
Manufacturing
Retail
Healthcare
Automotive
Others
Regional Outlook (Revenue, USD Billion, 2017 - 2030)
North America
U.S.
Canada
Europe
Germany
U.K.
France
Asia Pacific
China
India
Japan
South Korea
Australia
Latin America
Brazil
Middle East & Africa
KSA
UAE
South Africa
b. The global third-party logistics market size was estimated at USD 1,095.85 billion in 2023 and is expected to reach USD 1,174.54 billion in 2024.
b. The Asia Pacific region accounted for the maximum revenue share in 2023 and is expected to emerge as the fastest-growing regional market from 2024 to 2030.
b. Some of the key players in the global 3PL market include Deutsche Post AG (DHL Group); Kuehne + Nagel; C.H. Robinson Worldwide, Inc.; United Parcel Service of America, Inc.; and FedEx.
b. The global third-party logistics market is expected to grow at a compound annual growth rate of 8.1% from 2024 to 2030, reaching USD 1,877.51 billion by 2030.
b. The development of logistics infrastructure in the Asia Pacific region and the Middle East, the rapid growth of the global e-commerce sector, and the development of new technologies are expected to significantly contribute to the 3PL market growth.
Table of Contents
Chapter 1. Methodology and Scope
1.1. Market Segmentation and Scope
1.2. Market Definitions
1.3. Research Methodology
1.3.1. Information Procurement
1.3.2. Information or Data Analysis
1.3.3. Market Formulation & Data Visualization
1.3.4. Data Validation & Publishing
1.4. Research Scope and Assumptions
1.4.1. List of Data Sources
Chapter 2. Executive Summary
2.1. Market Outlook
2.2. Segment Outlook
2.3. Competitive Insights
Chapter 3. Third-Party Logistics Market Variables, Trends, & Scope
3.1. Market Introduction/Lineage Outlook
3.2. Industry Value Chain Analysis
3.3. Market Dynamics
3.3.1. Market Drivers Analysis
3.3.1.1. The rise of E-commerce
3.3.1.2. Reducing shipping cost through 3PL
3.3.1.3. The strategic impact of multimodal transport on the 3PL market
3.3.2. Market Restraints Analysis
3.3.2.1. Economic Downturn
3.3.3. Industry Opportunities
3.3.3.1. Integration of Artificial Intelligence, Machine Learning, and Robotics
3.3.4. Industry Challenges
3.4. Third-Party Logistics Market Analysis Tools
3.4.1. Porter’s Analysis
3.4.1.1. Bargaining power of the suppliers
3.4.1.2. Bargaining power of the buyers
3.4.1.3. Threats of substitution
3.4.1.4. Threats from new entrants
3.4.1.5. Competitive rivalry
3.4.2. PESTEL Analysis
3.4.2.1. Political landscape
3.4.2.2. Economic and Social landscape
3.4.2.3. Technological landscape
3.4.2.4. Environmental landscape
3.4.2.5. Legal landscape
Chapter 4. Third-Party Logistics Market: Service Estimates & Trend Analysis
4.1. Segment Dashboard
4.2. Third-Party Logistics Market: Service Movement Analysis, USD Billion, 2023 & 2030
4.3. Dedicated Contract Carriage (DCC)/Freight forwarding
4.3.1. Dedicated Contract Carriage (DCC)/Freight forwarding Market Revenue Estimates and Forecasts, 2017 - 2030 (USD Billion)
4.4. Domestic Transportation Management (DTM)
4.4.1. Domestic Transportation Management (DTM) Market Revenue Estimates and Forecasts, 2017 - 2030 (USD Billion)
4.5. International Transportation Management (ITM)
4.5.1. International Transportation Management (ITM) Market Revenue Estimates and Forecasts, 2017 - 2030 (USD Billion)
4.6. Warehousing & Distribution (W&D)
4.6.1. Warehousing & Distribution (W&D) Market Revenue Estimates and Forecasts, 2017 - 2030 (USD Billion)
4.7. Value Added Logistics Services (VALs)
4.7.1. Value Added Logistics Services (VALs) Market Revenue Estimates and Forecasts, 2017 - 2030 (USD Billion)
Chapter 5. Third-Party Logistics Market: Transport Estimates & Trend Analysis
5.1. Segment Dashboard
5.2. Third-Party Logistics Market: Transport Movement Analysis, USD Billion, 2023 & 2030
5.3. Roadways
5.3.1. Roadways Market Revenue Estimates and Forecasts, 2017 - 2030 (USD Billion)
5.4. Railways
5.4.1. Railways Market Revenue Estimates and Forecasts, 2017 - 2030 (USD Billion)
5.5. Waterways
5.5.1. Waterways Market Revenue Estimates and Forecasts, 2017 - 2030 (USD Billion)
5.6. Airways
5.6.1. Airways Market Revenue Estimates and Forecasts, 2017 - 2030 (USD Billion)
Chapter 6. Third-Party Logistics Market: End-Use Estimates & Trend Analysis
6.1. Segment Dashboard
6.2. Third-Party Logistics Market: End-Use Movement Analysis, USD Billion, 2023 & 2030
6.3. Manufacturing
6.3.1. Manufacturing Market Revenue Estimates and Forecasts, 2017 - 2030 (USD Billion)
6.4. Retail
6.4.1. Retail Market Revenue Estimates and Forecasts, 2017 - 2030 (USD Billion)
6.5. Healthcare
6.5.1. Healthcare Market Revenue Estimates and Forecasts, 2017 - 2030 (USD Billion)
6.6. Automotive
6.6.1. Automotive Market Revenue Estimates and Forecasts, 2017 - 2030 (USD Billion)
6.7. Others
6.7.1. Others Market Revenue Estimates and Forecasts, 2017 - 2030 (USD Billion)
Chapter 7. Third-Party Logistics Market: Regional Estimates & Trend Analysis
7.1. Third-Party Logistics Market Share, By Region, 2023 & 2030, USD Billion
7.2. North America
7.2.1. North America Third-Party Logistics Market Estimates and Forecasts, 2017 - 2030 (USD Billion)
7.2.2. North America Third-Party Logistics Market Estimates and Forecasts, by Service, 2017 - 2030 (USD Billion)
7.2.3. North America Third-Party Logistics Market Estimates and Forecasts, by Transport, 2017 - 2030 (USD Billion)
7.2.4. North America Third-Party Logistics Market Estimates and Forecasts, By End-Use, 2017 - 2030 (USD Billion)
7.2.5. U.S.
7.2.5.1. U.S. Third-Party Logistics Market Estimates and Forecasts, 2017 - 2030 (USD Billion)
7.2.5.2. U.S. Third-Party Logistics Market Estimates and Forecasts, by Service, 2017 - 2030 (USD Billion)
7.2.5.3. U.S. Third-Party Logistics Market Estimates and Forecasts, by Transport, 2017 - 2030 (USD Billion)
7.2.5.4. U.S. Third-Party Logistics Market Estimates and Forecasts, By End-Use, 2017 - 2030 (USD Billion)
7.2.6. Canada
7.2.6.1. Canada Third-Party Logistics Market Estimates and Forecasts, 2017 - 2030 (USD Billion)
7.2.6.2. Canada Third-Party Logistics Market Estimates and Forecasts, by Service, 2017 - 2030 (USD Billion)
7.2.6.3. Canada Third-Party Logistics Market Estimates and Forecasts, by Transport, 2017 - 2030 (USD Billion)
7.2.6.4. Canada Third-Party Logistics Market Estimates and Forecasts, By End-Use, 2017 - 2030 (USD Billion)
7.2.7. Mexico
7.2.7.1. Mexico Third-Party Logistics Market Estimates and Forecasts, 2017 - 2030 (USD Billion)
7.2.7.2. Mexico Third-Party Logistics Market Estimates and Forecasts, by Service, 2017 - 2030 (USD Billion)
7.2.7.3. Mexico Third-Party Logistics Market Estimates and Forecasts, by Transport, 2017 - 2030 (USD Billion)
7.2.7.4. Mexico Third-Party Logistics Market Estimates and Forecasts, By End-Use, 2017 - 2030 (USD Billion)
7.3. Europe
7.3.1. Europe Third-Party Logistics Market Estimates and Forecasts, 2017 - 2030 (USD Billion)
7.3.2. Europe Third-Party Logistics Market Estimates and Forecasts, by Service, 2017 - 2030 (USD Billion)
7.3.3. Europe Third-Party Logistics Market Estimates and Forecasts, by Transport, 2017 - 2030 (USD Billion)
7.3.4. Europe Third-Party Logistics Market Estimates and Forecasts, By End-Use, 2017 - 2030 (USD Billion)
7.3.5. UK
7.3.5.1. UK Third-Party Logistics Market Estimates and Forecasts, 2017 - 2030 (USD Billion)
7.3.5.2. UK Third-Party Logistics Market Estimates and Forecasts, by Service, 2017 - 2030 (USD Billion)
7.3.5.3. UK Third-Party Logistics Market Estimates and Forecasts, by Transport, 2017 - 2030 (USD Billion)
7.3.5.4. UK Third-Party Logistics Market Estimates and Forecasts, By End-Use, 2017 - 2030 (USD Billion)
7.3.6. Germany
7.3.6.1. Germany Third-Party Logistics Market Estimates and Forecasts, 2017 - 2030 (USD Billion)
7.3.6.2. Germany Third-Party Logistics Market Estimates and Forecasts, by Service, 2017 - 2030 (USD Billion)
7.3.6.3. Germany Third-Party Logistics Market Estimates and Forecasts, by Transport, 2017 - 2030 (USD Billion)
7.3.6.4. Germany Third-Party Logistics Market Estimates and Forecasts, By End-Use, 2017 - 2030 (USD Billion)
7.3.7. France
7.3.7.1. France Third-Party Logistics Market Estimates and Forecasts, 2017 - 2030 (USD Billion)
7.3.7.2. France Third-Party Logistics Market Estimates and Forecasts, by Service, 2017 - 2030 (USD Billion)
7.3.7.3. France Third-Party Logistics Market Estimates and Forecasts, by Transport, 2017 - 2030 (USD Billion)
7.3.7.4. France Third-Party Logistics Market Estimates and Forecasts, By End-Use, 2017 - 2030 (USD Billion)
7.4. Asia Pacific
7.4.1. Asia Pacific Third-Party Logistics Market Estimates and Forecasts, 2017 - 2030 (USD Billion)
7.4.2. Asia Pacific Third-Party Logistics Market Estimates and Forecasts, by Service, 2017 - 2030 (USD Billion)
7.4.3. Asia Pacific Third-Party Logistics Market Estimates and Forecasts, by Transport, 2017 - 2030 (USD Billion)
7.4.4. Asia Pacific Third-Party Logistics Market Estimates and Forecasts, By End-Use, 2017 - 2030 (USD Billion)
7.4.5. China
7.4.5.1. China Third-Party Logistics Market Estimates and Forecasts, 2017 - 2030 (USD Billion)
7.4.5.2. China Third-Party Logistics Market Estimates and Forecasts, by Service, 2017 - 2030 (USD Billion)
7.4.5.3. China Third-Party Logistics Market Estimates and Forecasts, by Transport, 2017 - 2030 (USD Billion)
7.4.5.4. China Third-Party Logistics Market Estimates and Forecasts, By End-Use, 2017 - 2030 (USD Billion)
7.4.6. Japan
7.4.6.1. Japan Third-Party Logistics Market Estimates and Forecasts, 2017 - 2030 (USD Billion)
7.4.6.2. Japan Third-Party Logistics Market Estimates and Forecasts, by Service, 2017 - 2030 (USD Billion)
7.4.6.3. Japan Third-Party Logistics Market Estimates and Forecasts, by Transport, 2017 - 2030 (USD Billion)
7.4.6.4. Japan Third-Party Logistics Market Estimates and Forecasts, By End-Use, 2017 - 2030 (USD Billion)
7.4.7. India
7.4.7.1. India Third-Party Logistics Market Estimates and Forecasts, 2017 - 2030 (USD Billion)
7.4.7.2. India Third-Party Logistics Market Estimates and Forecasts, by Service, 2017 - 2030 (USD Billion)
7.4.7.3. India Third-Party Logistics Market Estimates and Forecasts, by Transport, 2017 - 2030 (USD Billion)
7.4.7.4. India Third-Party Logistics Market Estimates and Forecasts, By End-Use, 2017 - 2030 (USD Billion)
7.4.8. South Korea
7.4.8.1. South Korea Third-Party Logistics Market Estimates and Forecasts, 2017 - 2030 (USD Billion)
7.4.8.2. South Korea Third-Party Logistics Market Estimates and Forecasts, by Service, 2017 - 2030 (USD Billion)
7.4.8.3. South Korea Third-Party Logistics Market Estimates and Forecasts, by Transport, 2017 - 2030 (USD Billion)
7.4.8.4. South Korea Third-Party Logistics Market Estimates and Forecasts, By End-Use, 2017 - 2030 (USD Billion)
7.4.9. Australia
7.4.9.1. Australia Third-Party Logistics Market Estimates and Forecasts, 2017 - 2030 (USD Billion)
7.4.9.2. Australia Third-Party Logistics Market Estimates and Forecasts, by Service, 2017 - 2030 (USD Billion)
7.4.9.3. Australia Third-Party Logistics Market Estimates and Forecasts, by Transport, 2017 - 2030 (USD Billion)
7.4.9.4. Australia Third-Party Logistics Market Estimates and Forecasts, By End-Use, 2017 - 2030 (USD Billion)
7.5. South America
7.5.1. South America Third-Party Logistics Market Estimates and Forecasts, 2017 - 2030 (USD Billion)
7.5.2. South America Third-Party Logistics Market Estimates and Forecasts, by Service, 2017 - 2030 (USD Billion)
7.5.3. South America Third-Party Logistics Market Estimates and Forecasts, by Transport, 2017 - 2030 (USD Billion)
7.5.4. South America Third-Party Logistics Market Estimates and Forecasts, By End-Use, 2017 - 2030 (USD Billion)
7.5.5. Brazil
7.5.5.1. Brazil Third-Party Logistics Market Estimates and Forecasts, 2017 - 2030 (USD Billion)
7.5.5.2. Brazil Third-Party Logistics Market Estimates and Forecasts, by Service, 2017 - 2030 (USD Billion)
7.5.5.3. Brazil Third-Party Logistics Market Estimates and Forecasts, by Transport, 2017 - 2030 (USD Billion)
7.5.5.4. Brazil Third-Party Logistics Market Estimates and Forecasts, By End-Use, 2017 - 2030 (USD Billion)
7.6. Middle East and Africa
7.6.1. Middle East and Africa Third-Party Logistics Market Estimates and Forecasts, 2017 - 2030 (USD Billion)
7.6.2. Middle East and Africa Third-Party Logistics Market Estimates and Forecasts, by Service, 2017 - 2030 (USD Billion)
7.6.3. Middle East and Africa Third-Party Logistics Market Estimates and Forecasts, by Transport, 2017 - 2030 (USD Billion)
7.6.4. Middle East and Africa Third-Party Logistics Market Estimates and Forecasts, By End-Use, 2017 - 2030 (USD Billion)
7.6.5. Kingdom of Saudi Arabia (KSA)
7.6.5.1. Kingdom of Saudi Arabia (KSA)Third-Party Logistics Market Estimates and Forecasts, 2017 - 2030 (USD Billion)
7.6.5.2. Kingdom of Saudi Arabia (KSA)Third-Party Logistics Market Estimates and Forecasts, by Service, 2017 - 2030 (USD Billion)
7.6.5.3. Kingdom of Saudi Arabia (KSA)Third-Party Logistics Market Estimates and Forecasts, by Transport, 2017 - 2030 (USD Billion)
7.6.5.4. Kingdom of Saudi Arabia (KSA)Third-Party Logistics Market Estimates and Forecasts, By End-Use, 2017 - 2030 (USD Billion)
7.6.6. UAE
7.6.6.1. UAE Third-Party Logistics Market Estimates and Forecasts, 2017 - 2030 (USD Billion)
7.6.6.2. UAE Third-Party Logistics Market Estimates and Forecasts, by Service, 2017 - 2030 (USD Billion)
7.6.6.3. UAE Third-Party Logistics Market Estimates and Forecasts, by Transport, 2017 - 2030 (USD Billion)
7.6.6.4. UAE Third-Party Logistics Market Estimates and Forecasts, By End-Use, 2017 - 2030 (USD Billion)
7.6.7. South Africa
7.6.7.1. South Africa Third-Party Logistics Market Estimates and Forecasts, 2017 - 2030 (USD Billion)
7.6.7.2. South Africa Third-Party Logistics Market Estimates and Forecasts, by Service, 2017 - 2030 (USD Billion)
7.6.7.3. South Africa Third-Party Logistics Market Estimates and Forecasts, by Transport, 2017 - 2030 (USD Billion)
7.6.7.4. South Africa Third-Party Logistics Market Estimates and Forecasts, By End-Use, 2017 - 2030 (USD Billion)
Chapter 8. Competitive Landscape
8.1. Recent Developments & Impact Analysis by Key Market Participants
8.2. Company Categorization
8.3. Company Market Positioning
8.4. Company Market Share Analysis
8.5. Strategy Mapping
8.5.1. Expansion
8.5.2. Mergers & Acquisition
8.5.3. Partnerships & Collaborations
8.5.4. New Product Launches
8.5.5. Research And Development
8.6. Company Profiles
8.6.1. BDP International
8.6.1.1. Participant’s Overview
8.6.1.2. Financial Performance
8.6.1.3. Product Benchmarking
8.6.1.4. Recent Developments
8.6.2. Burris Logistics
8.6.2.1. Participant’s Overview
8.6.2.2. Financial Performance
8.6.2.3. Product Benchmarking
8.6.2.4. Recent Developments
8.6.3. C.H. Robinson Worldwide, Inc.
8.6.3.1. Participant’s Overview
8.6.3.2. Financial Performance
8.6.3.3. Product Benchmarking
8.6.3.4. Recent Developments
8.6.4. CEVA Logistics
8.6.4.1. Participant’s Overview
8.6.4.2. Financial Performance
8.6.4.3. Product Benchmarking
8.6.4.4. Recent Developments
8.6.5. DSV
8.6.5.1. Participant’s Overview
8.6.5.2. Financial Performance
8.6.5.3. Product Benchmarking
8.6.5.4. Recent Developments
8.6.6. DB Schenker Logistics
8.6.6.1. Participant’s Overview
8.6.6.2. Financial Performance
8.6.6.3. Product Benchmarking
8.6.6.4. Recent Developments
8.6.7. FedEx
8.6.7.1. Participant’s Overview
8.6.7.2. Financial Performance
8.6.7.3. Product Benchmarking
8.6.7.4. Recent Developments
8.6.8. J.B. Hunt Transport, Inc.
8.6.8.1. Participant’s Overview
8.6.8.2. Financial Performance
8.6.8.3. Product Benchmarking
8.6.8.4. Recent Developments
8.6.9. Kuehne + Nagel
8.6.9.1. Participant’s Overview
8.6.9.2. Financial Performance
8.6.9.3. Product Benchmarking
8.6.9.4. Recent Developments
8.6.10. Nippon Express
8.6.10.1. Participant’s Overview
8.6.10.2. Financial Performance
8.6.10.3. Product Benchmarking
8.6.10.4. Recent Developments
8.6.11. United Parcel Service of America, Inc.
8.6.11.1. Participant’s Overview
8.6.11.2. Financial Performance
8.6.11.3. Product Benchmarking
8.6.11.4. Recent Developments
8.6.12. XPO Logistics, Inc
8.6.12.1. Participant’s Overview
8.6.12.2. Financial Performance
8.6.12.3. Product Benchmarking
8.6.12.4. Recent Developments
8.6.13. Yusen Logistics Co. Ltd.
8.6.13.1. Participant’s Overview
8.6.13.2. Financial Performance
8.6.13.3. Product Benchmarking
8.6.13.4. Recent Developments
List of Tables
Table 1 List of Abrevation
Table 2 Global Third-Party Logistics Market revenue estimates and forecast, by Service, 2017 - 2030 (USD Billion)
Table 3 Global Third-Party Logistics Market revenue estimates and forecast, by Transport, 2017 - 2030 (USD Billion)
Table 4 Global Third-Party Logistics Market revenue estimates and forecast, By End-Use, 2017 - 2030 (USD Billion)
Table 5 Global Third-Party Logistics Market revenue, by Region, 2023 & 2030 (USD Billion)
Table 6 North America Third-Party Logistics Market estimates & forecasts, 2017 - 2030 (USD Billion)
Table 7 North America Third-Party Logistics Market estimates & forecasts, by service, 2017 - 2030 (USD Billion)
Table 8 North America Third-Party Logistics Market estimates & forecasts, by transport, 2017 - 2030 (USD Billion)
Table 9 North America Third-Party Logistics Market estimates & forecasts, by end-use, 2017 - 2030 (USD Billion)
Table 10 U.S. Third-Party Logistics Market estimates & forecasts, 2017 - 2030 (USD Billion)
Table 11 U.S. Third-Party Logistics Market estimates & forecasts, by service, 2017 - 2030 (USD Billion)
Table 12 U.S. Third-Party Logistics Market estimates & forecasts, by transport, 2017 - 2030 (USD Billion)
Table 13 U.S. Third-Party Logistics Market estimates & forecasts, by end-use, 2017 - 2030 (USD Billion)
Table 14 Canada Third-Party Logistics Market estimates & forecasts, 2017 - 2030 (USD Billion)
Table 15 Canada Third-Party Logistics Market estimates & forecasts, by service, 2017 - 2030 (USD Billion)
Table 16 Canada Third-Party Logistics Market estimates & forecasts, by transport, 2017 - 2030 (USD Billion)
Table 17 Canada Third-Party Logistics Market estimates & forecasts, by end-use, 2017 - 2030 (USD Billion)
Table 18 Mexico Third-Party Logistics Market estimates & forecasts, 2017 - 2030 (USD Billion)
Table 19 Mexico Third-Party Logistics Market estimates & forecasts, by service, 2017 - 2030 (USD Billion)
Table 20 Mexico Third-Party Logistics Market estimates & forecasts, by transport, 2017 - 2030 (USD Billion)
Table 21 Mexico Third-Party Logistics Market estimates & forecasts, by end-use, 2017 - 2030 (USD Billion)
Table 22 Europe Third-Party Logistics Market estimates & forecasts, 2017 - 2030 (USD Billion)
Table 23 Europe Third-Party Logistics Market estimates & forecasts, by service, 2017 - 2030 (USD Billion)
Table 24 Europe Third-Party Logistics Market estimates & forecasts, by transport, 2017 - 2030 (USD Billion)
Table 25 Europe Third-Party Logistics Market estimates & forecasts, by end-use, 2017 - 2030 (USD Billion)
Table 26 UK Third-Party Logistics Market estimates & forecasts, 2017 - 2030 (USD Billion)
Table 27 UK Third-Party Logistics Market estimates & forecasts, by service, 2017 - 2030 (USD Billion)
Table 28 UK Third-Party Logistics Market estimates & forecasts, by transport, 2017 - 2030 (USD Billion)
Table 29 UK Third-Party Logistics Market estimates & forecasts, by end-use, 2017 - 2030 (USD Billion)
Table 30 Germany Third-Party Logistics Market estimates & forecasts, 2017 - 2030 (USD Billion)
Table 31 Germany Third-Party Logistics Market estimates & forecasts, by service, 2017 - 2030 (USD Billion)
Table 32 Germany Third-Party Logistics Market estimates & forecasts, by transport, 2017 - 2030 (USD Billion)
Table 33 Germany Third-Party Logistics Market estimates & forecasts, by end-use, 2017 - 2030 (USD Billion)
Table 34 France Third-Party Logistics Market estimates & forecasts, 2017 - 2030 (USD Billion)
Table 35 France Third-Party Logistics Market estimates & forecasts, by service, 2017 - 2030 (USD Billion)
Table 36 France Third-Party Logistics Market estimates & forecasts, by transport, 2017 - 2030 (USD Billion)
Table 37 France Third-Party Logistics Market estimates & forecasts, by end-use, 2017 - 2030 (USD Billion)
Table 38 Asia Pacific Third-Party Logistics Market estimates & forecasts, 2017 - 2030 (USD Billion)
Table 39 Asia Pacific Third-Party Logistics Market estimates & forecasts, by service, 2017 - 2030 (USD Billion)
Table 40 Asia Pacific Third-Party Logistics Market estimates & forecasts, by transport, 2017 - 2030 (USD Billion)
Table 41 Asia Pacific Third-Party Logistics Market estimates & forecasts, by end-use, 2017 - 2030 (USD Billion)
Table 42 China Third-Party Logistics Market estimates & forecasts, 2017 - 2030 (USD Billion)
Table 43 China Third-Party Logistics Market estimates & forecasts, by service, 2017 - 2030 (USD Billion)
Table 44 China Third-Party Logistics Market estimates & forecasts, by transport, 2017 - 2030 (USD Billion)
Table 45 China Third-Party Logistics Market estimates & forecasts, by end-use, 2017 - 2030 (USD Billion)
Table 46 India Third-Party Logistics Market estimates & forecasts, 2017 - 2030 (USD Billion)
Table 47 India Third-Party Logistics Market estimates & forecasts, by service, 2017 - 2030 (USD Billion)
Table 48 India Third-Party Logistics Market estimates & forecasts, by transport, 2017 - 2030 (USD Billion)
Table 49 India Third-Party Logistics Market estimates & forecasts, by end-use, 2017 - 2030 (USD Billion)
Table 50 Japan Third-Party Logistics Market estimates & forecasts, 2017 - 2030 (USD Billion)
Table 51 Japan Third-Party Logistics Market estimates & forecasts, by service, 2017 - 2030 (USD Billion)
Table 52 Japan Third-Party Logistics Market estimates & forecasts, by transport, 2017 - 2030 (USD Billion)
Table 53 Japan Third-Party Logistics Market estimates & forecasts, by end-use, 2017 - 2030 (USD Billion)
Table 54 South Korea Third-Party Logistics Market estimates & forecasts, 2017 - 2030 (USD Billion)
Table 55 South Korea Third-Party Logistics Market estimates & forecasts, by service, 2017 - 2030 (USD Billion)
Table 56 South Korea Third-Party Logistics Market estimates & forecasts, by transport, 2017 - 2030 (USD Billion)
Table 57 South Korea Third-Party Logistics Market estimates & forecasts, by end-use, 2017 - 2030 (USD Billion)
Table 58 Australia Third-Party Logistics Market estimates & forecasts, 2017 - 2030 (USD Billion)
Table 59 Australia Third-Party Logistics Market estimates & forecasts, by service, 2017 - 2030 (USD Billion)
Table 60 Australia Third-Party Logistics Market estimates & forecasts, by transport, 2017 - 2030 (USD Billion)
Table 61 Australia Third-Party Logistics Market estimates & forecasts, by end-use, 2017 - 2030 (USD Billion)
Table 62 South America Third-Party Logistics Market estimates & forecasts, 2017 - 2030 (USD Billion)
Table 63 South America Third-Party Logistics Market estimates & forecasts, by service, 2017 - 2030 (USD Billion)
Table 64 South America Third-Party Logistics Market estimates & forecasts, by transport, 2017 - 2030 (USD Billion)
Table 65 South America Third-Party Logistics Market estimates & forecasts, by end-use, 2017 - 2030 (USD Billion)
Table 66 Brazil Third-Party Logistics Market estimates & forecasts, 2017 - 2030 (USD Billion)
Table 67 Brazil Third-Party Logistics Market estimates & forecasts, by service, 2017 - 2030 (USD Billion)
Table 68 Brazil Third-Party Logistics Market estimates & forecasts, by transport, 2017 - 2030 (USD Billion)
Table 69 Brazil Third-Party Logistics Market estimates & forecasts, by end-use, 2017 - 2030 (USD Billion)
Table 70 Middle East & Africa Third-Party Logistics Market estimates & forecasts, 2017 - 2030 (USD Billion)
Table 71 Middle East & Africa Third-Party Logistics Market estimates & forecasts, by service, 2017 - 2030 (USD Billion)
Table 72 Middle East & Africa Third-Party Logistics Market estimates & forecasts, by transport, 2017 - 2030 (USD Billion)
Table 73 Middle East & Africa Third-Party Logistics Market estimates & forecasts, by end-use, 2017 - 2030 (USD Billion)
Table 74 KSA Third-Party Logistics Market estimates & forecasts, 2017 - 2030 (USD Billion)
Table 75 KSA Third-Party Logistics Market estimates & forecasts, by service, 2017 - 2030 (USD Billion)
Table 76 KSA Third-Party Logistics Market estimates & forecasts, by transport, 2017 - 2030 (USD Billion)
Table 77 KSA Third-Party Logistics Market estimates & forecasts, by end-use, 2017 - 2030 (USD Billion)
Table 78 UAE Third-Party Logistics Market estimates & forecasts, 2017 - 2030 (USD Billion)
Table 79 UAE Third-Party Logistics Market estimates & forecasts, by service, 2017 - 2030 (USD Billion)
Table 80 UAE Third-Party Logistics Market estimates & forecasts, by transport, 2017 - 2030 (USD Billion)
Table 81 UAE Third-Party Logistics Market estimates & forecasts, by end-use, 2017 - 2030 (USD Billion)
Table 82 South Africa Third-Party Logistics Market estimates & forecasts, 2017 - 2030 (USD Billion)
Table 83 South Africa Third-Party Logistics Market estimates & forecasts, by service, 2017 - 2030 (USD Billion)
Table 84 South Africa Third-Party Logistics Market estimates & forecasts, by transport, 2017 - 2030 (USD Billion)
Table 85 South Africa Third-Party Logistics Market estimates & forecasts, by end-use, 2017 - 2030 (USD Billion)
Table 86 Participant’s Overview
Table 87 Financial Performance
Table 88 Product Benchmarking
Table 89 Key companies undergoing expansion
Table 90 Key companies involved in mergers & acquisitions
Table 91 Key companies undertaking partnerships and collaboration
Table 92 Key companies launching new product/service launches
List of Figures
Fig. 1 Third-Party Logistics Market segmentation
Fig. 2 Information procurement
Fig. 3 Data analysis models
Fig. 4 Market formulation and validation
Fig. 5 Data validating & publishing
Fig. 6 Market snapshot
Fig. 7 Segment snapshot, by Service and Transport
Fig. 8 Segment snapshot By End-Use
Fig. 9 Competitive landscape snapshot
Fig. 10 Third-Party Logistics Market value, 2017 - 2030 (USD Billion)
Fig. 11 Third-Party Logistics Market - Industry value chain analysis
Fig. 12 Third-Party Logistics Market - Market trends
Fig. 13 Third-Party Logistics Market: Porter’s analysis
Fig. 14 Third-Party Logistics Market: PESTEL analysis
Fig. 15 Third-Party Logistics Market, by Service: Key takeaways
Fig. 16 Third-Party Logistics Market, by Service: Market share, 2023 & 2030
Fig. 17 Dedicated Contract Carriage (DCC)/Freight forwarding Third-Party Logistics Market estimates & forecasts, 2017 - 2030 (USD Billion)
Fig. 18 Domestic Transportation Management (DTM) Third-Party Logistics Market estimates & forecasts, 2017 - 2030 (USD Billion)
Fig. 19 International Transportation Management (ITM) Third-Party Logistics Market estimates & forecasts, 2017 - 2030 (USD Billion)
Fig. 20 Warehousing & Distribution (W&D) Third-Party Logistics Market estimates & forecasts, 2017 - 2030 (USD Billion)
Fig. 21 Value Added Logistics Services (VALs) Third-Party Logistics Market estimates & forecasts, 2017 - 2030 (USD Billion)
Fig. 22 Third-Party Logistics Market, by Transport: Key takeaways
Fig. 23 Third-Party Logistics Market, by Transport: Market share, 2023 & 2030
Fig. 24 Roadways Third-Party Logistics Market estimates & forecasts, 2017 - 2030 (USD Billion)
Fig. 25 Railways Third-Party Logistics Market estimates & forecasts, 2017 - 2030 (USD Billion)
Fig. 26 Waterways Third-Party Logistics Market estimates & forecasts, 2017 - 2030 (USD Billion)
Fig. 27 Airways Third-Party Logistics Market estimates & forecasts, 2017 - 2030 (USD Billion)
Fig. 28 Third-Party Logistics Market, By End-Use: Key takeaways
Fig. 29 Third-Party Logistics Market, By End-Use: Market share, 2023 & 2030
Fig. 30 Manufacturing Third-Party Logistics Market estimates & forecasts, 2017 - 2030 (USD Billion)
Fig. 31 Retail Third-Party Logistics Market estimates & forecasts, 2017 - 2030 (USD Billion)
Fig. 32 Healthcare Third-Party Logistics Market estimates & forecasts, 2017 - 2030 (USD Billion)
Fig. 33 Automotive Third-Party Logistics Market estimates & forecasts, 2017 - 2030 (USD Billion)
Fig. 34 Others Third-Party Logistics Market estimates & forecasts, 2017 - 2030 (USD Billion)
Fig. 35 Global Third-Party Logistics Market revenue, by Region, 2023 & 2030 (USD Billion)
Fig. 36 North America Third-Party Logistics Market estimates & forecasts, 2017 - 2030 (USD Billion)
Fig. 37 U.S. Third-Party Logistics Market estimates & forecasts, 2017 - 2030 (USD Billion)
Fig. 38 Canada Third-Party Logistics Market estimates & forecasts, 2017 - 2030 (USD Billion)
Fig. 39 Mexico Third-Party Logistics Market estimates & forecasts, 2017 - 2030 (USD Billion)
Fig. 40 Europe Third-Party Logistics Market estimates & forecasts, 2017 - 2030 (USD Billion)
Fig. 41 UK Third-Party Logistics Market estimates & forecasts, 2017 - 2030 (USD Billion)
Fig. 42 Germany Third-Party Logistics Market estimates & forecasts, 2017 - 2030 (USD Billion)
Fig. 43 France Third-Party Logistics Market estimates & forecasts, 2017 - 2030 (USD Billion)
Fig. 44 Asia Pacific Third-Party Logistics Market estimates & forecasts, 2017 - 2030 (USD Billion)
Fig. 45 China Third-Party Logistics Market estimates & forecasts, 2017 - 2030 (USD Billion)
Fig. 46 India Third-Party Logistics Market estimates & forecasts, 2017 - 2030 (USD Billion)
Fig. 47 Japan Third-Party Logistics Market estimates & forecasts, 2017 - 2030 (USD Billion)
Fig. 48 Australia Third-Party Logistics Market estimates & forecasts, 2017 - 2030 (USD Billion)
Fig. 49 South America Third-Party Logistics Market estimates & forecasts, 2017 - 2030 (USD Billion)
Fig. 50 Brazil Third-Party Logistics Market estimates & forecasts, 2017 - 2030 (USD Billion)
Fig. 51 Middle East & Africa Third-Party Logistics Market estimates & forecasts, 2017 - 2030 (USD Billion)
Fig. 52 KSA Third-Party Logistics Market estimates & forecasts, 2017 - 2030 (USD Billion)
Fig. 53 UAE Third-Party Logistics Market estimates & forecasts, 2017 - 2030 (USD Billion)
Fig. 54 South Africa Third-Party Logistics Market estimates & forecasts, 2017 - 2030 (USD Billion)
Fig. 55 Key company categorization
Fig. 56 Third-Party Logistics Market - Key company market share analysis, 2023
Fig. 57 Strategic framework
Market Segmentation
Catering the services of a Third-Party Logistics provider allows the business to focus on its core activities such as R&D, manufacturing, and strategic planning, thereby, relieving it of the day-to-day burden of operational logistics issues. Outsourcing product fulfillment operations to a Third-Party Logistics provider provides all the benefits of an entire logistics set-up including warehousing, order processing equipment, and computer and software systems - without fixed overheads. Firms with limited in-house resources, to handle logistics, can economically manage high order volumes by outsourcing their logistics.
Catering the services of Third-Party Logistics vendors also prevents companies from taking recourse and splitting their in-house operations into several in-house sites, which may not be economical, resulting in Third-Party Logistics vendors using the latest IT software and applications that enhance the distribution coverage and provide quality services to the customers. Omni-channel distribution has gained prominence over the last five years, primarily due to the increased use of online marketing. Third-Party Logistics providers assist their partners to promptly locate and deliver products to the consumers, irrespective of the channel, using their expertise.
Third-Party Logistics services greatly reduce the cost of shipping, especially, for companies that engage in bulk shipments regularly. With the increasing freight rates, shippers need opportunities to pull out costs involved in the supply chain. Third-Party Logistics providers steward progression in optimizing transportation costs by prescribing effective and prompt supply chain solutions. The growth of e-commerce and entrepreneurial ventures has stoked the demand for specialized logistics and supply chain execution capabilities. Shippers benefit from contracting Third-Party Logistics services through the reduction in logistics costs, inventory costs, and fixed costs. Globalization has resulted in the outsourcing of logistics functions by several companies due to their infeasibility to manage worldwide supply chain operations. Customers desire increased services and better visibility at the same costs. Technology plays a critical role in delivering key metrics and enhancing customer experiences. Third-Party Logisticss provide improved and innovative ways to optimize the effectiveness of logistics.
Sluggish economic growth, emphasis on costs and risk containment, and inconsistent freight volumes have adversely affected the global logistics market. The recent economic tumult has critically affected the landscape of Third-Party Logistics providers. Due to the economic decline, shippers concentrated their outsourcing requirements on a few close suppliers, resulting in several Third-Party Logisticss ceasing operations. Several economic factors influence the progress toward and maturity of the shipper-Third-Party Logistics relationships. The impact of the recession on the shipper-Third-Party Logistics relationship has led to scrutiny of costs along with choosing Third-Party Logistics partners. Many shippers are opting for contract bids with new providers and shortening their contract lengths to contain costs and leverage competition in the industry. Tepid economic activity has resulted in highly variable or neutral demand for outsourced logistics services. Thus, economic factors severely affect the profitability and future viability of Third-Party Logistics services, negatively influencing market growth.
The rise of e-commerce and digital phenomenon also called “The Amazon Effect”, has changed consumer expectations and buying behavior. End users are seeking unparalleled expectations in terms of convenience, cost, control, and choice. Omni-channel operation demands reliable, fast, and free shipping services, which has resulted in companies adopting a new business model to provide low-cost and on-demand delivery services. Third-Party Logistics companies embrace various modifications in supply chain management to address the notable transformations and challenges that e-commerce presents. Third-party logistics companies are shifting their focus from long-haul delivery to just-in-time delivery. The suppliers are also transitioning from multiple storage facilities to a single warehouse location. To accommodate an increase in last-mile delivery, Third-Party Logistics companies invest in smaller trucks and vans, which can support shorter and more frequent deliveries. In the coming years, last-mile delivery is presumed to be one of the key areas of focus for logistics companies.
This section will provide insights into the contents included in this third-party logistics market report and help gain clarity on the structure of the report to assist readers in navigating smoothly.
Industry overview
Industry trends
Market drivers and restraints
Market size
Growth prospects
Porter’s analysis
PESTEL analysis
Key market opportunities prioritized
Competitive landscape
Company overview
Financial performance
Product benchmarking
Latest strategic developments
Market size, estimates, and forecast from 2018 to 2030
Market estimates and forecast for product segments up to 2030
Regional market size and forecast for product segments up to 2030
Market estimates and forecast for application segments up to 2030
Regional market size and forecast for application segments up to 2030
Company financial performance
Research Methodology
Grand View Research employs a comprehensive and iterative research methodology focused on minimizing deviance in order to provide the most accurate estimates and forecast possible. The company utilizes a combination of bottom-up and top-down approaches for segmenting and estimating quantitative aspects of the market. In Addition, a recurring theme prevalent across all our research reports is data triangulation that looks market from three different perspectives. Critical elements of the methodology employed for all our studies include:
Preliminary data mining
Raw market data is obtained and collated on a broad front. Data is continuously filtered to ensure that only validated and authenticated sources are considered. In addition, data is also mined from a host of reports in our repository, as well as a number of reputed paid databases. For a comprehensive understanding of the market, it is essential to understand the complete value chain, and in order to facilitate this; we collect data from raw material suppliers, distributors as well as buyers.
Technical issues and trends are obtained from surveys, technical symposia, and trade journals. Technical data is also gathered from an intellectual property perspective, focusing on white space and freedom of movement. Industry dynamics with respect to drivers, restraints, pricing trends are also gathered. As a result, the material developed contains a wide range of original data that is then further cross-validated and authenticated with published sources.
Statistical model
Our market estimates and forecasts are derived through simulation models. A unique model is created customized for each study. Gathered information for market dynamics, technology landscape, application development, and pricing trends are fed into the model and analyzed simultaneously. These factors are studied on a comparative basis, and their impact over the forecast period is quantified with the help of correlation, regression, and time series analysis. Market forecasting is performed via a combination of economic tools, technological analysis, industry experience, and domain expertise.
Econometric models are generally used for short-term forecasting, while technological market models are used for long-term forecasting. These are based on an amalgamation of the technology landscape, regulatory frameworks, economic outlook, and business principles. A bottom-up approach to market estimation is preferred, with key regional markets analyzed as separate entities and integration of data to obtain global estimates. This is critical for a deep understanding of the industry as well as ensuring minimal errors. Some of the parameters considered for forecasting include:
• Market drivers and restraints, along with their current and expected impact
• Raw material scenario and supply v/s price trends
• Regulatory scenario and expected developments
• Current capacity and expected capacity additions up to 2030
We assign weights to these parameters and quantify their market impact using weighted average analysis, to derive an expected market growth rate.
Primary validation
This is the final step in estimating and forecasting for our reports. Exhaustive primary interviews are conducted, face to face as well as over the phone to validate our findings and assumptions used to obtain them. Interviewees are approached from leading companies across the value chain including suppliers, technology providers, domain experts, and buyers so as to ensure a holistic and unbiased picture of the market. These interviews are conducted across the globe, with language barriers overcome with the aid of local staff and interpreters. Primary interviews not only help in data validation but also provide critical insights into the market, current business scenario, and future expectations and enhance the quality of our reports. All our estimates and forecast are verified through exhaustive primary research with Key Industry Participants (KIPs) which typically include:
• Market-leading companies
• Raw material suppliers
• Product distributors
• Buyers
The key objectives of primary research are as follows:
• To validate our data in terms of accuracy and acceptability
• To gain an insight in to the current market and future expectations
Data Collection Matrix
Perspective |
Primary research |
Secondary research |
Supply-side |
|
|
Demand-side |
|
|
Industry Analysis Matrix
Qualitative analysis |
Quantitative analysis |
|
|
"The quality of research they have done for us has been excellent."