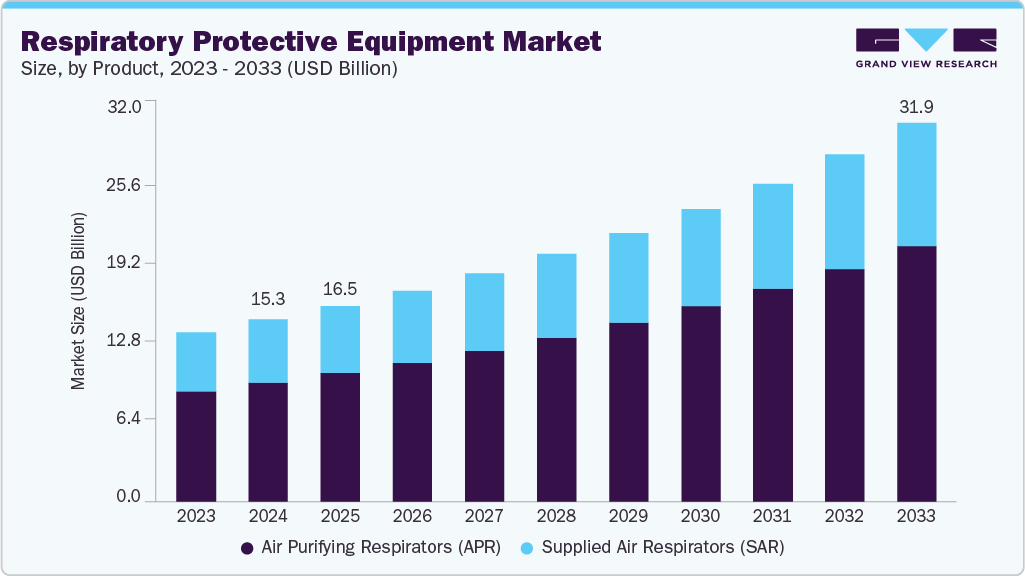
The global respiratory protective equipment market size was valued at USD 14.28 billion in 2023 and is projected to grow at a compound annual growth rate (CAGR) of 8.3% from 2024 to 2030. The growing awareness about worker safety and stringent government regulations are expected to have a positive impact on the industry's growth. The demand for disposable masks during the COVID-19 pandemic surged significantly, requiring manufacturers to boost their production capacity. Furthermore, supply chain interruptions resulted in a lack of raw materials, causing prices to skyrocket. EPR manufacturers also began producing revolutionary solutions to combat the pandemic, which boosted the industry's growth. Worker safety has gained prominence in various end-use industries along with sustainability.
Various organizations, such as OSHA, NIOSH, and EPA, in the U.S. have updated the regulations making them more stringent, compelling companies to provide PPE. This is expected to increase demand for RPE over the forecast period. N95 masks and surgical masks propelled the growth of the air-purifying respirators segment due to their widespread use by employees and workers across various sectors. An increase in employee safety training and focus on best safety practices are key factors likely to have a long-term impact on the respiratory protective equipment (RPE) industry.
Several governments have been focusing on infrastructure development through financial stimulus packages, which are expected to boost the construction industry worldwide. The growing infrastructure activities will likely bring up chronic respiratory diseases, such as chronic obstructive pulmonary disease (COPD), augmenting the demand for RPE. Manufacturing of RPE is highly capital-intensive owing to the high raw material costs and complex manufacturing methods. This has resulted in integration across the value chain by major raw material suppliers and functional material manufacturers to produce cost-efficient products and related accessories, discouraging new players and making the threat of new entrants low.
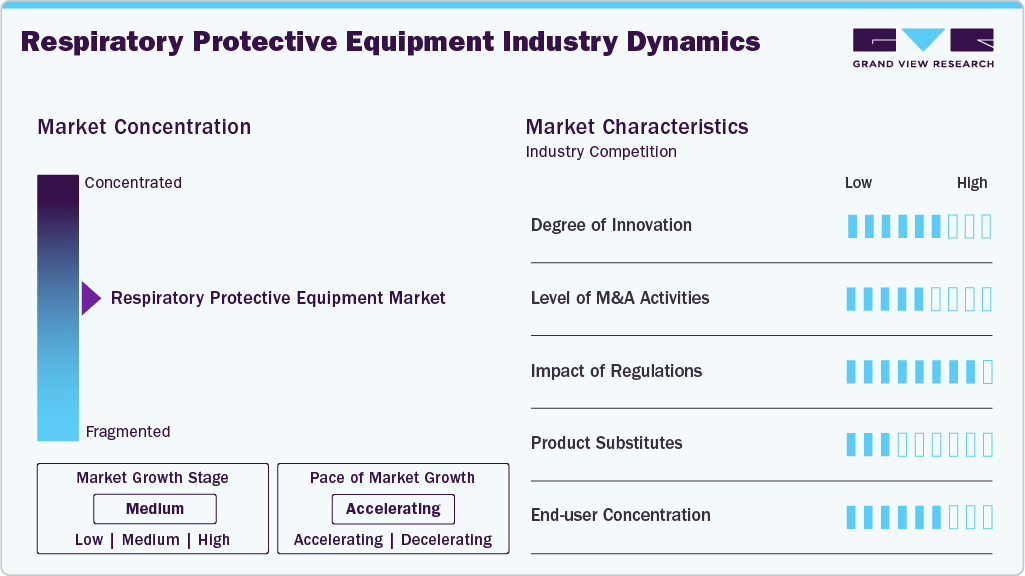
Market growth stage is medium, and pace of the market growth is accelerating. The respiratory protective equipment market is characterized by a high degree of competition owing to the various cost efficient technologies used for the manufacturing of respiratory protective equipment as well as benefits offered by these equipment. The market is fragmented due to presence of large number of manufacturers at the global level.
The respiratory protective devices market is also characterized by a high degree of product innovation which results in development of high quality respiratory protection. The demand for sustainable and environment friendly respiratory protection equipment is increasing, this trend is likely to increase research and development spending by various market players. Further, the air compressor market is also significantly influenced by the growing regulatory compliance across the globe.
The respiratory equipment market is moderately fragmented, with a few major players dominating the market and a large number of smaller companies competing in the space. Each of these products serves a distinct purpose and user group, attracting specialized manufacturers and distributors who cater to specific areas. This creates an advantage for smaller players alongside the giants, boosting innovation and catering to specific regional demands.
The COVID-19 pandemic had created significant growth opportunities in the disposable filtering half-masks market, due to which key players enhanced focus on the healthcare segment. Moreover, evolving supply chains with an influx of technology and growing partnerships with raw material suppliers are expected to boost the industry's growth. Market players invest in product development with a renewed focus on technological integration. Increasing market competition due to the pandemic has resulted in price wars and hoarding of raw materials & products, which will likely affect the industry trade in the short term.
Air-purifying respirators (APR) led the global market and accounted for more than 65.3% of the overall revenue share in 2023. The widespread demand for disposable masks, such as N95 and surgical masks, during the pandemic, has been a critical factor responsible for the segment’s high share. The segment is expected to retain its dominance over the forecast period. The demand for N95 and surgical masks, especially for first responders, healthcare workers, and the general public, is expected to continue post-pandemic on account of the realization that masks are the primary source of protection. Half-mask APRs are used in industries such as healthcare, mining, fire services & emergency response, and the military.
The supplied air respirators (SARs) segment is estimated to witness steady growth from 2024 to 2030. These respirators are primarily used in cases of negative pressure and when PAPRs do not provide adequate protection, especially in hazardous environments. The growth of the chemical, pharmaceutical, and oil & gas industries in the Asia Pacific region is expected to be the critical factor driving the demand for SARs. Repeated instances of wildfires in the U.S. and Australia, along with a rise in funding for firefighting services, have increased the demand for Self-contained breathing apparatuses (SCBA). Moreover, an increase in surface and underground mining operations will likely boost the demand for SCBA over the forecast period.
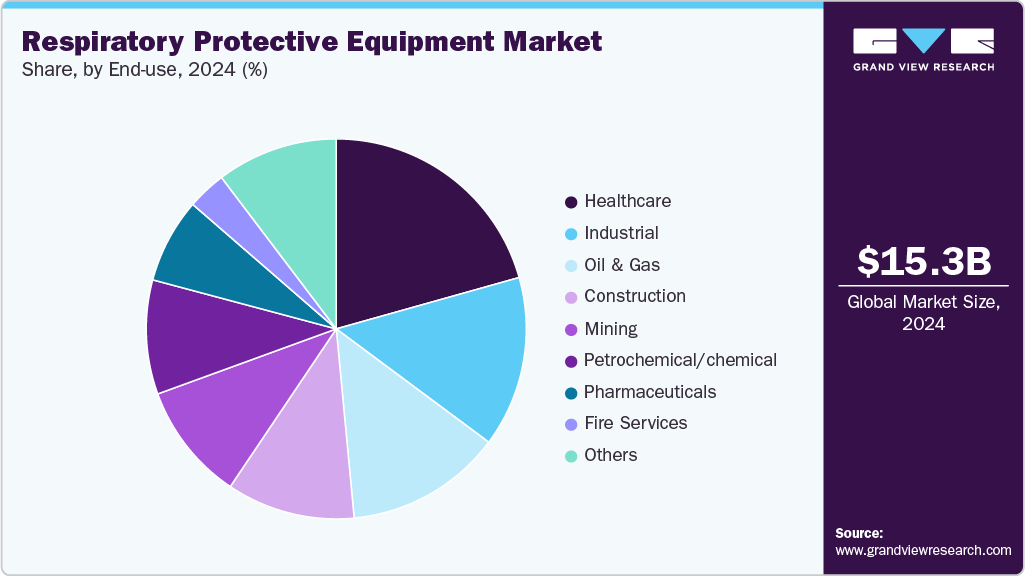
The healthcare segment led the market and accounted for over 20.8% of the global revenue in 2023. The emergence of global infectious diseases, including COVID-19, Influenza A (H1N1), and Ebola virus, promote the use of protective respiratory equipment in the healthcare sector, which is projected to drive industry growth over the forecast period. The growing awareness about worker safety during the pandemic increased product demand from the industrial end-use segment. Rapid industrialization in countries including China, India, Malaysia, and Vietnam, along with continuous improvement in occupational health and safety standards, is expected to drive the segment over the forecast period.
In construction sector the demand for respiratory protective devices is likely to witness significant CAGR growth over a forecast period. To revive the economic downturn caused by the pandemic, governments have been giving out financial stimuli to boost infrastructure development. Employees working in the construction industry are exposed to respiratory hazards, including silica dust, lead dust, and silica vapors, among others, due to which the RPE market in the construction industry is expected to grow at a steady CAGR over the forecast period. The mining industry is characterized by exposure to various particulates, including organic vapors and gases, which can cause harm to the human body. The industry promotes using respirators to avoid the health issues caused by exposure to silica and other metal dust. Air-purifying respirators with a cartridge are commonly used respirators in the mining industry to avoid exposure to contaminants in mines.
The rise of e-commerce and direct-to-consumer channels has transformed the distribution landscape of respiratory protective equipment products. Consumers can now easily access a wide range of respiratory protective equipment offerings online, leading to increased market reach and customer engagement. This shift in distribution channels also allows for personalized experiences, as brands can provide tailored recommendations based on individual preferences. Moreover, the respiratory protective equipment market benefits from a consumer base that is increasingly conscious of product quality, authenticity, and sustainability. Demand for air purifying respirators is on the rise, influencing market players to adhere to stringent quality standards and environmentally friendly practices.
North America led the global market and accounted for more than 29.9% of the global revenue in 2023. The increasing use of RPE in oil & gas drilling activities, electric power utility, and combustible dust industries has contributed to product penetration in the region over the past few years. Furthermore, stringent safety regulations are expected to be the key factors driving the market in North America over the forecast period. The strong presence of oil & gas reserves in Brazil, Argentina, Venezuela, and Columbia is expected to have a positive impact on the industry. In addition, the high potential of tight oil & gas in the Vaca Muerta field of Argentina is expected to boost the demand for new oil & gas refineries.
The market in Asia Pacific is estimated to witness the fastest CAGR over the forecast period. The rising investments in the construction, manufacturing, and food & beverage sectors are anticipated to drive the product demand in the region. Stringent norms regarding employee health and safety in various high-risk activities are expected to drive product demand over the forecast period. An increasing number of respiratory hazards coupled with the growing requirement for highly effective RPE due to exposure to hazardous particulates in the majority of core industries, such as metal manufacturing, oil & gas, automotive, and refining, is expected to augment the product demand in Europe over the forecast period.
U.S. Respiratory Protective Equipment Market
High product penetration in the U.S. is attributed to stringent regulatory scenario and growing employee awareness regarding personal safety. Increasing number of large-scale infrastructure investment projects including hotels and hospitals in New York, Missouri, and Los Angeles is expected to boost construction industry growth, thereby, driving the demand for respiratory protective equipment in construction sector in the U.S.
The market consists mainly of global players, of which a few operate regionally. New product launches, mergers and acquisitions, partnerships, and collaborations are vital strategies that companies adopt for sustained growth. Furthermore, key raw material suppliers and product manufacturers have integrated their operations to provide raw materials and manufacture the final product to cut down on raw materials procurement and operation costs. Major market players frequently undertake geographical expansion strategies to enter established and newer markets. New product developments and approvals are also a part of the key initiatives key companies undertake to gain more substantial product penetration.
In September 2022, Dräger launched its new Powered Air-Purifying Respirator System with headpieces that offer expanded technical capabilities to filter hazardous substances from the ambient air at a competitive price.
In June 2022, Avon Protection Plc, formerly known as Avon Rubber Plc, unveiled a range of EXOSKINTM CBRN gloves and boots that act as respiratory protective equipment for military personnel
In May 2022, 3M announced its plan to make expansions in its operation in Valley, Nebraska. The purpose is to enhance the production of hearing and respiratory protection products.
Report Attribute |
Details |
Market size value in 2024 |
USD 15.34 billion |
Revenue forecast in 2030 |
USD 24.68 billion |
Growth rate |
CAGR of 8.3% from 2024 to 2030 |
Actual data |
2018 - 2023 |
Forecast period |
2024 - 2030 |
Quantitative units |
Revenue in USD billion and CAGR from 2024 to 2030 |
Report coverage |
Revenue forecast, company ranking, competitive landscape, growth factors, and trends |
Segments covered |
Product, sales channel, end-use, region |
Regional scope |
North America; Europe; Asia Pacific; Central & South America; Middle East & Africa |
Country scope |
U.S. Canada, Mexico, Germany, U.K. France, Italy, Spain, Russia, Japan; China, India, Australia, Indonesia, Thailand, Malaysia, South Korea, Brazil, Argentina, Saudi Arabia, South Africa, UAE |
Key companies profiled |
3M, Alpha Pro Tech Limited, Ansell Ltd., Honeywell International Inc., Avon Rubber p.l.c., MSA Safety Incorporated, Intech Safety Pvt. Ltd., Delta Plus Group, Bullard, ILC Dover LP, DuPont, Kimberly-Clark Corporation, Polison Corporation, Uvex Safety Group, Gateway Safety, Inc |
Customization scope |
Free report customization (equivalent up to 8 analysts working days) with purchase. Addition or alteration to country, regional & segment scope. |
Pricing and purchase options |
Avail customized purchase options to meet your exact research needs. Explore purchase options |
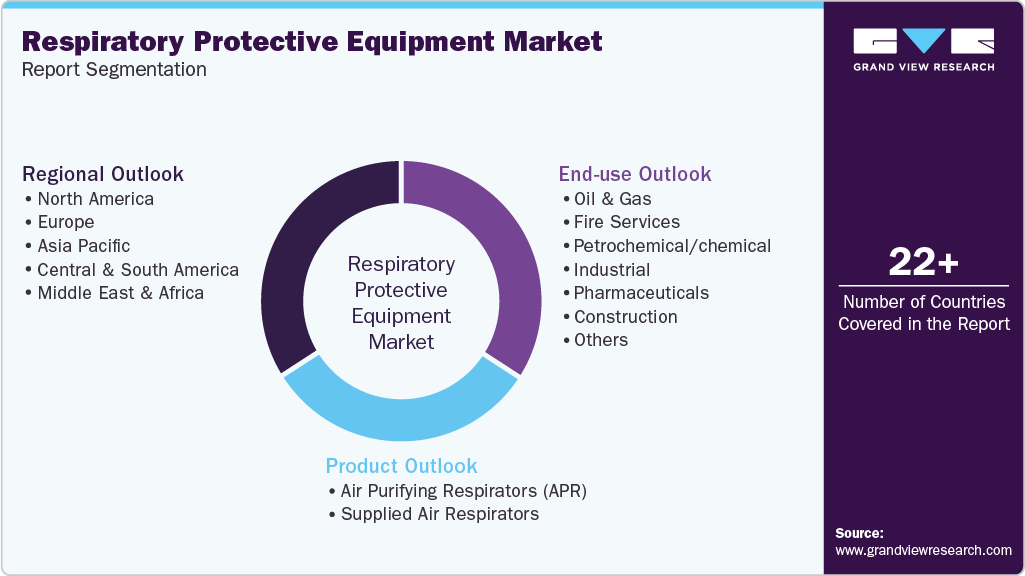
This report forecasts revenue growth at global, regional, and country levels and provides an analysis of the latest industry trends in each of the sub-segments from 2018 to 2030. For this study, Grand View Research has segmented the respiratory protective equipment market report based on product, end-use, sales channel, and region.
Product Outlook (Revenue, USD Billion, 2018 - 2030)
Air Purifying Respirators (APR)
Unpowered Air-Purifying Respirators
Disposable Filtering Half Mask Respirator
N95 Mask
Surgical Mask
Others
Half Mask Respirator
Full Face Mask Respirator
Powered Air-Purifying Respirators (PAPR)
Half Mask Respirator
Full Face Mask Respirator
Helmets, Hoods, Visors
Escape Respirators
Supplied Air Respirators
Self-contained Breathing Apparatus
Full Face Masks
Airline Respirators
End-Use Outlook (Revenue, USD Billion, 2018 - 2030)
Oil & Gas
Fire services
Petrochemical/chemical
Industrial
Pharmaceuticals
Construction
Healthcare
Mining
Others
Sales Channel Outlook (Revenue, USD Billion, 2018 - 2030)
Online
Offline
Regional Outlook (Revenue, USD Billion, 2018 - 2030)
North America
U.S.
Canada
Mexico
Europe
Germany
France
UK
Spain
Italy
Russia
Asia Pacific
China
India
Japan
Australia
Indonesia
Thailand
Malaysia
South Korea
Central & South America
Brazil
Argentina
Middle East & Africa
Saudi Arabia
South Africa
UAE
b. North America dominated the respiratory protective equipment market with a revenue share of 29.6% in 2022, on account of several factors including stringent regulations by OSHA, and NIOSH coupled with increasing investments in infrastructure.
b. Some of the key players operating in the respiratory protective equipment market include 3M, Ansell Ltd., Honeywell International Inc., MSA Safety Incorporated, Intech Safety Pvt. Ltd., Delta Plus Group, Bullard, DuPont, Kimberly-Clark Corporation.
b. The key factors that are driving the respiratory protective equipment market include increasing health problems associated with air pollution coupled with stringent government regulations, and the outbreak of the COVID-19 pandemic globally.
b. The global respiratory protective equipment market size was estimated at USD 14.83 Billion in 2022 and is expected to reach USD 14.28 Billion in 2023.
b. the respiratory protective equipment market, in terms of revenue, is expected to grow at a compound annual growth rate of 6.6% from 2023 to 2030 to reach USD 24.69 Billion by 2030.
Table of Contents
Chapter 1. Methodology and Scope
1.1. Research Methodology
1.2. Research Scope & Assumptions
1.3. Information Procurement
1.3.1. Purchased Database
1.3.2. GVR’s Internal Database
1.3.3. Secondary Sources & Third-Party Perspectives
1.3.4. Primary Research
1.4. Information Analysis
1.4.1. Data Analysis Models
1.5. Market Formulation & Data Visualization
1.6. Data Validation & Publishing
Chapter 2. Executive Summary
2.1. Market Outlook
2.2. Segment Outlook
2.3. Competitive Insights
Chapter 3. Respiratory Protective Equipment Market Variables, Trends, & Scope
3.1. Concentration & Growth Prospect Mapping
3.2. Industry Value Chain Analysis
3.3. Technology Overview
3.4. Regulatory Framework
3.5. Market Dynamics
3.5.1. Market Drivers Analysis
3.5.2. Market Restraints Analysis
3.5.3. Market Opportunity Analysis
3.5.4. Market Challenge Analysis
3.6. Respiratory Protective Equipment Market Analysis Tools
3.6.1. Porter’s Analysis
3.6.1.1. Bargaining power of the suppliers
3.6.1.2. Bargaining power of the buyers
3.6.1.3. Threats of substitution
3.6.1.4. Threats from new entrants
3.6.1.5. Competitive rivalry
3.6.2. PESTEL Analysis
3.6.2.1. Political landscape
3.6.2.2. Economic and Social landscape
3.6.2.3. Technological landscape
3.6.2.4. Environmental landscape
3.6.2.5. Legal landscape
3.7. Economic Mega Trend Analysis
Chapter 4. Respiratory Protective Equipment Market: Product Estimates & Trend Analysis
4.1. Segment Dashboard
4.2. Respiratory Protective Equipment Market: Product Movement Analysis, USD Billion, 2023 & 2030
4.3. Air Purifying Respirators (APR)
4.3.1. Market Estimates And Forecasts, 2018 - 2030 (USD Billion)
4.3.2. Unpowered Air-Purifying Respirators
4.3.2.1. Market Estimates And Forecasts, 2018 - 2030 (USD Billion)
4.3.2.2. Disposable Filtering Half Mask Respirator
4.3.2.2.1. Market Estimates And Forecasts, 2018 - 2030 (USD Billion)
4.3.2.2.2. N95 Mask
4.3.2.2.2.1. Market Estimates And Forecasts, 2018 - 2030 (USD Billion)
4.3.2.2.3. Surgical Mask
4.3.2.2.3.1. Market Estimates And Forecasts, 2018 - 2030 (USD Billion)
4.3.2.2.4. Others
4.3.2.2.4.1. Market Estimates And Forecasts, 2018 - 2030 (USD Billion)
4.3.2.3. Half Mask Respirator
4.3.2.3.1. Market Estimates And Forecasts, 2018 - 2030 (USD Billion)
4.3.2.4. Full Face Mask Respirator
4.3.2.4.1. Market Estimates And Forecasts, 2018 - 2030 (USD Billion)
4.3.3. Powered Air-Purifying Respirators (PAPR)
4.3.3.1. Market Estimates And Forecasts, 2018 - 2030 (USD Billion)
4.3.3.2. Half Mask Respirator
4.3.3.2.1. Market Estimates And Forecasts, 2018 - 2030 (USD Billion)
4.3.3.3. Full Face Mask Respirator
4.3.3.3.1. Market Estimates And Forecasts, 2018 - 2030 (USD Billion)
4.3.3.4. Helmets, Hoods, Visors
4.3.3.4.1. Market Estimates And Forecasts, 2018 - 2030 (USD Billion)
4.3.4. Escape Respirators
4.3.4.1. Market Estimates And Forecasts, 2018 - 2030 (USD Billion)
4.4. Supplied Air Respirators
4.4.1. Market Estimates And Forecasts, 2018 - 2030 (USD Billion)
4.4.2. Self-Contained Breathing Apparatus
4.4.2.1. Market Estimates And Forecasts, 2018 - 2030 (USD Billion)
4.4.3. Full Face Masks
4.4.3.1. Market Estimates And Forecasts, 2018 - 2030 (USD Billion)
4.4.4. Airline Respirators
4.4.4.1. Market Estimates And Forecasts, 2018 - 2030 (USD Billion)
Chapter 5. Respiratory Protective Equipment Market: Sales Channel Estimates & Trend Analysis
5.1. Segment Dashboard
5.2. Respiratory Protective Equipment Market: Sales Channel Movement Analysis, USD Billion, 2023 & 2030
5.3. Online
5.3.1. Market Estimates and Forecasts, 2018 - 2030 (USD Billion)
5.4. Offline
5.4.1. Market Estimates and Forecasts, 2018 - 2030 (USD Billion)
Chapter 6. Respiratory Protective Equipment Market: End-use Estimates & Trend Analysis
6.1. Segment Dashboard
6.2. Respiratory Protective Equipment Market: End-use Movement Analysis, USD Billion, 2023 & 2030
6.3. Oil & Gas
6.3.1. Market Estimates and Forecasts, 2018 - 2030 (USD Billion)
6.4. Fire Services
6.4.1. Market Estimates and Forecasts, 2018 - 2030 (USD Billion)
6.5. Petrochemical/chemical
6.5.1. Market Estimates and Forecasts, 2018 - 2030 (USD Billion)
6.6. Industrial
6.6.1. Market Estimates and Forecasts, 2018 - 2030 (USD Billion)
6.7. Pharmaceutical
6.7.1. Market Estimates and Forecasts, 2018 - 2030 (USD Billion)
6.8. Construction
6.8.1. Market Estimates and Forecasts, 2018 - 2030 (USD Billion)
6.9. Healthcare
6.9.1. Market Estimates and Forecasts, 2018 - 2030 (USD Billion)
6.10. Mining
6.10.1. Market Estimates and Forecasts, 2018 - 2030 (USD Billion)
6.11. Others
6.11.1. Market Estimates and Forecasts, 2018 - 2030 (USD Billion)
Chapter 7. Respiratory Protective Equipment Market: Region Estimates & Trend Analysis
7.1. Respiratory Protective Equipment Market Share, By Region, 2023 & 2030, USD Billion
7.2. North America
7.2.1. Market Estimates And Forecasts, 2018 - 2030 (USD Billion)
7.2.2. Market Estimates And Forecasts By Product, 2018 - 2030 (USD Billion)
7.2.3. Market Estimates And Forecasts By Sales Channel, 2018 - 2030 (USD Billion)
7.2.4. Market Estimates And Forecasts By End-Use, 2018 - 2030 (USD Billion)
7.2.5. U.S.
7.2.5.1. Market Estimates And Forecasts, 2018 - 2030 (USD Billion)
7.2.5.2. Market Estimates And Forecasts By Product, 2018 - 2030 (USD Billion)
7.2.5.3. Market Estimates And Forecasts By Sales Channel, 2018 - 2030 (USD Billion)
7.2.5.4. Market Estimates And Forecasts By End-Use, 2018 - 2030 (USD Billion
7.2.6. Canada
7.2.6.1. Market Estimates And Forecasts, 2018 - 2030 (USD Billion)
7.2.6.2. Market Estimates And Forecasts By Product, 2018 - 2030 (USD Billion)
7.2.6.3. Market Estimates And Forecasts By Sales Channel, 2018 - 2030 (USD Billion)
7.2.6.4. Market Estimates And Forecasts By End-Use, 2018 - 2030 (USD Billion
7.2.7. Mexico
7.2.7.1. Market Estimates And Forecasts, 2018 - 2030 (USD Billion)
7.2.7.2. Market Estimates And Forecasts By Product, 2018 - 2030 (USD Billion)
7.2.7.3. Market Estimates And Forecasts By Sales Channel, 2018 - 2030 (USD Billion)
7.2.7.4. Market Estimates And Forecasts By End-Use, 2018 - 2030 (USD Billion)
7.3. Europe
7.3.1. Market Estimates And Forecasts, 2018 - 2030 (USD Billion)
7.3.2. Market Estimates And Forecasts By Product, 2018 - 2030 (USD Billion)
7.3.3. Market Estimates And Forecasts By Sales Channel, 2018 - 2030 (USD Billion)
7.3.4. Market Estimates And Forecasts By End-Use, 2018 - 2030 (USD Billion)
7.3.5. Germany
7.3.5.1. Market Estimates And Forecasts, 2018 - 2030 (USD Billion)
7.3.5.2. Market Estimates And Forecasts By Product, 2018 - 2030 (USD Billion)
7.3.5.3. Market Estimates And Forecasts By Sales Channel, 2018 - 2030 (USD Billion)
7.3.5.4. Market Estimates And Forecasts By End-Use, 2018 - 2030 (USD Billion)
7.3.6. France
7.3.6.1. Market Estimates And Forecasts, 2018 - 2030 (USD Billion)
7.3.6.2. Market Estimates And Forecasts By Product, 2018 - 2030 (USD Billion)
7.3.6.3. Market Estimates And Forecasts By Sales Channel, 2018 - 2030 (USD Billion)
7.3.6.4. Market Estimates And Forecasts By End-Use, 2018 - 2030 (USD Billion)
7.3.7. Uk
7.3.7.1. Market Estimates And Forecasts, 2018 - 2030 (USD Billion)
7.3.7.2. Market Estimates And Forecasts By Product, 2018 - 2030 (USD Billion)
7.3.7.3. Market Estimates And Forecasts By Sales Channel, 2018 - 2030 (USD Billion)
7.3.7.4. Market Estimates And Forecasts By End-Use, 2018 - 2030 (USD Billion)
7.3.8. Spain
7.3.8.1. Market Estimates And Forecasts, 2018 - 2030 (USD Billion)
7.3.8.2. Market Estimates And Forecasts By Product, 2018 - 2030 (USD Billion)
7.3.8.3. Market Estimates And Forecasts By Sales Channel, 2018 - 2030 (USD Billion)
7.3.8.4. Market Estimates And Forecasts By End-Use, 2018 - 2030 (USD Billion)
7.3.9. Italy
7.3.9.1. Market Estimates And Forecasts, 2018 - 2030 (USD Billion)
7.3.9.2. Market Estimates And Forecasts By Product, 2018 - 2030 (USD Billion)
7.3.9.3. Market Estimates And Forecasts By Sales Channel, 2018 - 2030 (USD Billion)
7.3.9.4. Market Estimates And Forecasts By End-Use, 2018 - 2030 (USD Billion)
7.3.10. Russia
7.3.10.1. Market Estimates And Forecasts, 2018 - 2030 (USD Billion)
7.3.10.2. Market Estimates And Forecasts By Product, 2018 - 2030 (USD Billion)
7.3.10.3. Market Estimates And Forecasts By Sales Channel, 2018 - 2030 (USD Billion)
7.3.10.4. Market Estimates And Forecasts By End-Use, 2018 - 2030 (USD Billion)
7.4. Asia Pacific
7.4.1. Market Estimates And Forecasts, 2018 - 2030 (USD Billion)
7.4.2. Market Estimates And Forecasts By Product, 2018 - 2030 (USD Billion)
7.4.3. Market Estimates And Forecasts By Sales Channel, 2018 - 2030 (USD Billion)
7.4.4. Market Estimates And Forecasts By End-Use, 2018 - 2030 (USD Billion)
7.4.5. China
7.4.5.1. Market Estimates And Forecasts, 2018 - 2030 (USD Billion)
7.4.5.2. Market Estimates And Forecasts By Product, 2018 - 2030 (USD Billion)
7.4.5.3. Market Estimates And Forecasts By Sales Channel, 2018 - 2030 (USD Billion)
7.4.5.4. Market Estimates And Forecasts By End-Use, 2018 - 2030 (USD Billion)
7.4.6. India
7.4.6.1. Market Estimates And Forecasts, 2018 - 2030 (USD Billion)
7.4.6.2. Market Estimates And Forecasts By Product, 2018 - 2030 (USD Billion)
7.4.6.3. Market Estimates And Forecasts By Sales Channel, 2018 - 2030 (USD Billion)
7.4.6.4. Market Estimates And Forecasts By End-Use, 2018 - 2030 (USD Billion)
7.4.7. Japan
7.4.7.1. Market Estimates And Forecasts, 2018 - 2030 (USD Billion)
7.4.7.2. Market Estimates And Forecasts By Product, 2018 - 2030 (USD Billion)
7.4.7.3. Market Estimates And Forecasts By Sales Channel, 2018 - 2030 (USD Billion)
7.4.7.4. Market Estimates And Forecasts By End-Use, 2018 - 2030 (USD Billion)
7.4.8. Australia
7.4.8.1. Market Estimates And Forecasts, 2018 - 2030 (USD Billion)
7.4.8.2. Market Estimates And Forecasts By Product, 2018 - 2030 (USD Billion)
7.4.8.3. Market Estimates And Forecasts By Sales Channel, 2018 - 2030 (USD Billion)
7.4.8.4. Market Estimates And Forecasts By End-Use, 2018 - 2030 (USD Billion)
7.4.9. Indonesia
7.4.9.1. Market Estimates And Forecasts, 2018 - 2030 (USD Billion)
7.4.9.2. Market Estimates And Forecasts By Product, 2018 - 2030 (USD Billion)
7.4.9.3. Market Estimates And Forecasts By Sales Channel, 2018 - 2030 (USD Billion)
7.4.9.4. Market Estimates And Forecasts By End-Use, 2018 - 2030 (USD Billion)
7.4.10. Thailand
7.4.10.1. Market Estimates And Forecasts, 2018 - 2030 (USD Billion)
7.4.10.2. Market Estimates And Forecasts By Product, 2018 - 2030 (USD Billion)
7.4.10.3. Market Estimates And Forecasts By Sales Channel, 2018 - 2030 (USD Billion)
7.4.10.4. Market Estimates And Forecasts By End-Use, 2018 - 2030 (USD Billion)
7.4.11. Malaysia
7.4.11.1. Market Estimates And Forecasts, 2018 - 2030 (USD Billion)
7.4.11.2. Market Estimates And Forecasts By Product, 2018 - 2030 (USD Billion)
7.4.11.3. Market Estimates And Forecasts By Sales Channel, 2018 - 2030 (USD Billion)
7.4.11.4. Market Estimates And Forecasts By End-Use, 2018 - 2030 (USD Billion)
7.4.12. South Korea
7.4.12.1. Market Estimates And Forecasts, 2018 - 2030 (USD Billion)
7.4.12.2. Market Estimates And Forecasts By Product, 2018 - 2030 (USD Billion)
7.4.12.3. Market Estimates And Forecasts By Sales Channel, 2018 - 2030 (USD Billion)
7.4.12.4. Market Estimates And Forecasts By End-Use, 2018 - 2030 (USD Billion)
7.5. Central & South America
7.5.1. Market Estimates And Forecasts, 2018 - 2030 (USD Billion)
7.5.2. Market Estimates And Forecasts By Product, 2018 - 2030 (USD Billion)
7.5.3. Market Estimates And Forecasts By Sales Channel, 2018 - 2030 (USD Billion)
7.5.4. Market Estimates And Forecasts By End-Use, 2018 - 2030 (USD Billion)
7.5.5. Brazil
7.5.5.1. Market Estimates And Forecasts, 2018 - 2030 (USD Billion)
7.5.5.2. Market Estimates And Forecasts By Product, 2018 - 2030 (USD Billion)
7.5.5.3. Market Estimates And Forecasts By Sales Channel, 2018 - 2030 (USD Billion)
7.5.5.4. Market Estimates And Forecasts By End-Use, 2018 - 2030 (USD Billion)
7.5.6. Argentina
7.5.6.1. Market Estimates And Forecasts, 2018 - 2030 (USD Billion)
7.5.6.2. Market Estimates And Forecasts By Product, 2018 - 2030 (USD Billion)
7.5.6.3. Market Estimates And Forecasts By Sales Channel, 2018 - 2030 (USD Billion)
7.5.6.4. Market Estimates And Forecasts By End-Use, 2018 - 2030 (USD Billion)
7.6. Middle East & Africa
7.6.1. Market Estimates And Forecasts, 2018 - 2030 (USD Billion)
7.6.2. Market Estimates And Forecasts By Product, 2018 - 2030 (USD Billion)
7.6.3. Market Estimates And Forecasts By Sales Channel, 2018 - 2030 (USD Billion)
7.6.4. Market Estimates And Forecasts By End-Use, 2018 - 2030 (USD Billion)
7.6.5. Saudi Arabia
7.6.5.1. Market Estimates And Forecasts, 2018 - 2030 (USD Billion)
7.6.5.2. Market Estimates And Forecasts By Product, 2018 - 2030 (USD Billion)
7.6.5.3. Market Estimates And Forecasts By Sales Channel, 2018 - 2030 (USD Billion)
7.6.5.4. Market Estimates And Forecasts By End-Use, 2018 - 2030 (USD Billion)
7.6.6. South Africa
7.6.6.1. Market Estimates And Forecasts, 2018 - 2030 (USD Billion)
7.6.6.2. Market Estimates And Forecasts By Product, 2018 - 2030 (USD Billion)
7.6.6.3. Market Estimates And Forecasts By Sales Channel, 2018 - 2030 (USD Billion)
7.6.6.4. Market Estimates And Forecasts By End-Use, 2018 - 2030 (USD Billion)
7.6.7. UAE
7.6.7.1. Market Estimates And Forecasts, 2018 - 2030 (USD Billion)
7.6.7.2. Market Estimates And Forecasts By Product, 2018 - 2030 (USD Billion)
7.6.7.3. Market Estimates And Forecasts By Sales Channel, 2018 - 2030 (USD Billion)
7.6.7.4. Market Estimates And Forecasts By End-Use, 2018 - 2030 (USD Billion)
Chapter 8. Competitive Landscape
8.1. Recent Developments & Impact Analysis by Key Market Participants
8.2. Company Categorization
8.3. Company Market Positioning
8.4. Company Market Share Analysis
8.5. Company Heat Map Analysis
8.6. Strategy Mapping
8.7. Company Profiles
8.7.1. 3M
8.7.1.1. Participant’s Overview
8.7.1.2. Financial Performance
8.7.1.3. Product Benchmarking
8.7.1.4. Recent Developments
8.7.2. Alpha Pro Tech Limited
8.7.2.1. Participant’s Overview
8.7.2.2. Financial Performance
8.7.2.3. Product Benchmarking
8.7.2.4. Recent Developments
8.7.3. Ansell Ltd.
8.7.3.1. Participant’s Overview
8.7.3.2. Financial Performance
8.7.3.3. Product Benchmarking
8.7.3.4. Recent Developments
8.7.4. Honeywell International Inc.
8.7.4.1. Participant’s Overview
8.7.4.2. Financial Performance
8.7.4.3. Product Benchmarking
8.7.4.4. Recent Developments
8.7.5. Avon Rubber p.l.c.
8.7.5.1. Participant’s Overview
8.7.5.2. Financial Performance
8.7.5.3. Product Benchmarking
8.7.5.4. Recent Developments
8.7.6. MSA Safety Incorporated
8.7.6.1. Participant’s Overview
8.7.6.2. Financial Performance
8.7.6.3. Product Benchmarking
8.7.6.4. Recent Developments
8.7.7. Intech Safety Pvt. Ltd.
8.7.7.1. Participant’s Overview
8.7.7.2. Financial Performance
8.7.7.3. Product Benchmarking
8.7.7.4. Recent Developments
8.7.8. Delta Plus Group
8.7.8.1. Participant’s Overview
8.7.8.2. Financial Performance
8.7.8.3. Product Benchmarking
8.7.8.4. Recent Developments
8.7.9. Bullard
8.7.9.1. Participant’s Overview
8.7.9.2. Financial Performance
8.7.9.3. Product Benchmarking
8.7.9.4. Recent Developments
8.7.10. ILC Dover LP
8.7.10.1. Participant’s Overview
8.7.10.2. Financial Performance
8.7.10.3. Product Benchmarking
8.7.10.4. Recent Developments
8.7.11. DuPont
8.7.11.1. Participant’s Overview
8.7.11.2. Financial Performance
8.7.11.3. Product Benchmarking
8.7.11.4. Recent Developments
8.7.12. Kimberly-Clark Corporation
8.7.12.1. Participant’s Overview
8.7.12.2. Financial Performance
8.7.12.3. Product Benchmarking
8.7.12.4. Recent Developments
8.7.13. Polison Corporation
8.7.13.1. Participant’s Overview
8.7.13.2. Financial Performance
8.7.13.3. Product Benchmarking
8.7.13.4. Recent Developments
8.7.14. Uvex Safety Group
8.7.14.1. Participant’s Overview
8.7.14.2. Financial Performance
8.7.14.3. Product Benchmarking
8.7.14.4. Recent Developments
8.7.15. Gateway Safety, Inc
8.7.15.1. Participant’s Overview
8.7.15.2. Financial Performance
8.7.15.3. Product Benchmarking
8.7.15.4. Recent Developments
List of Tables
Table 1 Global Respiratory Protective Equipment Market Estimates & Forecasts, 2018 - 2030 (USD Billion)
Table 2 Global Respiratory Protective Equipment Market Estimates & Forecasts, Product, 2018 - 2030 (USD Billion)
Table 3 Global Air Purifying Respirators (APR) Market Estimates & Forecasts, By Product, 2018 - 2030 (USD Billion)
Table 4 Global Unpowered Air-Purifying Respirators Market Estimates & Forecasts, By Product, 2018 - 2030 (USD Billion)
Table 5 Global Disposable Filtering Half Mask Respirator Market Estimates & Forecasts, By Product, 2018 - 2030 (USD Billion)
Table 6 Global Powered Air-Purifying Respirators (PAPR) Market Estimates & Forecasts, By Product, 2018 - 2030 (USD Billion)
Table 7 Global Supplied Air Respirators Market Estimates & Forecasts, By Product, 2018 - 2030 (USD Billion)
Table 8 Global Respiratory Protective Equipment Market Estimates & Forecasts, End-Use, 2018 - 2030 (USD Billion)
Table 9 Global Respiratory Protective Equipment Market Estimates & Forecasts, Sales Channel, 2018 - 2030 (USD Billion)
Table 10 North America Respiratory Protective Equipment Market Estimates & Forecasts, 2018 - 2030 (USD Billion)
Table 11 North America Respiratory Protective Equipment Market Estimates & Forecasts, Product, 2018 - 2030 (USD Billion)
Table 12 North America Air Purifying Respirators (APR) Market Estimates & Forecasts, By Product, 2018 - 2030 (USD Billion)
Table 13 North America Unpowered Air-Purifying Respirators Market Estimates & Forecasts, By Product, 2018 - 2030 (USD Billion)
Table 14 North America Disposable Filtering Half Mask Respirator Market Estimates & Forecasts, By Product, 2018 - 2030 (USD Billion)
Table 15 North America Powered Air-Purifying Respirators (PAPR) Market Estimates & Forecasts, By Product, 2018 - 2030 (USD Billion)
Table 16 North America Supplied Air Respirators Market Estimates & Forecasts, By Product, 2018 - 2030 (USD Billion)
Table 17 North America Respiratory Protective Equipment Market Estimates & Forecasts, End-Use, 2018 - 2030 (USD Billion)
Table 18 North America Respiratory Protective Equipment Market Estimates & Forecasts, Sales Channel, 2018 - 2030 (USD Billion)
Table 19 U.S. Respiratory Protective Equipment Market Estimates & Forecasts, 2018 - 2030 (USD Billion)
Table 20 U.S. Respiratory Protective Equipment Market Estimates & Forecasts, Product, 2018 - 2030 (USD Billion)
Table 21 U.S. Air Purifying Respirators (APR) Market Estimates & Forecasts, By Product, 2018 - 2030 (USD Billion)
Table 22 U.S. Unpowered Air-Purifying Respirators Market Estimates & Forecasts, By Product, 2018 - 2030 (USD Billion)
Table 23 U.S. Disposable Filtering Half Mask Respirator Market Estimates & Forecasts, By Product, 2018 - 2030 (USD Billion)
Table 24 U.S. Powered Air-Purifying Respirators (PAPR) Market Estimates & Forecasts, By Product, 2018 - 2030 (USD Billion)
Table 25 U.S. Supplied Air Respirators Market Estimates & Forecasts, By Product, 2018 - 2030 (USD Billion)
Table 26 U.S. Respiratory Protective Equipment Market Estimates & Forecasts, End-Use, 2018 - 2030 (USD Billion)
Table 27 U.S. Respiratory Protective Equipment Market Estimates & Forecasts, Sales Channel, 2018 - 2030 (USD Billion)
Table 28 Canada Respiratory Protective Equipment Market Estimates & Forecasts, 2018 - 2030 (USD Billion)
Table 29 Canada Respiratory Protective Equipment Market Estimates & Forecasts, Product, 2018 - 2030 (USD Billion)
Table 30 Canada Air Purifying Respirators (APR) Market Estimates & Forecasts, By Product, 2018 - 2030 (USD Billion)
Table 31 Canada Unpowered Air-Purifying Respirators Market Estimates & Forecasts, By Product, 2018 - 2030 (USD Billion)
Table 32 Canada Disposable Filtering Half Mask Respirator Market Estimates & Forecasts, By Product, 2018 - 2030 (USD Billion)
Table 33 Canada Powered Air-Purifying Respirators (PAPR) Market Estimates & Forecasts, By Product, 2018 - 2030 (USD Billion)
Table 34 Canada Supplied Air Respirators Market Estimates & Forecasts, By Product, 2018 - 2030 (USD Billion)
Table 35 Canada Respiratory Protective Equipment Market Estimates & Forecasts, End-Use, 2018 - 2030 (USD Billion)
Table 36 Canada Respiratory Protective Equipment Market Estimates & Forecasts, Sales Channel, 2018 - 2030 (USD Billion)
Table 37 Mexico Respiratory Protective Equipment Market Estimates & Forecasts, 2018 - 2030 (USD Billion)
Table 38 Mexico Respiratory Protective Equipment Market Estimates & Forecasts, Product, 2018 - 2030 (USD Billion)
Table 39 Mexico Air Purifying Respirators (APR) Market Estimates & Forecasts, By Product, 2018 - 2030 (USD Billion)
Table 40 Mexico Unpowered Air-Purifying Respirators Market Estimates & Forecasts, By Product, 2018 - 2030 (USD Billion)
Table 41 Mexico Disposable Filtering Half Mask Respirator Market Estimates & Forecasts, By Product, 2018 - 2030 (USD Billion)
Table 42 Mexico Powered Air-Purifying Respirators (PAPR) Market Estimates & Forecasts, By Product, 2018 - 2030 (USD Billion)
Table 43 Mexico Supplied Air Respirators Market Estimates & Forecasts, By Product, 2018 - 2030 (USD Billion)
Table 44 Mexico Respiratory Protective Equipment Market Estimates & Forecasts, End-Use, 2018 - 2030 (USD Billion)
Table 45 Mexico Respiratory Protective Equipment Market Estimates & Forecasts, Sales Channel, 2018 - 2030 (USD Billion)
Table 46 Europe Respiratory Protective Equipment Market Estimates & Forecasts, 2018 - 2030 (USD Billion)
Table 47 Europe Respiratory Protective Equipment Market Estimates & Forecasts, Product, 2018 - 2030 (USD Billion)
Table 48 Europe Air Purifying Respirators (APR) Market Estimates & Forecasts, By Product, 2018 - 2030 (USD Billion)
Table 49 Europe Unpowered Air-Purifying Respirators Market Estimates & Forecasts, By Product, 2018 - 2030 (USD Billion)
Table 50 Europe Disposable Filtering Half Mask Respirator Market Estimates & Forecasts, By Product, 2018 - 2030 (USD Billion)
Table 51 Europe Powered Air-Purifying Respirators (PAPR) Market Estimates & Forecasts, By Product, 2018 - 2030 (USD Billion)
Table 52 Europe Supplied Air Respirators Market Estimates & Forecasts, By Product, 2018 - 2030 (USD Billion)
Table 53 Europe Respiratory Protective Equipment Market Estimates & Forecasts, End-Use, 2018 - 2030 (USD Billion)
Table 54 Europe Respiratory Protective Equipment Market Estimates & Forecasts, Sales Channel, 2018 - 2030 (USD Billion)
Table 55 Germany Respiratory Protective Equipment Market Estimates & Forecasts, 2018 - 2030 (USD Billion)
Table 56 Germany Respiratory Protective Equipment Market Estimates & Forecasts, Product, 2018 - 2030 (USD Billion)
Table 57 Germany Air Purifying Respirators (APR) Market Estimates & Forecasts, By Product, 2018 - 2030 (USD Billion)
Table 58 Germany Unpowered Air-Purifying Respirators Market Estimates & Forecasts, By Product, 2018 - 2030 (USD Billion)
Table 59 Germany Disposable Filtering Half Mask Respirator Market Estimates & Forecasts, By Product, 2018 - 2030 (USD Billion)
Table 60 Germany Powered Air-Purifying Respirators (PAPR) Market Estimates & Forecasts, By Product, 2018 - 2030 (USD Billion)
Table 61 Germany Supplied Air Respirators Market Estimates & Forecasts, By Product, 2018 - 2030 (USD Billion)
Table 62 Germany Respiratory Protective Equipment Market Estimates & Forecasts, End-Use, 2018 - 2030 (USD Billion)
Table 63 Germany Respiratory Protective Equipment Market Estimates & Forecasts, Sales Channel, 2018 - 2030 (USD Billion)
Table 64 France Respiratory Protective Equipment Market Estimates & Forecasts, 2018 - 2030 (USD Billion)
Table 65 France Respiratory Protective Equipment Market Estimates & Forecasts, Product, 2018 - 2030 (USD Billion)
Table 66 France Air Purifying Respirators (APR) Market Estimates & Forecasts, By Product, 2018 - 2030 (USD Billion)
Table 67 France Unpowered Air-Purifying Respirators Market Estimates & Forecasts, By Product, 2018 - 2030 (USD Billion)
Table 68 France Disposable Filtering Half Mask Respirator Market Estimates & Forecasts, By Product, 2018 - 2030 (USD Billion)
Table 69 France Powered Air-Purifying Respirators (PAPR) Market Estimates & Forecasts, By Product, 2018 - 2030 (USD Billion)
Table 70 France Supplied Air Respirators Market Estimates & Forecasts, By Product, 2018 - 2030 (USD Billion)
Table 71 France Respiratory Protective Equipment Market Estimates & Forecasts, End-Use, 2018 - 2030 (USD Billion)
Table 72 France Respiratory Protective Equipment Market Estimates & Forecasts, Sales Channel, 2018 - 2030 (USD Billion)
Table 73 UK Respiratory Protective Equipment Market Estimates & Forecasts, 2018 - 2030 (USD Billion)
Table 74 UK Respiratory Protective Equipment Market Estimates & Forecasts, Product, 2018 - 2030 (USD Billion)
Table 75 UK Air Purifying Respirators (APR) Market Estimates & Forecasts, By Product, 2018 - 2030 (USD Billion)
Table 76 UK Unpowered Air-Purifying Respirators Market Estimates & Forecasts, By Product, 2018 - 2030 (USD Billion)
Table 77 UK Disposable Filtering Half Mask Respirator Market Estimates & Forecasts, By Product, 2018 - 2030 (USD Billion)
Table 78 UK Powered Air-Purifying Respirators (PAPR) Market Estimates & Forecasts, By Product, 2018 - 2030 (USD Billion)
Table 79 UK Supplied Air Respirators Market Estimates & Forecasts, By Product, 2018 - 2030 (USD Billion)
Table 80 UK Respiratory Protective Equipment Market Estimates & Forecasts, End-Use, 2018 - 2030 (USD Billion)
Table 81 UK Respiratory Protective Equipment Market Estimates & Forecasts, Sales Channel, 2018 - 2030 (USD Billion)
Table 82 Spain Respiratory Protective Equipment Market Estimates & Forecasts, 2018 - 2030 (USD Billion)
Table 83 Spain Respiratory Protective Equipment Market Estimates & Forecasts, Product, 2018 - 2030 (USD Billion)
Table 84 Spain Air Purifying Respirators (APR) Market Estimates & Forecasts, By Product, 2018 - 2030 (USD Billion)
Table 85 Spain Unpowered Air-Purifying Respirators Market Estimates & Forecasts, By Product, 2018 - 2030 (USD Billion)
Table 86 Spain Disposable Filtering Half Mask Respirator Market Estimates & Forecasts, By Product, 2018 - 2030 (USD Billion)
Table 87 Spain Powered Air-Purifying Respirators (PAPR) Market Estimates & Forecasts, By Product, 2018 - 2030 (USD Billion)
Table 88 Spain Supplied Air Respirators Market Estimates & Forecasts, By Product, 2018 - 2030 (USD Billion)
Table 89 Spain Respiratory Protective Equipment Market Estimates & Forecasts, End-Use, 2018 - 2030 (USD Billion)
Table 90 Spain Respiratory Protective Equipment Market Estimates & Forecasts, Sales Channel, 2018 - 2030 (USD Billion)
Table 91 Italy Respiratory Protective Equipment Market Estimates & Forecasts, 2018 - 2030 (USD Billion)
Table 92 Italy Respiratory Protective Equipment Market Estimates & Forecasts, Product, 2018 - 2030 (USD Billion)
Table 93 Italy Air Purifying Respirators (APR) Market Estimates & Forecasts, By Product, 2018 - 2030 (USD Billion)
Table 94 Italy Unpowered Air-Purifying Respirators Market Estimates & Forecasts, By Product, 2018 - 2030 (USD Billion)
Table 95 Italy Disposable Filtering Half Mask Respirator Market Estimates & Forecasts, By Product, 2018 - 2030 (USD Billion)
Table 96 Italy Powered Air-Purifying Respirators (PAPR) Market Estimates & Forecasts, By Product, 2018 - 2030 (USD Billion)
Table 97 Italy Supplied Air Respirators Market Estimates & Forecasts, By Product, 2018 - 2030 (USD Billion)
Table 98 Italy Respiratory Protective Equipment Market Estimates & Forecasts, End-Use, 2018 - 2030 (USD Billion)
Table 99 Italy Respiratory Protective Equipment Market Estimates & Forecasts, Sales Channel, 2018 - 2030 (USD Billion)
Table 100 Russia Respiratory Protective Equipment Market Estimates & Forecasts, 2018 - 2030 (USD Billion)
Table 101 Russia Respiratory Protective Equipment Market Estimates & Forecasts, Product, 2018 - 2030 (USD Billion)
Table 102 Russia Air Purifying Respirators (APR) Market Estimates & Forecasts, By Product, 2018 - 2030 (USD Billion)
Table 103 Russia Unpowered Air-Purifying Respirators Market Estimates & Forecasts, By Product, 2018 - 2030 (USD Billion)
Table 104 Russia Disposable Filtering Half Mask Respirator Market Estimates & Forecasts, By Product, 2018 - 2030 (USD Billion)
Table 105 Russia Powered Air-Purifying Respirators (PAPR) Market Estimates & Forecasts, By Product, 2018 - 2030 (USD Billion)
Table 106 Russia Supplied Air Respirators Market Estimates & Forecasts, By Product, 2018 - 2030 (USD Billion)
Table 107 Russia Respiratory Protective Equipment Market Estimates & Forecasts, End-Use, 2018 - 2030 (USD Billion)
Table 108 Russia Respiratory Protective Equipment Market Estimates & Forecasts, Sales Channel, 2018 - 2030 (USD Billion)
Table 109 Asia Pacific Respiratory Protective Equipment Market Estimates & Forecasts, 2018 - 2030 (USD Billion)
Table 110 Asia Pacific Respiratory Protective Equipment Market Estimates & Forecasts, Product, 2018 - 2030 (USD Billion)
Table 111 Asia Pacific Air Purifying Respirators (APR) Market Estimates & Forecasts, By Product, 2018 - 2030 (USD Billion)
Table 112 Asia Pacific Unpowered Air-Purifying Respirators Market Estimates & Forecasts, By Product, 2018 - 2030 (USD Billion)
Table 113 Asia Pacific Disposable Filtering Half Mask Respirator Market Estimates & Forecasts, By Product, 2018 - 2030 (USD Billion)
Table 114 Asia Pacific Powered Air-Purifying Respirators (PAPR) Market Estimates & Forecasts, By Product, 2018 - 2030 (USD Billion)
Table 115 Asia Pacific Supplied Air Respirators Market Estimates & Forecasts, By Product, 2018 - 2030 (USD Billion)
Table 116 Asia Pacific Respiratory Protective Equipment Market Estimates & Forecasts, End-Use, 2018 - 2030 (USD Billion)
Table 117 Asia Pacific Respiratory Protective Equipment Market Estimates & Forecasts, Sales Channel, 2018 - 2030 (USD Billion)
Table 118 China Respiratory Protective Equipment Market Estimates & Forecasts, 2018 - 2030 (USD Billion)
Table 119 China Respiratory Protective Equipment Market Estimates & Forecasts, Product, 2018 - 2030 (USD Billion)
Table 120 China Air Purifying Respirators (APR) Market Estimates & Forecasts, By Product, 2018 - 2030 (USD Billion)
Table 121 China Unpowered Air-Purifying Respirators Market Estimates & Forecasts, By Product, 2018 - 2030 (USD Billion)
Table 122 China Disposable Filtering Half Mask Respirator Market Estimates & Forecasts, By Product, 2018 - 2030 (USD Billion)
Table 123 China Powered Air-Purifying Respirators (PAPR) Market Estimates & Forecasts, By Product, 2018 - 2030 (USD Billion)
Table 124 China Supplied Air Respirators Market Estimates & Forecasts, By Product, 2018 - 2030 (USD Billion)
Table 125 China Respiratory Protective Equipment Market Estimates & Forecasts, End-Use, 2018 - 2030 (USD Billion)
Table 126 China Respiratory Protective Equipment Market Estimates & Forecasts, Sales Channel, 2018 - 2030 (USD Billion)
Table 127 India Respiratory Protective Equipment Market Estimates & Forecasts, 2018 - 2030 (USD Billion)
Table 128 India Respiratory Protective Equipment Market Estimates & Forecasts, Product, 2018 - 2030 (USD Billion)
Table 129 India Air Purifying Respirators (APR) Market Estimates & Forecasts, By Product, 2018 - 2030 (USD Billion)
Table 130 India Unpowered Air-Purifying Respirators Market Estimates & Forecasts, By Product, 2018 - 2030 (USD Billion)
Table 131 India Disposable Filtering Half Mask Respirator Market Estimates & Forecasts, By Product, 2018 - 2030 (USD Billion)
Table 132 India Powered Air-Purifying Respirators (PAPR) Market Estimates & Forecasts, By Product, 2018 - 2030 (USD Billion)
Table 133 India Supplied Air Respirators Market Estimates & Forecasts, By Product, 2018 - 2030 (USD Billion)
Table 134 India Respiratory Protective Equipment Market Estimates & Forecasts, End-Use, 2018 - 2030 (USD Billion)
Table 135 India Respiratory Protective Equipment Market Estimates & Forecasts, Sales Channel, 2018 - 2030 (USD Billion)
Table 136 Japan Respiratory Protective Equipment Market Estimates & Forecasts, 2018 - 2030 (USD Billion)
Table 137 Japan Respiratory Protective Equipment Market Estimates & Forecasts, Product, 2018 - 2030 (USD Billion)
Table 138 Japan Air Purifying Respirators (APR) Market Estimates & Forecasts, By Product, 2018 - 2030 (USD Billion)
Table 139 Japan Unpowered Air-Purifying Respirators Market Estimates & Forecasts, By Product, 2018 - 2030 (USD Billion)
Table 140 Japan Disposable Filtering Half Mask Respirator Market Estimates & Forecasts, By Product, 2018 - 2030 (USD Billion)
Table 141 Japan Powered Air-Purifying Respirators (PAPR) Market Estimates & Forecasts, By Product, 2018 - 2030 (USD Billion)
Table 142 Japan Supplied Air Respirators Market Estimates & Forecasts, By Product, 2018 - 2030 (USD Billion)
Table 143 Japan Respiratory Protective Equipment Market Estimates & Forecasts, End-Use, 2018 - 2030 (USD Billion)
Table 144 Japan Respiratory Protective Equipment Market Estimates & Forecasts, Sales Channel, 2018 - 2030 (USD Billion)
Table 145 Australia Respiratory Protective Equipment Market Estimates & Forecasts, 2018 - 2030 (USD Billion)
Table 146 Australia Respiratory Protective Equipment Market Estimates & Forecasts, Product, 2018 - 2030 (USD Billion)
Table 147 Australia Air Purifying Respirators (APR) Market Estimates & Forecasts, By Product, 2018 - 2030 (USD Billion)
Table 148 Australia Unpowered Air-Purifying Respirators Market Estimates & Forecasts, By Product, 2018 - 2030 (USD Billion)
Table 149 Australia Disposable Filtering Half Mask Respirator Market Estimates & Forecasts, By Product, 2018 - 2030 (USD Billion)
Table 150 Australia Powered Air-Purifying Respirators (PAPR) Market Estimates & Forecasts, By Product, 2018 - 2030 (USD Billion)
Table 151 Australia Supplied Air Respirators Market Estimates & Forecasts, By Product, 2018 - 2030 (USD Billion)
Table 152 Australia Respiratory Protective Equipment Market Estimates & Forecasts, End-Use, 2018 - 2030 (USD Billion)
Table 153 Australia Respiratory Protective Equipment Market Estimates & Forecasts, Sales Channel, 2018 - 2030 (USD Billion)
Table 154 Indonesia Respiratory Protective Equipment Market Estimates & Forecasts, 2018 - 2030 (USD Billion)
Table 155 Indonesia Respiratory Protective Equipment Market Estimates & Forecasts, Product, 2018 - 2030 (USD Billion)
Table 156 Indonesia Air Purifying Respirators (APR) Market Estimates & Forecasts, By Product, 2018 - 2030 (USD Billion)
Table 157 Indonesia Unpowered Air-Purifying Respirators Market Estimates & Forecasts, By Product, 2018 - 2030 (USD Billion)
Table 158 Indonesia Disposable Filtering Half Mask Respirator Market Estimates & Forecasts, By Product, 2018 - 2030 (USD Billion)
Table 159 Indonesia Powered Air-Purifying Respirators (PAPR) Market Estimates & Forecasts, By Product, 2018 - 2030 (USD Billion)
Table 160 Indonesia Supplied Air Respirators Market Estimates & Forecasts, By Product, 2018 - 2030 (USD Billion)
Table 161 Indonesia Respiratory Protective Equipment Market Estimates & Forecasts, End-Use, 2018 - 2030 (USD Billion)
Table 162 Indonesia Respiratory Protective Equipment Market Estimates & Forecasts, Sales Channel, 2018 - 2030 (USD Billion)
Table 163 Thailand Respiratory Protective Equipment Market Estimates & Forecasts, 2018 - 2030 (USD Billion)
Table 164 Thailand Respiratory Protective Equipment Market Estimates & Forecasts, Product, 2018 - 2030 (USD Billion)
Table 165 Thailand Air Purifying Respirators (APR) Market Estimates & Forecasts, By Product, 2018 - 2030 (USD Billion)
Table 166 Thailand Unpowered Air-Purifying Respirators Market Estimates & Forecasts, By Product, 2018 - 2030 (USD Billion)
Table 167 Thailand Disposable Filtering Half Mask Respirator Market Estimates & Forecasts, By Product, 2018 - 2030 (USD Billion)
Table 168 Thailand Powered Air-Purifying Respirators (PAPR) Market Estimates & Forecasts, By Product, 2018 - 2030 (USD Billion)
Table 169 Thailand Supplied Air Respirators Market Estimates & Forecasts, By Product, 2018 - 2030 (USD Billion)
Table 170 Thailand Respiratory Protective Equipment Market Estimates & Forecasts, End-Use, 2018 - 2030 (USD Billion)
Table 171 Thailand Respiratory Protective Equipment Market Estimates & Forecasts, Sales Channel, 2018 - 2030 (USD Billion)
Table 172 Malaysia Respiratory Protective Equipment Market Estimates & Forecasts, 2018 - 2030 (USD Billion)
Table 173 Malaysia Respiratory Protective Equipment Market Estimates & Forecasts, Product, 2018 - 2030 (USD Billion)
Table 174 Malaysia Air Purifying Respirators (APR) Market Estimates & Forecasts, By Product, 2018 - 2030 (USD Billion)
Table 175 Malaysia Unpowered Air-Purifying Respirators Market Estimates & Forecasts, By Product, 2018 - 2030 (USD Billion)
Table 176 Malaysia Disposable Filtering Half Mask Respirator Market Estimates & Forecasts, By Product, 2018 - 2030 (USD Billion)
Table 177 Malaysia Powered Air-Purifying Respirators (PAPR) Market Estimates & Forecasts, By Product, 2018 - 2030 (USD Billion)
Table 178 Malaysia Supplied Air Respirators Market Estimates & Forecasts, By Product, 2018 - 2030 (USD Billion)
Table 179 Malaysia Respiratory Protective Equipment Market Estimates & Forecasts, End-Use, 2018 - 2030 (USD Billion)
Table 180 Malaysia Respiratory Protective Equipment Market Estimates & Forecasts, Sales Channel, 2018 - 2030 (USD Billion)
Table 181 South Korea Respiratory Protective Equipment Market Estimates & Forecasts, 2018 - 2030 (USD Billion)
Table 182 South Korea Respiratory Protective Equipment Market Estimates & Forecasts, Product, 2018 - 2030 (USD Billion)
Table 183 South Korea Air Purifying Respirators (APR) Market Estimates & Forecasts, By Product, 2018 - 2030 (USD Billion)
Table 184 South Korea Unpowered Air-Purifying Respirators Market Estimates & Forecasts, By Product, 2018 - 2030 (USD Billion)
Table 185 South Korea Disposable Filtering Half Mask Respirator Market Estimates & Forecasts, By Product, 2018 - 2030 (USD Billion)
Table 186 South Korea Powered Air-Purifying Respirators (PAPR) Market Estimates & Forecasts, By Product, 2018 - 2030 (USD Billion)
Table 187 South Korea Supplied Air Respirators Market Estimates & Forecasts, By Product, 2018 - 2030 (USD Billion)
Table 188 South Korea Respiratory Protective Equipment Market Estimates & Forecasts, End-Use, 2018 - 2030 (USD Billion)
Table 189 South Korea Respiratory Protective Equipment Market Estimates & Forecasts, Sales Channel, 2018 - 2030 (USD Billion)
Table 190 Central & South America Respiratory Protective Equipment Market Estimates & Forecasts, 2018 - 2030 (USD Billion)
Table 191 Central & South America Respiratory Protective Equipment Market Estimates & Forecasts, Product, 2018 - 2030 (USD Billion)
Table 192 Central & South America Air Purifying Respirators (APR) Market Estimates & Forecasts, By Product, 2018 - 2030 (USD Billion)
Table 193 Central & South America Unpowered Air-Purifying Respirators Market Estimates & Forecasts, By Product, 2018 - 2030 (USD Billion)
Table 194 Central & South America Disposable Filtering Half Mask Respirator Market Estimates & Forecasts, By Product, 2018 - 2030 (USD Billion)
Table 195 Central & South America Powered Air-Purifying Respirators (PAPR) Market Estimates & Forecasts, By Product, 2018 - 2030 (USD Billion)
Table 196 Central & South America Supplied Air Respirators Market Estimates & Forecasts, By Product, 2018 - 2030 (USD Billion)
Table 197 Central & South America Respiratory Protective Equipment Market Estimates & Forecasts, End-Use, 2018 - 2030 (USD Billion)
Table 198 Central & South America Respiratory Protective Equipment Market Estimates & Forecasts, Sales Channel, 2018 - 2030 (USD Billion)
Table 199 Brazil Respiratory Protective Equipment Market Estimates & Forecasts, 2018 - 2030 (USD Billion)
Table 200 Brazil Respiratory Protective Equipment Market Estimates & Forecasts, Product, 2018 - 2030 (USD Billion)
Table 201 Brazil Air Purifying Respirators (APR) Market Estimates & Forecasts, By Product, 2018 - 2030 (USD Billion)
Table 202 Brazil Unpowered Air-Purifying Respirators Market Estimates & Forecasts, By Product, 2018 - 2030 (USD Billion)
Table 203 Brazil Disposable Filtering Half Mask Respirator Market Estimates & Forecasts, By Product, 2018 - 2030 (USD Billion)
Table 204 Brazil Powered Air-Purifying Respirators (PAPR) Market Estimates & Forecasts, By Product, 2018 - 2030 (USD Billion)
Table 205 Brazil Supplied Air Respirators Market Estimates & Forecasts, By Product, 2018 - 2030 (USD Billion)
Table 206 Brazil Respiratory Protective Equipment Market Estimates & Forecasts, End-Use, 2018 - 2030 (USD Billion)
Table 207 Brazil Respiratory Protective Equipment Market Estimates & Forecasts, Sales Channel, 2018 - 2030 (USD Billion)
Table 208 Argentina Respiratory Protective Equipment Market Estimates & Forecasts, 2018 - 2030 (USD Billion)
Table 209 Argentina Respiratory Protective Equipment Market Estimates & Forecasts, Product, 2018 - 2030 (USD Billion)
Table 210 Argentina Air Purifying Respirators (APR) Market Estimates & Forecasts, By Product, 2018 - 2030 (USD Billion)
Table 211 Argentina Unpowered Air-Purifying Respirators Market Estimates & Forecasts, By Product, 2018 - 2030 (USD Billion)
Table 212 Argentina Disposable Filtering Half Mask Respirator Market Estimates & Forecasts, By Product, 2018 - 2030 (USD Billion)
Table 213 Argentina Powered Air-Purifying Respirators (PAPR) Market Estimates & Forecasts, By Product, 2018 - 2030 (USD Billion)
Table 214 Argentina Supplied Air Respirators Market Estimates & Forecasts, By Product, 2018 - 2030 (USD Billion)
Table 215 Argentina Respiratory Protective Equipment Market Estimates & Forecasts, End-Use, 2018 - 2030 (USD Billion)
Table 216 Argentina Respiratory Protective Equipment Market Estimates & Forecasts, Sales Channel, 2018 - 2030 (USD Billion)
Table 217 Middle East & Africa Respiratory Protective Equipment Market Estimates & Forecasts, 2018 - 2030 (USD Billion)
Table 218 Middle East & Africa Respiratory Protective Equipment Market Estimates & Forecasts, Product, 2018 - 2030 (USD Billion)
Table 219 Middle East & Africa Air Purifying Respirators (APR) Market Estimates & Forecasts, By Product, 2018 - 2030 (USD Billion)
Table 220 Middle East & Africa Unpowered Air-Purifying Respirators Market Estimates & Forecasts, By Product, 2018 - 2030 (USD Billion)
Table 221 Middle East & Africa Disposable Filtering Half Mask Respirator Market Estimates & Forecasts, By Product, 2018 - 2030 (USD Billion)
Table 222 Middle East & Africa Powered Air-Purifying Respirators (PAPR) Market Estimates & Forecasts, By Product, 2018 - 2030 (USD Billion)
Table 223 Middle East & Africa Supplied Air Respirators Market Estimates & Forecasts, By Product, 2018 - 2030 (USD Billion)
Table 224 Middle East & Africa Respiratory Protective Equipment Market Estimates & Forecasts, End-Use, 2018 - 2030 (USD Billion)
Table 225 Middle East & Africa Respiratory Protective Equipment Market Estimates & Forecasts, Sales Channel, 2018 - 2030 (USD Billion)
Table 226 Saudi Arabia Respiratory Protective Equipment Market Estimates & Forecasts, 2018 - 2030 (USD Billion)
Table 227 Saudi Arabia Respiratory Protective Equipment Market Estimates & Forecasts, Product, 2018 - 2030 (USD Billion)
Table 228 Saudi Arabia Air Purifying Respirators (APR) Market Estimates & Forecasts, By Product, 2018 - 2030 (USD Billion)
Table 229 Saudi Arabia Unpowered Air-Purifying Respirators Market Estimates & Forecasts, By Product, 2018 - 2030 (USD Billion)
Table 230 Saudi Arabia Disposable Filtering Half Mask Respirator Market Estimates & Forecasts, By Product, 2018 - 2030 (USD Billion)
Table 231 Saudi Arabia Powered Air-Purifying Respirators (PAPR) Market Estimates & Forecasts, By Product, 2018 - 2030 (USD Billion)
Table 232 Saudi Arabia Supplied Air Respirators Market Estimates & Forecasts, By Product, 2018 - 2030 (USD Billion)
Table 233 Saudi Arabia Respiratory Protective Equipment Market Estimates & Forecasts, End-Use, 2018 - 2030 (USD Billion)
Table 234 Saudi Arabia Respiratory Protective Equipment Market Estimates & Forecasts, Sales Channel, 2018 - 2030 (USD Billion)
Table 235 South Africa Respiratory Protective Equipment Market Estimates & Forecasts, 2018 - 2030 (USD Billion)
Table 236 South Africa Respiratory Protective Equipment Market Estimates & Forecasts, Product, 2018 - 2030 (USD Billion)
Table 237 South Africa Air Purifying Respirators (APR) Market Estimates & Forecasts, By Product, 2018 - 2030 (USD Billion)
Table 238 South Africa Unpowered Air-Purifying Respirators Market Estimates & Forecasts, By Product, 2018 - 2030 (USD Billion)
Table 239 South Africa Disposable Filtering Half Mask Respirator Market Estimates & Forecasts, By Product, 2018 - 2030 (USD Billion)
Table 240 South Africa Powered Air-Purifying Respirators (PAPR) Market Estimates & Forecasts, By Product, 2018 - 2030 (USD Billion)
Table 241 South Africa Supplied Air Respirators Market Estimates & Forecasts, By Product, 2018 - 2030 (USD Billion)
Table 242 South Africa Respiratory Protective Equipment Market Estimates & Forecasts, End-Use, 2018 - 2030 (USD Billion)
Table 243 South Africa Respiratory Protective Equipment Market Estimates & Forecasts, Sales Channel, 2018 - 2030 (USD Billion)
Table 244 UAE Respiratory Protective Equipment Market Estimates & Forecasts, 2018 - 2030 (USD Billion)
Table 245 UAE Respiratory Protective Equipment Market Estimates & Forecasts, Product, 2018 - 2030 (USD Billion)
Table 246 UAE Air Purifying Respirators (APR) Market Estimates & Forecasts, By Product, 2018 - 2030 (USD Billion)
Table 247 UAE Unpowered Air-Purifying Respirators Market Estimates & Forecasts, By Product, 2018 - 2030 (USD Billion)
Table 248 UAE Disposable Filtering Half Mask Respirator Market Estimates & Forecasts, By Product, 2018 - 2030 (USD Billion)
Table 249 UAE Powered Air-Purifying Respirators (PAPR) Market Estimates & Forecasts, By Product, 2018 - 2030 (USD Billion)
Table 250 UAE Supplied Air Respirators Market Estimates & Forecasts, By Product, 2018 - 2030 (USD Billion)
Table 251 UAE Respiratory Protective Equipment Market Estimates & Forecasts, End-Use, 2018 - 2030 (USD Billion)
Table 252 UAE Respiratory Protective Equipment Market Estimates & Forecasts, Sales Channel, 2018 - 2030 (USD Billion)
Table 253 Recent Developments & Impact Analysis, By Key Market Participants
Table 254 Company Heat Map Analysis, 2023
Table 255 Key Companies: Mergers & Acquisitions
Table 256 Key Companies: Product Launches
Table 257 Key Companies: Expansions
List of Figures
Fig. 1 Market Segmentation & Scope
Fig. 2 Information Procurement
Fig. 3 Data Analysis Models
Fig. 4 Market Formulation And Validation
Fig. 5 Data Validating & Publishing
Fig. 6 Market Snapshot
Fig. 7 Market Segmentation & Scope
Fig. 8 Segment Snapshot
Fig. 9 Competitive Landscape Snapshot
Fig. 10 Respiratory Protective Equipment Market - Value Chain Analysis
Fig. 11 Respiratory Protective Equipment Market - Market Dynamics
Fig. 12 Respiratory Protective Equipment Market - PORTER’s Analysis
Fig. 13 Respiratory Protective Equipment Market - PESTEL Analysis
Fig. 14 Respiratory Protective Equipment Market Estimates & Forecasts, By Product: Key Takeaways
Fig. 15 Respiratory Protective Equipment Market Share, By Product, 2023 & 2030
Fig. 16 Air Purifying Respirators (APR) Market Estimates & Forecasts, By Product , 2018 - 2030 (USD Billion)
Fig. 17 Unpowered Air-Purifying Respirators Market Estimates & Forecasts, By Product , 2018 - 2030 (USD Billion)
Fig. 18 Disposable Filtering Half Mask Respirator Market Estimates & Forecasts, By Product , 2018 - 2030 (USD Billion)
Fig. 19 Powered Air-Purifying Respirators (PAPR) Market Estimates & Forecasts, By Product , 2018 - 2030 (USD Billion)
Fig. 20 Supplied Air Respirators Market Estimates & Forecasts, By Product , 2018 - 2030 (USD Billion)
Fig. 21 Respiratory Protective Equipment Market Estimates & Forecasts, By End-use: Key Takeaways
Fig. 22 Respiratory Protective Equipment Market Share, By End-use, 2023 & 2030
Fig. 23 Respiratory Protective Equipment Market Estimates & Forecasts, in Oil & Gas, 2018 - 2030 (USD Billion)
Fig. 24 Respiratory Protective Equipment Market Estimates & Forecasts, in Fire Services, 2018 - 2030 (USD Billion)
Fig. 25 Respiratory Protective Equipment Market Estimates & Forecasts, in Industrial, 2018 - 2030 (USD Billion)
Fig. 26 Respiratory Protective Equipment Market Estimates & Forecasts, in Construction, 2018 - 2030 (USD Billion)
Fig. 27 Respiratory Protective Equipment Market Estimates & Forecasts, in Healthcare, 2018 - 2030 (USD Billion)
Fig. 28 Respiratory Protective Equipment Market Estimates & Forecasts, in Mining, 2018 - 2030 (USD Billion)
Fig. 29 Respiratory Protective Equipment Market Estimates & Forecasts, in Others, 2018 - 2030 (USD Billion)
Fig. 30 Respiratory Protective Equipment Market Estimates & Forecasts, By Sales Channel: Key Takeaways
Fig. 31 Respiratory Protective Equipment Market Share, By Sales Channel, 2023 & 2030
Fig. 32 Respiratory Protective Equipment Market Estimates & Forecasts, in Online, 2018 - 2030 (USD Billion)
Fig. 33 Respiratory Protective Equipment Market Estimates & Forecasts, in Offline, 2018 - 2030 (USD Billion)
Fig. 34 North America Respiratory Protective Equipment Market Estimates & Forecasts, 2018 - 2030 (USD Billion)
Fig. 35 Key Company Categorization
Fig. 36 Company Market Positioning
Fig. 37 Key Company Market Share Analysis, 2023
Fig. 38 Strategy Mapping
Market Segmentation
Mesothelioma, or malignant mesothelioma, impacts the protective lining of internal organs, including the heart, lungs, and abdominal cavity. Initial symptoms encompass pleural effusion, leading to breathlessness and pain, often attributed to exposure to abstractors. This exposure predominately transpires in several sectors such as manufacturing, factories, textile mills, construction, power plants, and shipyards. Furthermore, new installation of asbestos-based products is banned. It is used for fire protection and insulation in various establishments in commercial and residential sectors. Manufacturing of asbestos is prohibited in several regions. However, countries such as Mexico, Brazil, Kazakhstan, Thailand, India, and Russia are still witnessing the consumption of asbestos in various industries. The U.K. Health and Safety Executive (HSE) reported that in 2024, over 50% of respiratory illness cases were attributed to SWOD mesothelioma. The mortality rate linked to this cancer, along with asbestos-related cancer issues, is declining, while cold-related incidents show a negative trend. HSE introduced the Control of Asbestos Regulation 2006, establishing control limits and asbestos licensing.
In respiratory protective equipment (RPE) occupational safety regulations play a major role. Mandatory policies by agencies to maintain worker safety in various industries are anticipated to fuel market growth. These regulations elaborate on the type of respiratory protective equipment needed for protection in commercial and industrial processes. The aforementioned favorable regulations are expected to drive respiratory protective equipment market over the forecast period.
Lack of knowledge and lack of supervision are the crucial factor to hamper market growth in the coming years. Healthcare workers have high risk owing to continuous contact with patients in the healthcare centers and clinics. Apart from healthcare industry, other industries such as industrial, mining, construction, and oil & gas are also characterized by high-risk activities that necessitate the use of RPE to reduce workplace fatalities. Other factors such as the absence of stringent guidelines for worker health and high-risk activities are expected to hinder the market growth.
This section will provide insights into the contents included in this respiratory protective equipment market report and help gain clarity on the structure of the report to assist readers in navigating smoothly.
Industry overview
Industry trends
Market drivers and restraints
Market size
Growth prospects
Porter’s analysis
PESTEL analysis
Key market opportunities prioritized
Competitive landscape
Company overview
Financial performance
Product benchmarking
Latest strategic developments
Market size, estimates, and forecast from 2018 to 2030
Market estimates and forecast for product segments up to 2030
Regional market size and forecast for product segments up to 2030
Market estimates and forecast for application segments up to 2030
Regional market size and forecast for application segments up to 2030
Company financial performance
A three-pronged approach was followed for deducing the respiratory protective equipment market estimates and forecasts. The process has three steps: information procurement, analysis, and validation. The whole process is cyclical, and steps repeat until the estimates are validated. The three steps are explained in detail below:
Information procurement: Information procurement is one of the most extensive and important stages in our research process, and quality data is critical for accurate analysis. We followed a multi-channel data collection process for respiratory protective equipment market to gather the most reliable and current information possible.
Analysis: We mine the data collected to establish baselines for forecasting, identify trends and opportunities, gain insight into consumer demographics and drivers, and so much more. We utilized different methods of respiratory protective equipment market data depending on the type of information we’re trying to uncover in our research.
Market Research Efforts: Bottom-up Approach for estimating and forecasting demand size and opportunity, top-down Approach for new product forecasting and penetration, and combined approach of both Bottom-up and Top-down for full coverage analysis.
Value-Chain-Based Sizing & Forecasting: Supply-side estimates for understanding potential revenue through competitive benchmarking, forecasting, and penetration modeling.
Demand-side estimates for identifying parent and ancillary markets, segment modeling, and heuristic forecasting.
Qualitative Functional Deployment (QFD) Modelling for market share assessment.
Market formulation and validation: We mine the data collected to establish baselines for forecasting, identify trends and opportunities, gain insight into consumer demographics and drivers, and so much more. We utilize different methods of data analysis depending on the type of information we’re trying to uncover in our research.
Market Formulation: This step involves the finalization of market numbers. This step on an internal level is designed to manage outputs from the Data Analysis step.
Data Normalization: The final market estimates and forecasts are then aligned and sent to industry experts, in-panel quality control managers for validation.
This step also entails the finalization of the report scope and data representation pattern.
Validation: The process entails multiple levels of validation. All these steps run in parallel, and the study is forwarded for publishing only if all three levels render validated results.
The respiratory protective equipment market was categorized into three segments, namely product (Air Purifying Respirators, Supplied Air Respirators), end-use (Oil & Gas, Fire services, Petrochemical/chemical, Industrial, Pharmaceuticals, Construction, Healthcare, Mining), and region (North America, Europe, Asia Pacific, Central & South America, Middle East & Africa).
The respiratory protective equipment market was segmented into product, end-use, and regions. The demand at a segment level was deduced using a funnel method. Concepts like the TAM, SAM, SOM, etc., were put into practice to understand the demand. We at GVR deploy three methods to deduce market estimates and determine forecasts. These methods are explained below:
Demand estimation of each product across countries/regions summed up to from the total market.
Variable analysis for demand forecast.
Demand estimation via analyzing paid database, and company financials either via annual reports or paid database.
Primary interviews for data revalidation and insight collection.
Used extensively for new product forecasting or analyzing penetration levels.
Tool used invoice product flow and penetration models Use of regression multi-variant analysis for forecasting Involves extensive use of paid and public databases.
Primary interviews and vendor-based primary research for variable impact analysis.
The respiratory protective equipment market was analyzed at a regional level. The global was divided into North America, Europe, Asia Pacific, Central & South America, and Middle East & Africa, keeping in focus variables like consumption patterns, export-import regulations, consumer expectations, etc. These regions were further divided into twenty-two countries, namely, the U.S.; Canada; Mexico; Germany; France; the UK; Italy; Russia; Spain; China; Japan; India; South Korea; Indonesia; Thailand; Australia; Malaysia; Brazil; Argentina; Saudi Arabia; UAE; South Africa.
All three above-mentioned market research methodologies were applied to arrive at regional-level conclusions. The regions were then summed up to form the global market.
The respiratory protective equipment market was analyzed via companies operating in the sector. Analyzing these companies and cross-referencing them to the demand equation helped us validate our assumptions and conclusions. Key market players analyzed include:
3M - 3M, formerly known as the Minnesota Mining and Manufacturing Company. Established in 1902 and is headquartered in Minnesota, U.S. The company has a robust R&D program facility which it uses to deliver innovative products across multiple segments.The company is publicly traded on the New York Stock Exchange with the ticker code MMM. Its products are distributed globally through an extensive distribution network comprising direct and third-party supply channels such as retailers, wholesalers, dealers, distributors, and jobbers.
Alpha Pro Tech Limited - Alpha Pro Tech Limited was incorporated in 1994 and is headquartered in Delaware, U.S.has vertically integrated production centers in Arizona, Utah, and Georgia, which are involved in manufacturing innovative and high-quality products. As of Feb 2021, the company had a total of 115 employees working across its offices.The company operates through three business segments, namely building supply, infection control, and disposable protective apparel.
Ansell Ltd. - Ansell Ltd. was incorporated in 1929 and is headquartered in Melbourne, Australia. The company caters its products and protection solutions to various industries including construction, oil & gas, mining, healthcare, automotive, life sciences, food processing, military, and chemical. Its medical segment offers products such as surgical, medical, examination gloves, and healthcare devices. Industrial segment provides protective solutions such as suits, clothing, gloves and respiratory products. It provides protection equipment & solutions and operates through three business segments, namely industrial, medical, and single-use solutions. As of June 2020, the company had established offices and manufacturing plants across 55 countries, with major corporate hubs in the U.S., Belgium, Malaysia, and Australia, and over 13,513 employees working globally.
Avon Rubber p.l.c. - Avon Rubber p.l.c. was founded in 1885 and is headquartered in Wiltshire, UK. The company caters its products to various industries such as marine, military, defense, and mineral & oil extraction. t offers milking point solutions and chemical, biological, radiological, and nuclear (CBRN) & respiratory protection systems through its two business segments, namely Milkrite/InterPuls and Avon Protection. The company operates globally through its 10 sites and serves over 90 countries. As of December 2018, it had around 800 employees.
Bullard – Bullard is primarily engaged in designing, developing, manufacturing, and marketing personal protective equipment for people working in hazardous conditions. The company was founded in 1898 and is headquartered in Cynthiana, Kentucky, U.S. The company provides emergency responders and industrial health & safety products including thermal imagers, hard hats, and firefighting & rescue helmets, supplied air respirators, powered air-purifying respirators, and air quality equipment to its customers worldwide.
Delta Plus Group - Delta Plus Group is a subsidiary of JBP, which was founded in 1996. The company manufactures safety eyewear and head, face, hearing, and respiratory protection products along with a full line of chainsaw protective clothing. The company was incorporated in 1977 and is headquartered in Apt, France. It has 27 distribution subsidiaries located in France, Italy, Spain, the UK, Turkey, the UAE, China, Brazil, and the U.S. and supplies products to over 90 countries.
DuPont - DuPont (E. I. du Pont de Nemours and Company) was founded in 1802 with its headquarters in Delaware, U.S.The company operates through six segments namely agricultural products, high-performance materials, food & personal care, people & process safety, polymers & fibers and industrial biotechnology. It serves various end-use sectors such as food & beverage, agriculture, electronics & communications, home & construction, safety & protection, packaging & printing, chemicals, marine, mining, energy, apparel, and automotive. It is a multinational conglomerate delivering a wide range of products and services to diverse industries with subsidiaries in over 90 countries and manufacturing units in around 50 countries. As of December 2020, the company had around 34,000 employees working across the globe.
ILC Dover - ILC Dover was established in 1947 and is headquartered in Frederica, Delaware, U.S. The company caters to a wide range of industries including pharmaceutical & biopharmaceutical manufacturing, personal care, food & beverage, chemical, aerospace, and healthcare as well as government agencies. The company is primarily engaged in material development, engineering, design, and manufacturing of flexible containment solutions. It offers its products in five reportable segments including pharma/biopharma, packaging solutions, personal safety, flood protection, and aerospace.
Intech Safety Pvt. Ltd - Intech Safety Pvt. Ltd. offers safety products for personal protection, respiratory protection, and mining applications. It is headquartered in Kolkata, India. It provides hearing protection, head protection, eye protection, and fall protection products including ear plugs, ear muffs, helmets, protective goggles, visors, and harnesses for personal protection.
Kimberly-Clark Corporation - Established in 1872 and is headquartered in Texas, U.S. Kimberly-Clark Corporation is primarily engaged in the manufacturing and marketing of natural or synthetic fiber products using advanced technology.The company maintains a broad global presence as a part of its growth strategy. As of December 2020, it had 84 manufacturing facilities in 34 countries located across the globe. The company had over 46,000 employees as of December 2020.
Supply Side Estimates
Company revenue estimation via referring to annual reports, investor presentations, and Hoover’s.
Segment revenue determination via variable analysis and penetration modeling.
Competitive benchmarking to identify market leaders and their collective revenue shares.
Forecasting via analyzing commercialization rates, pipelines, market initiatives, distribution networks, etc.
Demand side estimates
Identifying parent markets and ancillary markets
Segment penetration analysis to obtain pertinent
revenue/volume
Heuristic forecasting with the help of subject matter experts
Forecasting via variable analysis
Understanding market dynamics (in terms of drivers, restraints, & opportunities) in the countries.
Understanding trends & variables in the individual countries & their impact on growth and using analytical tools to provide high-level insights into the market dynamics and the associated growth pattern.
Understanding market estimates and forecasts (with the base year as 2022, historic information from 2018 to 2021, and forecast from 2023 to 2030). Regional estimates & forecasts for each category are available and are summed up to form the global market estimates.
The report provides market value for the base year 2022 and a yearly forecast till 2030 in terms of revenue/volume or both. The market for each of the segment outlooks has been provided on region & country basis for the above-mentioned forecast period.
The key industry dynamics, major technological trends, and application markets are evaluated to understand their impact on the demand for the forecast period. The growth rates were estimated using correlation, regression, and time-series analysis.
We have used the bottom-up approach for market sizing, analyzing key regional markets, dynamics, & trends for various products and end-users. The total market has been estimated by integrating the country markets.
All market estimates and forecasts have been validated through primary interviews with the key industry participants.
Inflation has not been accounted for to estimate and forecast the market.
Numbers may not add up due to rounding off.
Europe consists of EU-8, Central & Eastern Europe, along with the Commonwealth of Independent States (CIS).
Asia Pacific includes South Asia, East Asia, Southeast Asia, and Oceania (Australia & New Zealand).
Latin America includes Central American countries and the South American continent
Middle East includes Western Asia (as assigned by the UN Statistics Division) and the African continent.
GVR strives to procure the latest and unique information for reports directly from industry experts, which gives it a competitive edge. Quality is of utmost importance to us, therefore every year we focus on increasing our experts’ panel. Primary interviews are one of the critical steps in identifying recent market trends and scenarios. This process enables us to justify and validate our market estimates and forecasts to our clients. With more than 8,000 reports in our database, we have connected with some key opinion leaders across various domains, including healthcare, technology, consumer goods, and the chemical sector. Our process starts with identifying the right platform for a particular type of report, i.e., emails, LinkedIn, seminars, or telephonic conversation, as every report is unique and requires a differentiated approach.
We send out questionnaires to different experts from various regions/ countries, which is dependent on the following factors:
Report/Market scope: If the market study is global, we send questionnaires to industry experts across various regions, including North America, Europe, Asia Pacific, Latin America, and MEA.
Market Penetration: If the market is driven by technological advancements, population density, disease prevalence, or other factors, we identify experts and send out questionnaires based on region or country dominance.
The time to start receiving responses from industry experts varies based on how niche or well-penetrated the market is. Our reports include a detailed chapter on the KoL opinion section, which helps our clients understand the perspective of experts already in the market space.
NEED A CUSTOM REPORT?
We can customize every report - free of charge - including purchasing stand-alone sections or country-level reports, as well as offer affordable discounts for start-ups & universities. Contact us now
We are GDPR and CCPA compliant! Your transaction & personal information is safe and secure. For more details, please read our privacy policy.
"The quality of research they have done for us has been excellent."