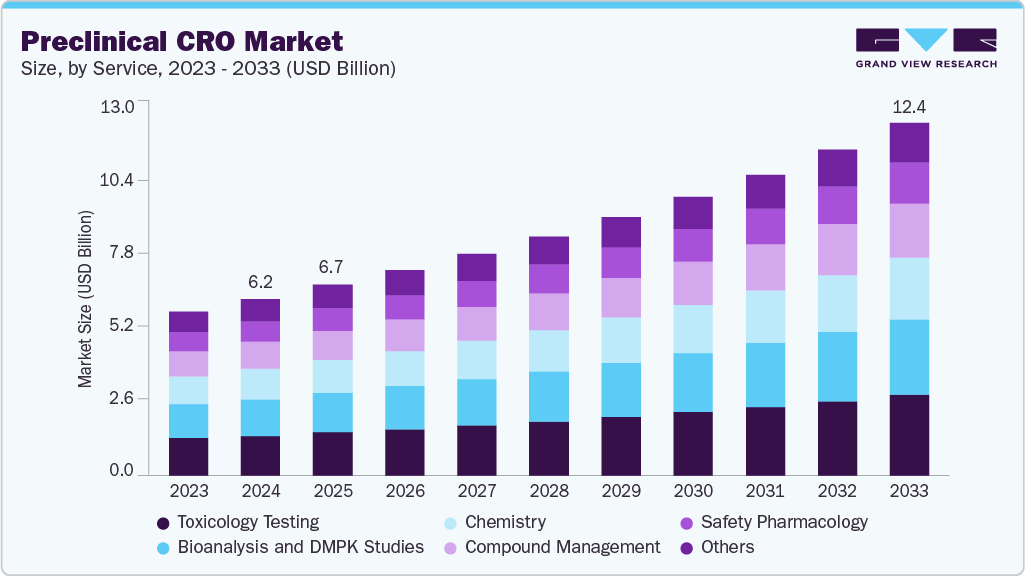
The global preclinical CRO market size was valued at USD 5.72 billion in 2023 and is anticipated to grow at a CAGR of 8.7% from 2024 to 2030. Increased R&D budget for drug development is leading to rising demand for preclinical contract research organization (CRO) services, thus boosting the market growth during the forecast period. The surge in the number of preclinical trials involving large molecules and the growing need to curb R&D expense is expected to contribute to the growing demand for quality preclinical CRO.
With regards to the COVID-19 vaccine, preclinical studies have been performed at an exponential speed, indicative of the overwhelming role of CROs. Increasing spending on CRO services is expected to boost the market growth significantly during the forecast period. The growing demand for drugs post COVID-19 is further contributing to the market growth. Different organizations across the globe have made significant funding for developing therapeutics and medical devices post COVID-19. For instance, the U.S. federal government allocated around USD 2.3 billion towards R&D of mRNA COVID-19 vaccines from the onset of the pandemic in 2020 through March 2022.
Over the years, there has been a significant change in the process of drug approval by the Food and Drug Administration (FDA). Recently, the 21st Century Cures bill was passed in the U.S., which fastened the approval process for the launch of breakthrough drugs and medical devices. These changes in approval processes are expected to drive innovation and are also anticipated to increase demand for preclinical services, thereby contributing to market growth.
Furthermore, demand for CROs is increasing due to rising R&D expenditure and growing focus of pharmaceutical companies on cost containment. Biopharmaceutical companies choose to outsource their early development R&D functions to CROs to reduce product development time and costs. This trend is expected to continue over the forecast period due to the increasing capabilities of CROs to conduct complex research, which enables life sciences companies to reduce R&D expenditure & focus on their core activities.
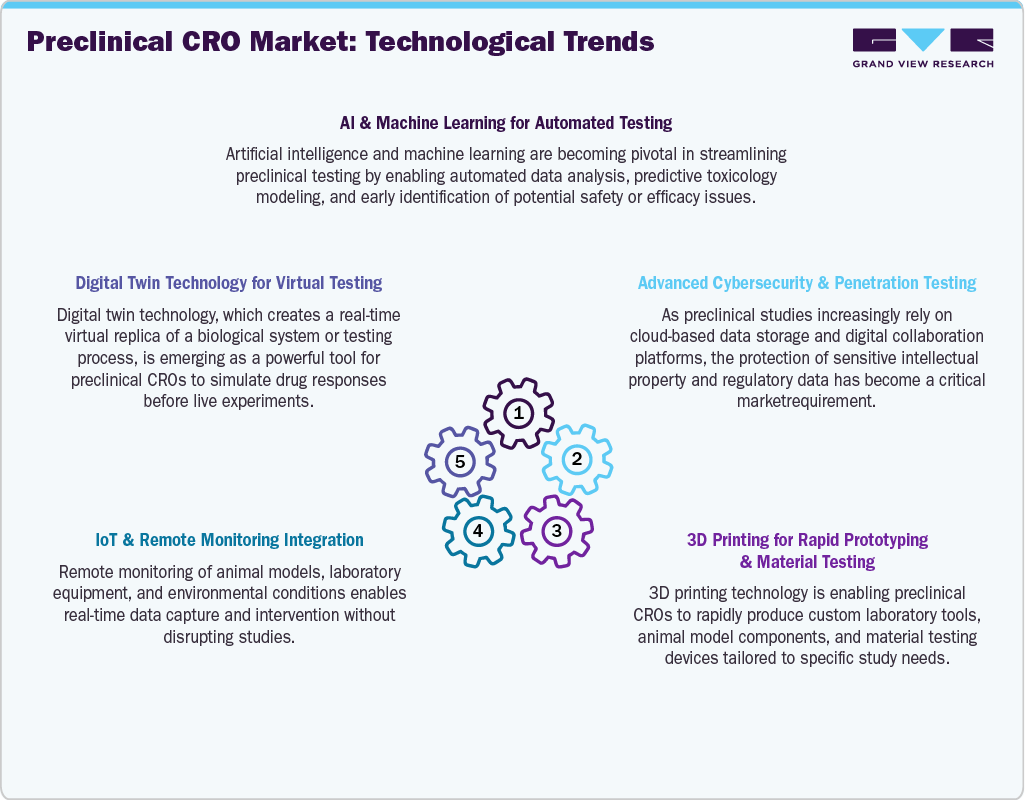
The global preclinical CRO market is characterized by a high degree of innovation, with new technologies and methods. The preclinical CRO industry has witnessed constant progress in drug discovery and development technologies. The effectiveness and precision of preclinical research have increased due to advancements in imaging, genomics, and other analytical methods.
Several market players such as LABCORP, Eurofins scientific se., WuXi AppTec, Inc., and ICON plc are involved in merger and acquisition activities. Through M&A activity, these companies can expand their strengthened market presence and enter new territories.
Innovative techniques and methods are frequently implemented due to regulatory guidelines. In order to stand out in the market, CROs can invest in state-of-the-art technologies that will either meet or beyond regulatory requirements.
The key companies are Establishing partnerships with local CROs, research institutions, or pharmaceutical companies. Local collaborations can facilitate smoother market entry and enhance understanding of regional dynamics.
The toxicology testing segment accounted for the largest revenue share of 25.4% of the global preclinical CRO market in 2023, owing to a rise in outsourcing of noncore preclinical CRO studies and high adoption of toxicology tests. Toxicology is one of the key services, which is being outsourced to CROs owing to the improved capabilities of CROs to conduct toxicology tests. The growing rate of outsourcing noncore preclinical studies to the CROs and the growing capabilities of CROs to offer additional value-added services is expected to propel the growth of this segment during the forecast period.
The bioanalysis and DMPK studies segment is expected to register the fastest CAGR of 9.3% during the forecast period. The segment is expected to witness lucrative growth on account of a rise in the demand for pharmacokinetic services to support toxicology tests for IND-enabling studies. In addition, bioanalysis and DMPK studies are vital in the entire drug development process. They are performed in every stage of the drug development process and are not confined to the preclinical phase. These factors are further contributing to the segment growth.
The Patient Derived Organoid (PDO) Model segment held the largest share of 80.6% in 2023. The growing impact of the patient-derived organoid (PDO) model is due to the use of direct derived cells and tissues from the patient. This helps in personalized healthcare and the specimens can be cryopreserved. For these reasons, they are becoming an essential part of preclinical studies as they help in quicker diagnosis and prognosis of malignancy.
The Patient derived xenograft (PDX) model market has been analyzed to grow at a CAGR of 8.4% during the forecast period. This is attributed to the growing number of CROs maintaining an in-house inventory of immunodeficient mice with patient-derived xenografts (PDXs). Furthermore, this type of analysis allows researchers to co-relate the laboratory research with humans, owing to the maintenance of the original genetic makeup of the tumor cells. Also, the responses observed in clinical trials among patients have been found to correlate with the responses in these patient-derived xenografts, which in turn allows for a better safety profile and thus expedites the approval of New Drug Investigation (NDA).
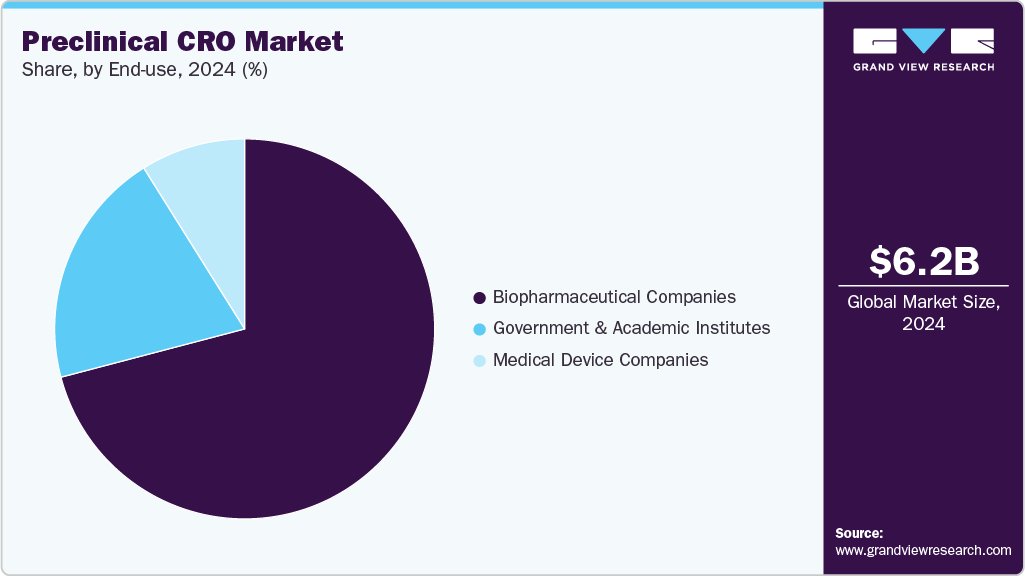
The biopharmaceutical companies segment is expected to hold the largest market share of 80.8% in 2023. The increasing trend of outsourcing end-to-end services among biopharmaceutical companies, especially amongst the small- and mid-size companies that lack sufficient expertise in the preclinical phase of drug development, is expected to boost the demand for preclinical CRO services in the future.
The government and academic institutes segment are estimated to register the fastest growth of 9.1% during the forecast period. Academia and government bodies play a crucial role in the preclinical phase of discovery and development. In addition, an increasing number of academic organizations and government bodies outsourcing preclinical services to CROs will boost the segment growth. Academic institutes are one of the major sources of revenue for big CROs, such as Charles River Laboratories and LabCorp.
North America accounted for the largest share of 47.2% in 2023 owing to the presence of established CROs specializing in early drug discovery, such as Charles River Laboratories and LabCorp. The U.S. is the biggest market for preclinical trial outsourcing, as several biopharmaceutical companies prefer outsourcing their preclinical trials to CROs based in the U.S., to seek benefit from the Investigational New Drug (IND) application, approved by the FDA.
The U.S. accounted for the highest share in the global preclinical trial outsourcing market as a large number of pharmaceutical and life sciences companies are present in this region. CROs in the country possess various capabilities such as genotoxicity and immunotoxicity testing services, which are majorly carried out in the U.S. Along with this, rapid growth in emerging areas of medicine such as personalized medicines, orphan drugs, and biosimilar is expected to propel growth of the preclinical trial outsourcing market in the U.S.
Asia Pacific is also anticipated to grow at the fastest rate of 11.6% during the forecast period. The changing business model of MNC outsourcing and the rising cost of R&D is expected to increase preclinical outsourcing in the Asia Pacific, owing to the cost efficiency offered by CROs in countries such as India and China. Established companies located in Western Europe and the U.S. pursue analytical services, site research development, and clinical activities in the Asia Pacific region in order to reduce the cost associated with research.
Japan is considered to be one of the largest pharmaceutical markets across the globe. The growing pharmaceutical industry in Japan is contributing to the increasing demand for preclinical trial outsourcing. There has been a significant increase in the number of clinical trials being conducted in the country as the Japanese government is undertaking steps to offer regulatory support and promote clinical trials in the country. This is expected to stimulate the market for preclinical services as preclinical testing requires to be conducted in proximity to central development centers.
Preclinical CRO in India:The preclinical CRO market in India has experienced significant growth, driven by its cost advantage, a skilled workforce, and a favorable regulatory environment. Indian CROs offer competitive pricing, attracting international pharmaceutical and biotech companies seeking to outsource preclinical research. Some of the key players operating in the Indian preclinical CRO market are as follows:
The preclinical CRO market has both large, multinational CROs and smaller, specialized CROs. These include Labcorp, Charles River Labs, Eurofins Scientific, and Intertek Group. Preclinical CRO market share depends on several factors such as number of players in the market, service portfolio, therapeutic expertise, geographic reach, innovation & investments, as well as partnerships & collaborations. For instance, key companies such as Covance— Labcorp’s drug development business,provide a comprehensive suite of preclinical services, including pharmacology & safety assessment, vector & cell characterization & qualification, and biodistribution testing & services. These market players also have expertise in specific therapeutic areas or in emerging fields (e.g., immuno-oncology, gene therapy). Combined with a broad geographic reach these companies can offer clients access to diverse patient populations, regulatory environments, and research expertise.
This enables key players to hold a notable share of the market.
The demand for preclinical CRO services is influenced by the overall pharmaceutical and biotechnology industry's research and development pipeline. Increased investments in drug discovery and development are expected to drive demand for preclinical research services.The market dynamics and competition is also influenced by trends in emerging therapeutic areas, such as immuno-oncology, gene therapy, and precision medicine, which may require specialized expertise from CROs. Between 2016 to 2020 for example, Labcorp’s Covancehas conducted 300+ preclinical studies and over 40 clinical trials for cell and gene therapies across the globe.
In March 2023, Crown Bioscience & JSR Life Sciences Company announced starting a new site in Singapore, which will support the company in expanding its capacity for local and global biotech & pharma companies. The site will support companies that engage in preclinical & translational oncology drug discovery and development.
In February 2023, Apax Partners acquired Porsolt, a recognized Global CRO. This partnership will enhance Porsolt’s service offering while expanding its product portfolio & capabilities for drug screening, safety, and efficacy for worldwide consumers.
Report Attribute |
Details |
Market size value in 2024 |
USD 6.21 billion |
Revenue forecast in 2030 |
USD 10.26 billion |
Growth rate |
CAGR of 8.7% from 2024 to 2030 |
Actual data |
2018 - 2023 |
Forecast period |
2024 - 2030 |
Quantitative units |
Revenue in USD Billion and CAGR from 2024 to 2030 |
Report coverage |
Revenue forecast, company ranking, competitive landscape, growth factors, and trends |
Segments covered |
Service, model type, end-use, region |
Regional scope |
North America; Europe; Asia Pacific; Latin America; MEA |
Country scope |
U.S.; Canada; UK; Germany; France; Italy; Spain; Sweden; Norway; Denmark; India, Japan, China, Australia, South Korea, Thailand; Brazil; Mexico; Argentina; South Africa; Saudi Arabia; UAE; Kuwait |
Key companies profiled |
WuXi AppTec, Inc. (WAI); LABCORP; Eurofins scientific se; Medpace holdings inc; Charles River Laboratories International, Inc.; Intertek group plc (igp); SGA SA; PPD (Thermo Fisher Scientific, Inc.); PRA Health Sciences, INC. (ICON plc); CROWN bioscience |
Customization scope |
Free report customization (equivalent up to 8 analyst’s working days) with purchase. Addition or alteration to country, regional & segment scope. |
Pricing and purchase options |
Avail customized purchase options to meet your exact research needs. Explore purchase options |
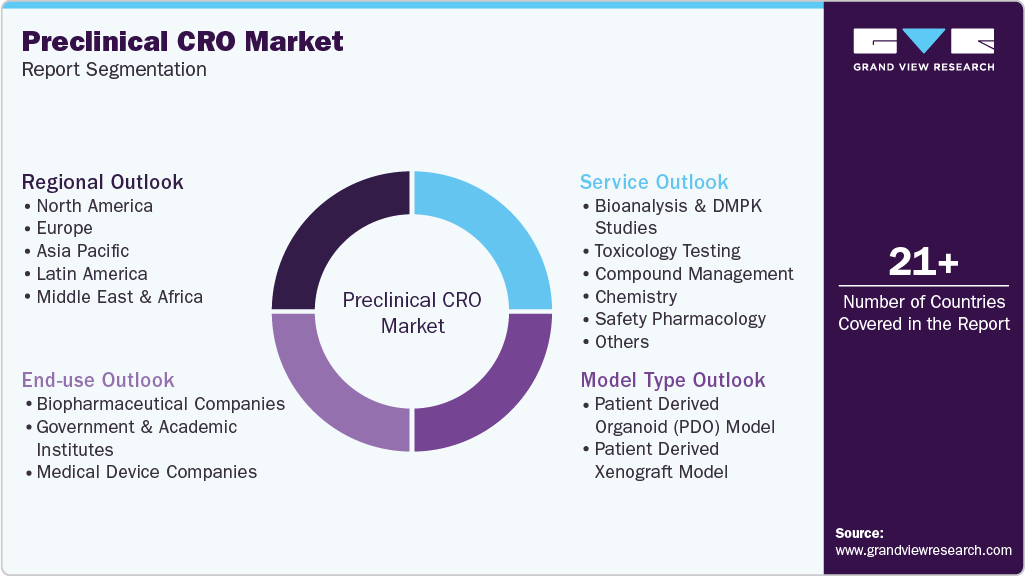
This report forecasts revenue growth and provides an analysis on the latest trends in each of the sub-segments from 2018 to 2030. For the purpose of this report, Grand View Research has segmented the preclinical CRO market based on service, model type, end-use, and region.
Service Outlook (Revenue, USD Billion, 2018 - 2030)
Bioanalysis and DMPK studies
In vitro ADME
In-vivo PK
Toxicology Testing
GLP
Non-GLP
Compound Management
Process R&D
Custom Synthesis
Others
Chemistry
Medicinal Chemistry
Computation Chemistry
Safety Pharmacology
Others
Model Type Outlook (Revenue, USD Billion, 2018 - 2030)
Patient Derived Organoid (PDO) Model
Patient derived xenograft model
End-use Outlook (Revenue, USD Billion, 2018 - 2030)
Biopharmaceutical Companies
Government and Academic Institutes
Medical Device Companies
Regional Outlook (Revenue, USD Billion, 2018 - 2030)
North America
Europe
U.K.
Germany
France
Italy
Spain
Sweden
Norway
Denmark
Asia Pacific
Japan
China
India
South Korea
Australia
Thailand
Latin America
Brazil
Mexico
Argentina
Middle East & Africa
South Africa
Saudi Arabia
UAE
Kuwait
b. The global preclinical CRO market size was estimated at USD 5.28 billion in 2022 and is expected to reach USD 5.72 billion in 2023.
b. The global preclinical CRO market is expected to grow at a compound annual growth rate of 7.8% from 2023 to 2030 to reach USD 9.68 billion by 2030.
b. North America dominated the preclinical CRO market with a share of 47.4% in 2022. This is attributable to increasing R&D and the adoption of new technology in medical devices along with increased availability of skilled human resources.
b. Some key players operating in the preclinical CRO market include SGS SA (SGS); Charles River Laboratories International, Inc.; Eurofins Scientific; PRA Health Sciences, Inc.; Wuxi AppTec; Medpace, Inc.; Pharmaceutical Product Development (PPD), LLC; Intertek Group Plc (IGP); Crown Bioscience and Laboratory Corporation of America, Inc.
b. Key factors that are driving the preclinical CRO market growth include an increasing number of drugs in preclinical phases, economies of production and scale, increasing R&D expenditure.
Table of Contents
Chapter 1 Preclinical CRO Market: Methodology and Scope
1.1 Market Segmentation & Scope
1.1.1 Regional Scope
1.1.2 Estimates And Forecast Timeline
1.2 Research Methodology
1.3 Information Procurement
1.3.1 Purchased Database
1.3.2 Gvr’s Internal Database
1.3.3 Secondary Sources
1.3.4 Primary Research
1.3.5 Details Of Primary Research
1.4 Information Or Data Analysis
1.4.1 Data Analysis Models
1.5 Market Formulation & Validation
1.6 Model Details
1.6.1 Commodity Flow Analysis (Model 1)
1.6.2 Volume Price Analysis (Model 2)
1.7 List of Secondary Sources
1.8 List of Primary Sources
1.9 List of Abbreviations
1.10 Objectives
1.10.1 Objective - 1
1.10.2 Objective - 2
1.10.3 Objective - 3
1.10.4 Objective - 4
Chapter 2 Preclinical CRO Market: Executive Summary
2.1 Market Outlook
Chapter 3 Preclinical CRO Market: Variables, Trends, & Scope
3.1 Segment Outlook
3.2 Market Dynamics
3.2.1 Market Driver Analysis
3.3 Rising R&D offshoring
3.3.1 Rising outsourcing trend
3.3.2 Life sciences companies focusing on their core competencies
3.3.2 Market Restraint Analysis
3.3.2.1 Monitoring issues and lack of standardization
3.4 Preclinical CRO Market Analysis Tools
3.4.1 Porter’s Five Forces Analysis
3.4.2 Industry Analysis Porter’s
3.4.2.1 Competitor rivalry (High)
3.4.2.2 Bargaining power of buyers(high)
3.4.2.3 Bargaining power of suppliers(Low)
3.4.2.4 Threat of substitutes (low)
3.4.2.5 Threat of new entrants (Low)
3.4.3 PESTEL Analysis
3.4.3.1 PESTLE Analysis
3.4.3.1.1 Political And LegaL
3.4.3.1.1.1 Strengths
3.4.3.1.1.2 Weaknesses
3.4.3.1.1.3 Opportunities
3.4.3.1.1.4 Threats
3.4.3.1.2 Economic
3.4.3.1.2.1 Strengths
3.4.3.1.2.2 Weaknesses
3.4.3.1.2.3 Opportunities
3.4.3.1.2.4 Threats
3.4.3.1.3 Social and Environmental
3.4.3.1.3.1 Strengths
3.4.3.1.3.2 Weaknesses
3.4.3.1.3.3 Opportunities
3.4.3.1.3.4 Threats
3.5 COVID-19 Impact Analysis
Chapter 4. Service Business Analysis
4.1. Preclinical CRO Market: Service Movement Analysis
4.2. Bioanalysis and DMPK Studies
4.2.1. Bioanalysis and DMPK Studies Market, 2018 - 2030 (USD Billion)
4.3. In-vitro ADME
4.3.1. In-vitro ADME Market, 2018 - 2030 (USD Billion)
4.4. In-Vivo Pk
4.4.1. In-Vivo Pk Market, 2018 - 2030 (USD Billion)
4.5. Toxicology Testing
4.5.1. Toxicology Testing Market, 2018 - 2030 (USD Billion)
4.5.2. Glp
4.5.2.1. Glp Market, 2018 - 2030 (USD Billion)
4.5.3. Non-Glp
4.5.3.1. Non-Glp Market, 2018 - 2030 (USD Billion)
4.6. Compound Management
4.6.1. Compound Management Companies market, 2018 - 2030 (USD Billion)
4.6.2. Process R&D
4.6.2.1. Process r&D Market, 2018 - 2030 (USD Billion)
4.6.3. Custom Synthesis
4.6.3.1. Custom Synthesis Market, 2018 - 2030 (USD Billion)
4.6.4. Others
4.6.4.1. Others Market, 2018 - 2030 (USD Billion)
4.7. Chemistry
4.7.1. Chemistry Testing Market, 2018 - 2030 (USD Billion)
4.7.2. Medicinal Chemistry
4.7.2.1. Medicinal Chemistry Market, 2018 - 2030 (USD Billion)
4.7.3. Computation Chemistry
4.7.3.1. Computation Chemistry Market, 2018 - 2030 (USD Billion)
4.8. Safety Pharmacology
4.8.1. Safety Pharmacology market, 2018 - 2030 (USD Billion)
4.9. Others
4.9.1. Others market, 2018 - 2030 (USD Billion
Chapter 5. Model Type Business Analysis
5.1. Preclinical CRO Market: Model Type Movement Analysis
5.2. Patient Derived Organoid (PDOs) Models
5.2.1. Patient Derived Organoid (PDOs) Models Market, 2018 - 2030 (USD Billion)
5.3. Patient Derived Xenograft (PDX) Models
5.3.1. Patient Derived Xenograft (PDX) Models Market, 2018 - 2030 (USD Billion)
Chapter 6. End-use Business Analysis
6.1. Preclinical CRO Market: End-use Movement Analysis
6.2. Biopharmaceutical Companies
6.2.1. Biopharmaceutical Companies Market, 2018 - 2030 (USD Billion)
6.3. Government and Academic Institutes
6.3.1. Government and Academic Institutes Validation Market, 2018 - 2030 (USD Billion)
6.4. Medical Device Companies
6.4.1. Medical Device Companies Market, 2018 - 2030 (USD Billion)
Chapter 7. Regional Business Analysis
7.1. Preclinical CROMarket Share By Region, 2023 & 2030
7.2. North America
7.2.1. North America Preclinical CRO Market, 2018 - 2030 (USD Billion)
7.2.2. U.S.
7.2.2.1. Key Country Dynamics
7.2.2.2. Regulatory Framework
7.2.2.3. Competitive Scenario
7.2.2.4. U.S. Preclinical CRO Market, 2018 - 2030 (USD Billion)
7.2.3. Canada
7.2.3.1. Key Country Dynamics
7.2.3.2. Regulatory Framework
7.2.3.3. Competitive Scenario
7.2.3.4. Canada Preclinical CRO Market, 2018 - 2030 (USD Billion)
7.3. Europe
7.3.1. Europe Preclinical CRO Market, 2018 - 2030 (USD Billion)
7.3.2. UK
7.3.2.1. Key Country Dynamics
7.3.2.2. Competitive Scenario
7.3.2.3. UK Preclinical CRO Market, 2018 - 2030 (USD Billion)
7.3.3. Germany
7.3.3.1. Key Country Dynamics
7.3.3.2. Competitive Scenario
7.3.3.3. Germany Preclinical CRO Market, 2018 - 2030 (USD Billion)
7.3.4. France
7.3.4.1. Key Country Dynamics
7.3.4.2. Competitive Scenario
7.3.4.3. France Preclinical CRO Market, 2018 - 2030 (USD Billion)
7.3.5. Italy
7.3.5.1. Key Country Dynamics
7.3.5.2. Competitive Scenario
7.3.5.3. Italy Preclinical CRO Market, 2018 - 2030 (USD Billion)
7.3.6. Spain
7.3.6.1. Key Country Dynamics
7.3.6.2. Competitive Scenario
7.3.6.3. Spain Preclinical CRO Market, 2018 - 2030 (USD Billion)
7.3.7. Sweden
7.3.7.1. Key Country Dynamics
7.3.7.2. Competitive Scenario
7.3.7.3. Sweden Preclinical CRO Market, 2018 - 2030 (USD Billion)
7.3.8. Norway
7.3.8.1. Key Country Dynamics
7.3.8.2. Competitive Scenario
7.3.8.3. Norway Preclinical CRO Market, 2018 - 2030 (USD Billion)
7.3.9. Denmark
7.3.9.1. Key Country Dynamics
7.3.9.2. Competitive Scenario
7.3.9.3. Denmark Preclinical CRO Market, 2018 - 2030 (USD Billion)
7.4. Asia Pacific
7.4.1. Asia Pacific Preclinical CRO Market, 2018 - 2030 (USD Billion)
7.4.2. Japan
7.4.2.1. Key Country Dynamics
7.4.2.2. Competitive Scenario
7.4.2.3. Japan Preclinical CRO Market, 2018 - 2030 (USD Billion)
7.4.3. China
7.4.3.1. Key Country Dynamics
7.4.3.2. Competitive Scenario
7.4.3.3. China Preclinical CRO Market, 2018 - 2030 (USD Billion)
7.4.4. India
7.4.4.1. Key Country Dynamics
7.4.4.2. Competitive Scenario
7.4.4.3. List of Preclinical CRO in India
7.4.4.4. India Preclinical CRO Market, 2018 - 2030 (USD Billion)
7.4.5. Australia
7.4.5.1. Key Country Dynamics
7.4.5.2. Competitive Scenario
7.4.5.3. Australia Preclinical CRO Market, 2018 - 2030 (USD Billion)
7.4.6. South Korea
7.4.6.1. Key Country Dynamics
7.4.6.2. Competitive Scenario
7.4.6.3. South Korea Preclinical CRO Market, 2018 - 2030 (USD Billion)
7.4.7. Thailand
7.4.7.1. Key Country Dynamics
7.4.7.2. Competitive Scenario
7.4.7.3. Thailand Preclinical CRO Market, 2018 - 2030 (USD Billion)
7.5. Latin America
7.5.1. Latin America Preclinical CRO Market, 2018 - 2030 (USD Billion)
7.5.2. Brazil
7.5.2.1. Key Country Dynamics
7.5.2.2. Competitive Scenario
7.5.2.3. Brazil Preclinical CRO Market, 2018 - 2030 (USD Billion)
7.5.3. Mexico
7.5.3.1. Key Country Dynamics
7.5.3.2. Competitive Scenario
7.5.3.3. Mexico Preclinical CRO Market, 2018 - 2030 (USD Billion)
7.5.4. Argentina
7.5.4.1. Key Country Dynamics
7.5.4.2. Competitive Scenario
7.5.4.3. Argentina Preclinical CRO Market, 2018 - 2030 (USD Billion)
7.6. MEA
7.6.1. MEA Preclinical CRO Market, 2018 - 2030 (USD Billion)
7.6.2. South Africa
7.6.2.1. Key Country Dynamics
7.6.2.2. Competitive Scenario
7.6.2.3. South Africa Preclinical CRO Market, 2018 - 2030 (USD Billion)
7.6.3. Saudi Arabia
7.6.3.1. Key Country Dynamics
7.6.3.2. Competitive Scenario
7.6.3.3. Saudi Arabia Preclinical CRO Market, 2018 - 2030 (USD Billion)
7.6.4. UAE
7.6.4.1. Key Country Dynamics
7.6.4.2. Competitive Scenario
7.6.4.3. UAE Preclinical CRO Market, 2018 - 2030 (USD Billion)
7.6.5. Kuwait
7.6.5.1. Key Country Dynamics
7.6.5.2. Competitive Scenario
7.6.5.3. Kuwait Preclinical CRO Market, 2018 - 2030 (USD Billion)
Chapter 8. Competitive Landscape
8.1. Company Categorization
8.2. Strategy Mapping
8.2.1. Merger& Acquisition
8.2.2. Collaborations
8.2.3. New Product Launch
8.3. Participant’s overview
8.3.1. WuXi AppTec, Inc. (WAI)
8.3.1.1. Overview
8.3.1.2. Financial Performance
8.3.1.3. Product Benchmarking
8.3.1.4. Strategic Initiatives
8.3.2. LABCORP
8.3.2.1. Overview
8.3.2.2. Financial Performance
8.3.2.3. Product Benchmarking
8.3.2.4. Strategic Initiatives
8.3.3. Eurofins scientific se
8.3.3.1. Overview
8.3.3.2. Financial Performance
8.3.3.3. Product Benchmarking
8.3.3.4. Strategic Initiatives
8.3.4. Medpace holdings inc.
8.3.4.1. Overview
8.3.4.2. Financial Performance
8.3.4.3. Product Benchmarking
8.3.4.4. Strategic Initiatives
8.3.5. Charles River Laboratories International, Inc.
8.3.5.1. Overview
8.3.5.2. Financial Performance
8.3.5.3. Product Benchmarking
8.3.5.4. Strategic Initiatives
8.3.6. Intertek group plc
8.3.6.1. Overview
8.3.6.2. Financial Performance
8.3.6.3. Product Benchmarking
8.3.6.4. Strategic Initiatives
8.3.7. SGA SA
8.3.7.1. Overview
8.3.7.2. Financial Performance
8.3.7.3. Product Benchmarking
8.3.7.4. Strategic Initiatives
8.3.8. PPD (THERMO FISHER SCIENTIFIC, INC.)
8.3.8.1. Overview
8.3.8.2. Financial Performance
8.3.8.3. Product Benchmarking
8.3.8.4. Strategic Initiatives
8.3.9. PRA Health Sciences, INC. (ICON plc)
8.3.9.1. Overview
8.3.9.2. Financial Performance
8.3.9.3. Product Benchmarking
8.3.9.4. Strategic Initiatives
8.3.10. CROWN bioscience
8.3.10.1. Overview
8.3.10.2. Financial Performance
8.3.10.3. Product Benchmarking
8.3.10.4. Strategic Initiatives
List of Tables
Table 1. List of Secondary Sources
Table 2. List of Abbreviations
Table 3. Global Preclinical CRO Market by Service, 2018 - 2030 (USD Billion)
Table 4. Global Preclinical CRO Market by Model Type, 2018 - 2030 (USD Billion)
Table 5. Global Preclinical CRO Market by End-use, 2018 - 2030 (USD Billion)
Table 6. Global Preclinical CRO Market by Region, 2018 - 2030 (USD Billion)
Table 7. North America Preclinical CRO Market by Country, 2018 - 2030 (USD Billion)
Table 8. North America Preclinical CRO Market by Service, 2018 - 2030 (USD Billion)
Table 9. North America Preclinical CRO Market by Model Type, 2018 - 2030 (USD Billion)
Table 10. North America Preclinical CRO Market by End-use, 2018 - 2030 (USD Billion)
Table 11. U.S. Preclinical CRO Market by Service, 2018 - 2030 (USD Billion)
Table 12. U.S. Preclinical CRO Market by Model Type, 2018 - 2030 (USD Billion)
Table 13. U.S. Preclinical CRO Market by End-use, 2018 - 2030 (USD Billion)
Table 14. Canada Preclinical CRO Market by Service, 2018 - 2030 (USD Billion)
Table 15. Canada Preclinical CRO Market by Model Type, 2018 - 2030 (USD Billion)
Table 16. Canada Preclinical CRO Market by End-use, 2018 - 2030 (USD Billion)
Table 17. Europe Preclinical CRO Market by Country, 2018 - 2030 (USD Billion)
Table 18. Europe Preclinical CRO Market by Service, 2018 - 2030 (USD Billion)
Table 19. Europe Preclinical CRO Market by Model Type, 2018 - 2030 (USD Billion)
Table 20. Europe Preclinical CRO Market by End-use, 2018 - 2030 (USD Billion)
Table 21. Germany Preclinical CRO Market by Service, 2018 - 2030 (USD Billion)
Table 22. Germany Preclinical CRO Market by Model Type, 2018 - 2030 (USD Billion)
Table 23. Germany Preclinical CRO Market by End-use, 2018 - 2030 (USD Billion)
Table 24. UK Preclinical CRO Market by Service, 2018 - 2030 (USD Billion)
Table 25. UK Preclinical CRO Market by Model Type, 2018 - 2030 (USD Billion)
Table 26. UK Preclinical CRO Market by End-use, 2018 - 2030 (USD Billion)
Table 27. France Preclinical CRO Market by Service, 2018 - 2030 (USD Billion)
Table 28. France Preclinical CRO Market by Model Type, 2018 - 2030 (USD Billion)
Table 29. France Preclinical CRO Market by End-use, 2018 - 2030 (USD Billion)
Table 30. Italy Preclinical CRO Market by Service, 2018 - 2030 (USD Billion)
Table 31. Italy Preclinical CRO Market by Model Type, 2018 - 2030 (USD Billion)
Table 32. Italy Preclinical CRO Market by End-use, 2018 - 2030 (USD Billion)
Table 33. Spain Preclinical CRO Market by Service, 2018 - 2030 (USD Billion)
Table 34. Spain Preclinical CRO Market by Model Type, 2018 - 2030 (USD Billion)
Table 35. Spain Preclinical CRO Market by End-use, 2018 - 2030 (USD Billion)
Table 36. Denmark Preclinical CRO Market by Service, 2018 - 2030 (USD Billion)
Table 37. Denmark Preclinical CRO Market by Model Type, 2018 - 2030 (USD Billion)
Table 38. Denmark Preclinical CRO Market by End-use, 2018 - 2030 (USD Billion)
Table 39. Sweden Preclinical CRO Market by Service, 2018 - 2030 (USD Billion)
Table 40. Sweden Preclinical CRO Market by Model Type, 2018 - 2030 (USD Billion)
Table 41. Sweden Preclinical CRO Market by End-use, 2018 - 2030 (USD Billion)
Table 42. Norway Preclinical CRO Market by Service, 2018 - 2030 (USD Billion)
Table 43. Norway Preclinical CRO Market by Model Type, 2018 - 2030 (USD Billion)
Table 44. Norway Preclinical CRO Market by End-use, 2018 - 2030 (USD Billion)
Table 45. Asia Pacific Preclinical CRO Market by Country, 2018 - 2030 (USD Billion)
Table 46. Asia Pacific Preclinical CRO Market by Service, 2018 - 2030 (USD Billion)
Table 47. Asia Pacific Preclinical CRO Market by Model Type, 2018 - 2030 (USD Billion)
Table 48. Asia Pacific Preclinical CRO Market by End-use, 2018 - 2030 (USD Billion)
Table 49. China Preclinical CRO Market by Service, 2018 - 2030 (USD Billion)
Table 50. China Preclinical CRO Market by Model Type, 2018 - 2030 (USD Billion)
Table 51. China Preclinical CRO Market by End-use, 2018 - 2030 (USD Billion)
Table 52. Japan Preclinical CRO Market by Service, 2018 - 2030 (USD Billion)
Table 53. Japan Preclinical CRO Market by Model Type, 2018 - 2030 (USD Billion)
Table 54. Japan Preclinical CRO Market by End-use, 2018 - 2030 (USD Billion)
Table 55. India Preclinical CRO Market by Service, 2018 - 2030 (USD Billion)
Table 56. India Preclinical CRO Market by Model Type, 2018 - 2030 (USD Billion)
Table 57. India Preclinical CRO Market by End-use, 2018 - 2030 (USD Billion)
Table 58. South Korea Preclinical CRO Market by Service, 2018 - 2030 (USD Billion)
Table 59. South Korea Preclinical CRO Market by Model Type, 2018 - 2030 (USD Billion)
Table 60. South Korea Preclinical CRO Market by End-use, 2018 - 2030 (USD Billion)
Table 61. Australia Preclinical CRO Market by Service, 2018 - 2030 (USD Billion)
Table 62. Australia Preclinical CRO Market by Model Type, 2018 - 2030 (USD Billion)
Table 63. Australia Preclinical CRO Market by End-use, 2018 - 2030 (USD Billion)
Table 64. Thailand Preclinical CRO Market by Service, 2018 - 2030 (USD Billion)
Table 65. Thailand Preclinical CRO Market by Model Type, 2018 - 2030 (USD Billion)
Table 66. Thailand Preclinical CRO Market by End-use, 2018 - 2030 (USD Billion)
Table 67. Latin America Preclinical CRO Market by Country, 2018 - 2030 (USD Billion)
Table 68. Latin America Preclinical CRO Market by Service, 2018 - 2030 (USD Billion)
Table 69. Latin America Preclinical CRO Market by Model Type, 2018 - 2030 (USD Billion)
Table 70. Latin America Preclinical CRO Market by End-use, 2018 - 2030 (USD Billion)
Table 71. Brazil Preclinical CRO Market by Service, 2018 - 2030 (USD Billion)
Table 72. Brazil Preclinical CRO Market by Model Type, 2018 - 2030 (USD Billion)
Table 73. Brazil Preclinical CRO Market by End-use, 2018 - 2030 (USD Billion)
Table 74. Mexico Preclinical CRO Market by Service, 2018 - 2030 (USD Billion)
Table 75. Mexico Preclinical CRO Market by Model Type, 2018 - 2030 (USD Billion)
Table 76. Mexico Preclinical CRO Market by End-use, 2018 - 2030 (USD Billion)
Table 77. Argentina Preclinical CRO Market by Service, 2018 - 2030 (USD Billion)
Table 78. Argentina Preclinical CRO Market by Model Type, 2018 - 2030 (USD Billion)
Table 79. Argentina Preclinical CRO Market by End-use, 2018 - 2030 (USD Billion)
Table 80. Middle East & Africa Preclinical CRO Market by Country, 2018 - 2030 (USD Billion)
Table 81. Middle East & Africa Preclinical CRO Market by Service, 2018 - 2030 (USD Billion)
Table 82. Middle East & Africa Preclinical CRO Market by Model Type, 2018 - 2030 (USD Billion)
Table 83. Middle East & Africa Preclinical CRO Market by End-use, 2018 - 2030 (USD Billion)
Table 84. South Africa Preclinical CRO Market by Service, 2018 - 2030 (USD Billion)
Table 85. South Africa Preclinical CRO Market by Model Type, 2018 - 2030 (USD Billion)
Table 86. South Africa Preclinical CRO Market by End-use, 2018 - 2030 (USD Billion)
Table 87. Saudi Arabia Preclinical CRO Market by Service, 2018 - 2030 (USD Billion)
Table 88. Saudi Arabia Preclinical CRO Market by Model Type, 2018 - 2030 (USD Billion)
Table 89. Saudi Arabia Preclinical CRO Market by End-use, 2018 - 2030 (USD Billion)
Table 90. UAE Preclinical CRO Market by Service, 2018 - 2030 (USD Billion)
Table 91. UAE Preclinical CRO Market by Model Type, 2018 - 2030 (USD Billion)
Table 92. UAE Preclinical CRO Market by End-use, 2018 - 2030 (USD Billion)
Table 93. Kuwait Preclinical CRO Market by Service, 2018 - 2030 (USD Billion)
Table 94. Kuwait Preclinical CRO Market by Model Type, 2018 - 2030 (USD Billion)
Table 95. Kuwait Preclinical CRO Market by End-use, 2018 - 2030 (USD Billion)
List of Figures
Fig. 1 Market research process
Fig. 2 Information procurement
Fig. 3 Primary research pattern
Fig. 4 Market research approaches
Fig. 5 Market formulation & validation
Fig. 6 Commodity flow analysis
Fig. 7 Volume price analysis
Fig. 8 Preclinical CRO market snapshot (2021) (USD Billion)
Fig. 9 Preclinical CRO market segmentation
Fig. 10 Penetration & growth prospect mapping
Fig. 11 Market driver relevance analysis (Current & future impact)
Fig. 12 Market restraint relevance analysis (Current & future impact)
Fig. 13 Porter’s five forces analysis
Fig. 14 SWOT analysis, by factor (political & legal, economic and technological)
Fig. 15 Preclinical CRO market service outlook: Segment dashboard
Fig. 16 Preclinical CRO market: Service movement analysis
Fig. 17 Bioanalysis and DMPK studies market, 2018 - 2030 (USD Billion)
Fig. 18 In-vitro ADME market, 2018 - 2030 (USD Billion)
Fig. 19 In-vivo PK market, 2018 - 2030 (USD Billion)
Fig. 20 Toxicology testing market, 2018 - 2030 (USD Billion)
Fig. 21 GLP market, 2018 - 2030 (USD Billion)
Fig. 22 Non-GLP market, 2018 - 2030 (USD Billion)
Fig. 23 Non-mammalian source market, 2018 - 2030 (USD Billion)
Fig. 24 Process R&D market, 2018 - 2030 (USD Billion)
Fig. 25 Custom synthesis market, 2018 - 2030 (USD Billion)
Fig. 26 Others market, 2018 - 2030 (USD Billion)
Fig. 27 Chemistry market, 2018 - 2030 (USD Billion)
Fig. 28 Medicinal chemistry market, 2018 - 2030 (USD Billion)
Fig. 29 Computation chemistry market, 2018 - 2030 (USD Billion)
Fig. 30 Safety pharmacology market, 2018 - 2030 (USD Billion)
Fig. 31 Others market, 2018 - 2030 (USD Billion)
Fig. 32 Preclinical CRO market model type outlook: Segment dashboard
Fig. 33 Preclinical CRO market: Model type movement analysis
Fig. 34 Patient derived organoid (PDO) models market, 2018 - 2030 (USD Billion)
Fig. 35 Patient derived xenograft (PDX) models market, 2018 - 2030 (USD Billion)
Fig. 36 Preclinical CRO market end-use outlook: Segment dashboard
Fig. 37 Preclinical CRO market: End-use movement analysis
Fig. 38 Biopharmaceutical companies’ market, 2018 - 2030 (USD Billion)
Fig. 39 Government and academic institutes market, 2018 - 2030 (USD Billion)
Fig. 40 Medical device companies’ market, 2018 - 2030 (USD Billion)
Fig. 41 Regional market: Key takeaways
Fig. 42 Regional outlook, 2021 & 2030
Fig. 43 North America market, 2018 - 2030 (USD Billion)
Fig. 44 U.S. market, 2018 - 2030 (USD Billion)
Fig. 45 Canada market, 2018 - 2030 (USD Billion)
Fig. 46 Europe market, 2018 - 2030 (USD Billion)
Fig. 47 UK market, 2018 - 2030 (USD Billion)
Fig. 48 Germany market, 2018 - 2030 (USD Billion)
Fig. 49 France market, 2018 - 2030 (USD Billion)
Fig. 50 Italy market, 2018 - 2030 (USD Billion)
Fig. 51 Spain market, 2018 - 2030 (USD Billion)
Fig. 52 Denmark market, 2018 - 2030 (USD Billion)
Fig. 53 Sweden market, 2018 - 2030 (USD Billion)
Fig. 54 Norway market, 2018 - 2030 (USD Billion)
Fig. 55 Asia Pacific market, 2018 - 2030 (USD Billion)
Fig. 56 Japan market, 2018 - 2030 (USD Billion)
Fig. 57 China market, 2018 - 2030 (USD Billion)
Fig. 58 India market, 2018 - 2030 (USD Billion)
Fig. 59 Australia market, 2018 - 2030 (USD Billion)
Fig. 60 Thailand market, 2018 - 2030 (USD Billion)
Fig. 61 South Korea market, 2018 - 2030 (USD Billion)
Fig. 62 Latin America market, 2018 - 2030 (USD Billion)
Fig. 63 Brazil market, 2018 - 2030 (USD Billion)
Fig. 64 Mexico market, 2018 - 2030 (USD Billion)
Fig. 65 Argentina market, 2018 - 2030 (USD Billion)
Fig. 66 MEA market, 2018 - 2030 (USD Billion)
Fig. 67 South Africa market, 2018 - 2030 (USD Billion)
Fig. 68 Saudi Arabia market, 2018 - 2030 (USD Billion)
Fig. 69 UAE market, 2018 - 2030 (USD Billion)
Fig. 70 Kuwait Arabia market, 2018 - 2030 (USD Billion)
Market Segmentation
The geographic distribution of R&D activities is slowly shifting from developed nations to emerging countries. Rising R&D expenditure coupled with an increase in failure rates of R&D activities has caused biopharmaceutical companies to prefer regions such as Central and Eastern Europe, Asia Pacific, and Latin America & Middle East for ensuring cost saving and quick patient recruitment. Outsourcing of preclinical trials to regions such as Asia Pacific also provides greater economic benefits to biopharmaceutical companies. Governments of countries such as the UK, Singapore, and China are allocating funds to promote biomedical research in this region. For instance, in October 2022, the UK government declared that more than USD 1,018 million (GBP 800 million) of funding will be provided to the National Institute for Health and Care Research (NIHR) to support specialized research facilities that bring together scientists to foster an environment conducive to the advancement of experimental medicine and patient safety research.
Demand for CROs is increasing due to rising R&D expenditure and the growing focus of pharmaceutical companies on cost containment. Biopharmaceutical companies choose to outsource their early development R&D functions to CROs to reduce product development time and costs. This trend is expected to continue over the forecast period due to the increasing capabilities of CROs to conduct complex research, which enables life sciences companies to reduce R&D expenditure & focus on their core activities. In addition, collaborations of biopharmaceutical companies with CROs are expected to positively impact the global preclinical CRO market. For instance, in August 2021, Eurofins Scientific partnered with Fusion Antibodies; this partnership is aimed at providing the best antibodies for a wide range of diseases. The partnership agreement is for 2 years and involves the usage of advanced technology.
The growth of the preclinical CRO market is restrained due to issues in the management and monitoring of trials and the inability to exert complete control over trials. Sometimes, CROs are unable to deliver efficient results as expected by life sciences companies, as they try to maximize profits by cutting costs. This may result in several challenges such as trial failures and compliance issues. Furthermore, there is a lack of standardization as not all CROs comply with international regulatory requirements such as Good Laboratory Practice (GLP) standards, which may lead to several quality issues. Therefore, biopharmaceutical and medical device companies generally outsource only lower-end functions of preclinical trials to CROs, whereas high-end tests such as genotoxicity analysis are generally performed in-house. However, improvement in quality standards adopted by CROs is expected to overcome the standardization challenge as outsourced vendors are currently trying to comply with the international standards set by regulatory authorities such as the U.S. FDA and the European Medicines Agency (EMA). Such actions by CROs are expected to improve the standardization of preclinical activities in the long term.
This section will provide insights into the contents included in this preclinical CRO market report and help gain clarity on the structure of the report to assist readers in navigating smoothly.
Industry overview
Industry trends
Market drivers and restraints
Market size
Growth prospects
Porter’s analysis
PESTEL analysis
Key market opportunities prioritized
Competitive landscape
Company overview
Financial performance
Product benchmarking
Latest strategic developments
Market size, estimates, and forecast from 2018 to 2030
Market estimates and forecast for product segments up to 2030
Regional market size and forecast for product segments up to 2030
Market estimates and forecast for application segments up to 2030
Regional market size and forecast for application segments up to 2030
Company financial performance
A three-pronged approach was followed for deducing the preclinical CRO market estimates and forecasts. The process has three steps: information procurement, analysis, and validation. The whole process is cyclical, and steps repeat until the estimates are validated. The three steps are explained in detail below:
Information procurement: Information procurement is one of the most extensive and important stages in our research process, and quality data is critical for accurate analysis. We followed a multi-channel data collection process for preclinical CRO market to gather the most reliable and current information possible.
Analysis: We mine the data collected to establish baselines for forecasting, identify trends and opportunities, gain insight into consumer demographics and drivers, and so much more. We utilized different methods of preclinical CRO market data depending on the type of information we’re trying to uncover in our research.
Market Research Efforts: Bottom-up Approach for estimating and forecasting demand size and opportunity, top-down Approach for new product forecasting and penetration, and combined approach of both Bottom-up and Top-down for full coverage analysis.
Value-Chain-Based Sizing & Forecasting: Supply-side estimates for understanding potential revenue through competitive benchmarking, forecasting, and penetration modeling.
Demand-side estimates for identifying parent and ancillary markets, segment modeling, and heuristic forecasting.
Qualitative Functional Deployment (QFD) Modelling for market share assessment.
Market formulation and validation: We mine the data collected to establish baselines for forecasting, identify trends and opportunities, gain insight into consumer demographics and drivers, and so much more. We utilize different methods of data analysis depending on the type of information we’re trying to uncover in our research.
Market Formulation: This step involves the finalization of market numbers. This step on an internal level is designed to manage outputs from the Data Analysis step.
Data Normalization: The final market estimates and forecasts are then aligned and sent to industry experts, in-panel quality control managers for validation.
This step also entails the finalization of the report scope and data representation pattern.
Validation: The process entails multiple levels of validation. All these steps run in parallel, and the study is forwarded for publishing only if all three levels render validated results.
The preclinical CRO market was categorized into four segments, namely service (Bioanalysis and DMPK studies, Toxicology Testing, Compound Management, Chemistry, Safety Pharmacology), model type (Patient Derived Organoid Model, Patient derived xenograft model), end-use (Biopharmaceutical Companies, Government and Academic Institutes, Medical Device Companies), and region (North America, Europe, Asia Pacific, Latin America, and Middle East & Africa)
The preclinical CRO market was segmented into service, model type, end-use, and regions. The demand at a segment level was deduced using a funnel method. Concepts like the TAM, SAM, SOM, etc., were put into practice to understand the demand. We at GVR deploy three methods to deduce market estimates and determine forecasts. These methods are explained below:
Demand estimation of each product across countries/regions summed up to from the total market.
Variable analysis for demand forecast.
Demand estimation via analyzing paid database, and company financials either via annual reports or paid database.
Primary interviews for data revalidation and insight collection.
Used extensively for new product forecasting or analyzing penetration levels.
Tool used invoice product flow and penetration models Use of regression multi-variant analysis for forecasting Involves extensive use of paid and public databases.
Primary interviews and vendor-based primary research for variable impact analysis.
The preclinical CRO market was analyzed at a regional level. The globe was divided into North America, Europe, Asia Pacific, Latin America, and Middle East & Africa, keeping in focus variables like consumption patterns, export-import regulations, consumer expectations, etc. These regions were further divided into twenty-seven countries, namely, the U.S.; Canada; Germany; the UK; France; Italy; Spain; Denmark; Sweden; Norway; China; Japan; India; Singapore; Philippines; Indonesia; Malaysia; Australia; Thailand; South Korea; Brazil; Mexico; Argentina; South Africa; Saudi Arabia; UAE; Kuwait.
All three above-mentioned market research methodologies were applied to arrive at regional-level conclusions. The regions were then summed up to form the global market.
The preclinical CRO market was analyzed via companies operating in the sector. Analyzing these companies and cross-referencing them to the demand equation helped us validate our assumptions and conclusions. Key market players analyzed include:
WuXi AppTec (WAI) - WuXi AppTec, Inc. (WAI) is the provider of contract research & development outsourcing services for medical device, biotechnology, and pharmaceutical companies. Its pharmaceutical services include safety pharmacology, pharmacokinetics, bio-analysis, drug metabolism, and medicinal & analytical chemistry. WAI also offers biocompatibility testing, pre-clinical services, toxicology testing, package & validation testing, genetic toxicology, and material characterization services. It operates as a subsidiary of WuXi PharmaTech (Cayman) Inc. WAI has a strategic collaboration with REGENXBIO Inc., and MedImmune, LLC, and has a medical device testing center in China.
Labcorp - In 1995, the merger of National Health Laboratory Holdings, Inc. and Roche Biomedical Laboratories, Inc. created Laboratory Corporation of America Holdings (LabCorp). It is involved in the development of genetic test solutions based on microarray, NGS, and PCR technology. The company serves more than 220,000 clients across 60 countries. Its clients include hospitals, physicians, employers, governmental agencies, and other independent clinical laboratories. Its diagnostic business segment offers gene-based tests for HIV drug-resistance assays, HPV, and molecular genetic testing for cystic fibrosis. It provides a menu of over 4,700 tests in the areas of diagnostic genetics, allergies, cardiovascular diseases, coagulation, women's health, oncology, endocrinology, infectious diseases, pain management, toxicology, and pharmacogenetics. This company has a geographical presence in 100 countries.
Eurofins Scientific SE - Eurofins Scientific SE (Eurofins) is a provider of pre-clinical services across the globe. Eurofins has a portfolio of 150,000 analytical methods for the evaluation of composition, authenticity, and purity of biological substances. It also provides agro-testing, consumer product testing, environment testing, medical device testing, and chemical registration & authorization services. Eurofins caters its portfolio of services to pharmaceutical, consumer products, food, and the environment with a network of 375 laboratories in 44 countries.
Medpace Holdings, Inc. - Medpace Holdings Inc. (Medpace) is a contract research organization that provides clinical development services for pharmaceutical, biologics, and medical device companies. The company’s clinical development services include management of medical & global regulatory affairs, clinical trial management, medical writing, pharmacovigilance, and core laboratory & quality assurance services. Its regulatory affairs services include regulatory strategies for early-stage development and regulatory writing for clinical studies. Medpace also provides regulatory approval services and post-market support services such as clinical study reports, literature reviews, market approvals, post-market registries, and vigilance writing.
Charles River Laboratories International, Inc. - Charles River Laboratories International, Inc. offers solutions and services in research, clinical support, drug discovery, safety & efficacy assessment, and process manufacturing services to biotechnology, government, pharmaceutical, and academic organizations around the world. Its therapeutic areas include cardiovascular, inflammation, musculoskeletal, respiratory, and CNS metabolic diseases, as well as oncology & ophthalmology. Its product portfolio includes biomarkers, cellular therapeutics, biosimilars, and vaccines. The company is involved in providing services for agrochemicals, chemicals & veterinary medicine, dairy, food & beverage, dialysis, compounding pharmacy, home & beauty, medical devices, nutraceuticals, and dietary supplements. It operates in Australia, Canada, China, Finland, France, Germany, India, Ireland, Italy, Japan, the Netherlands, South Korea, Spain, the UK, and the U.S. Charles River Laboratories, Inc. operates as a subsidiary of Charles River Laboratories International, Inc.
Intertek Group Plc (IGP) - Intertek Group Plc (IGP) is a provider of quality and safety solutions. IGP operates through three reportable segments: Product, Trade, and Resources. Its product segment’s key offerings include bio-pharmaceutical services, protein structure analysis, impurity testing, inspection & certification services, laboratory testing, quality & performance testing, and sustainability analysis. Its trade and resources segment offers technical services, analytical testing services, calibration, and asset integrity services. IGP caters its services to the life sciences, food, pharmaceuticals, and healthcare industries. It has a presence in 1,000 locations in over 100 countries.
SGS S.A. (SGS) - SGS SA (SGS) provides clinical research services, quality assurance, inspection, testing, and certification services across the world. SGS operates through nine reportable segments: Agriculture, Food & Life, Minerals, Oil, Gas & Chemicals, Consumer Retail, Certification and Business Enhancement, Industrial, Environment, Health and Safety, Transportation, and Governments and Institutions. Under clinical research services, it offers clinical development consultancy, pharmaco-vigilance and drug safety services, and early-phase clinical services (patent & clinical trials, and bio-equivalence & bio-availability studies. It also provides verification & certification services to enable its customer’s products in line with international standards, outsourcing, consulting, and data analytic services. SGS caters its services through the network of 2,600 offices and laboratories.
Pharmaceutical Product Development, LLC (PPD) - Pharmaceutical Product Development, LLC, (PPD) is a U.S.-based pre-clinical outsourcing company. PPD offers services such as discovery & development, post-approval services, and a compound partnering program. Investors such as Carlyle Group, in affiliation with Hellman & Friedman, increased funding by USD 3.9 billion. PPD also provides pharmacology and toxicological testing services for preclinical studies to biopharmaceutical and medical device companies. The company has a presence in more than 46 countries. It caters to pharmaceutical, medical devices, & biotechnology companies, government organizations, and academic institutions. In 2021, PPD was acquired by Thermo Fisher Scientific, Inc.
PRA Health Sciences (PRA) - PRA Health Sciences, Inc. (PRA) is a contract research organization, which provides clinical development services to biotechnology & pharmaceutical companies, globally. PRA operates through two segments namely: Clinical Research and Data Solutions. Its key offerings under the clinical research segment are bioanalysis, clinical trials, medical writing, quality assurance, safety & risk management, biostatistics, and late-phase services. Under Data Solutions, PRA offers consulting, analytics, and technology solutions. The company changed its name from PRA Global Holdings, Inc. to PRA Health Sciences, Inc. The company was acquired by ICON plc.
Crown Bioscience - Crown Bioscience is a platform technology firm that provides drug discovery & development services in the fields of oncology, metabolic diseases, cardiovascular, and inflammation to biopharmaceutical companies. Owing to special attention to immunotherapy research, the company offers various syngeneic models along with xenografts for in vivo oncology studies. The company develops world-leading preclinical efficacy models and provides in vivo & in vitro testing services. It has facilities worldwide, including in the U.S., the UK, Taiwan, & China.
Supply Side Estimates
Company revenue estimation via referring to annual reports, investor presentations, and Hoover’s.
Segment revenue determination via variable analysis and penetration modeling.
Competitive benchmarking to identify market leaders and their collective revenue shares.
Forecasting via analyzing commercialization rates, pipelines, market initiatives, distribution networks, etc.
Demand side estimates
Identifying parent markets and ancillary markets
Segment penetration analysis to obtain pertinent
revenue/volume
Heuristic forecasting with the help of subject matter experts
Forecasting via variable analysis
Understanding market dynamics (in terms of drivers, restraints, & opportunities) in the countries.
Understanding trends & variables in the individual countries & their impact on growth and using analytical tools to provide high-level insights into the market dynamics and the associated growth pattern.
Understanding market estimates and forecasts (with the base year as 2022, historic information from 2018 to 2021, and forecast from 2023 to 2030). Regional estimates & forecasts for each category are available and are summed up to form the global market estimates.
The report provides market value for the base year 2022 and a yearly forecast till 2030 in terms of revenue/volume or both. The market for each of the segment outlooks has been provided on region & country basis for the above-mentioned forecast period.
The key industry dynamics, major technological trends, and application markets are evaluated to understand their impact on the demand for the forecast period. The growth rates were estimated using correlation, regression, and time-series analysis.
We have used the bottom-up approach for market sizing, analyzing key regional markets, dynamics, & trends for various products and end-users. The total market has been estimated by integrating the country markets.
All market estimates and forecasts have been validated through primary interviews with the key industry participants.
Inflation has not been accounted for to estimate and forecast the market.
Numbers may not add up due to rounding off.
Europe consists of EU-8, Central & Eastern Europe, along with the Commonwealth of Independent States (CIS).
Asia Pacific includes South Asia, East Asia, Southeast Asia, and Oceania (Australia & New Zealand).
Latin America includes Central American countries and the South American continent
Middle East includes Western Asia (as assigned by the UN Statistics Division) and the African continent.
GVR strives to procure the latest and unique information for reports directly from industry experts, which gives it a competitive edge. Quality is of utmost importance to us, therefore every year we focus on increasing our experts’ panel. Primary interviews are one of the critical steps in identifying recent market trends and scenarios. This process enables us to justify and validate our market estimates and forecasts to our clients. With more than 8,000 reports in our database, we have connected with some key opinion leaders across various domains, including healthcare, technology, consumer goods, and the chemical sector. Our process starts with identifying the right platform for a particular type of report, i.e., emails, LinkedIn, seminars, or telephonic conversation, as every report is unique and requires a differentiated approach.
We send out questionnaires to different experts from various regions/ countries, which is dependent on the following factors:
Report/Market scope: If the market study is global, we send questionnaires to industry experts across various regions, including North America, Europe, Asia Pacific, Latin America, and MEA.
Market Penetration: If the market is driven by technological advancements, population density, disease prevalence, or other factors, we identify experts and send out questionnaires based on region or country dominance.
The time to start receiving responses from industry experts varies based on how niche or well-penetrated the market is. Our reports include a detailed chapter on the KoL opinion section, which helps our clients understand the perspective of experts already in the market space.
"The quality of research they have done for us has been excellent."