- Home
- »
- Display Technologies
- »
-
POS Display Market Procurement & Supplier Intelligence Report, 2025GVR Report cover
![Point Of Sale Display Market Procurement Intelligence, Supplier Intelligence, Supplier Ranking, Pricing & Cost Structure Intelligence, Best Practices, Engagement Model Report]()
Point Of Sale Display Market (2020 - 2025) Procurement Intelligence, Supplier Intelligence, Supplier Ranking, Pricing & Cost Structure Intelligence, Best Practices, Engagement Model Analysis, Day One Analysis, Low Cost & Best Cost Country Analysis
- Report ID: GVR-4-68039-914-6
- Number of Report Pages: 54
- Format: PDF
- Historical Range: 2019 - 2020
- Forecast Period: 2019 - 2025
- Industry: Semiconductors & Electronics
- Report Summary
- Table of Contents
- Segmentation
- Methodology
- Download FREE Sample
-
Download Sample Report
Category Overview
The global POS display market was valued at USD 11.55 billion in 2020 and is expected to reach USD 16.89 billion by 2025, recording a CAGR of 7.9% over the forecast period. The COVID-19 pandemic has propelled retailers to adopt cost-saving measures. POS terminals can help retailers save an average of 38% to 48% over PC cash drawers. This has resulted in the high adoption of POS terminals, in turn driving the demand for POS displays.

The supplier landscape of POS machines can be divided into two segments:
-
OEMs
-
Suppliers under this category manufacture their own display units for their POS machines. They also supply display panels to other manufacturers.
-
-
Component Providers
-
Suppliers under this category manufacture the panels as a component for OEMs.
-
Market Intelligence
The POS display market has been segmented into five broad regions, covering North America, Latin America, Europe, APAC, and MEA.
In 2020, APAC held the majority of the market share for POS display panels, accounting for over 30%. The region is expected to witness significant growth over the forecast period, registering a CAGR of 8.8%. An increase in regional sourcing practices for cost-saving opportunities is expected to drive the growth of the APAC market. Moreover, the use of POS machines as a mode of marketing is recognized as an emerging trend in the Asia Pacific market. POS displays are now capable of configuring with 4k and Ultra 4k technologies. They are also crucial for enabling effective promotions and visual merchandising in retail stores.
"Apart from the key trends, drivers, and challenges, the report highlights the supply chain of the POS display, covering all stages from the use of raw materials to the final integration with the POS terminals."
Supplier Intelligence
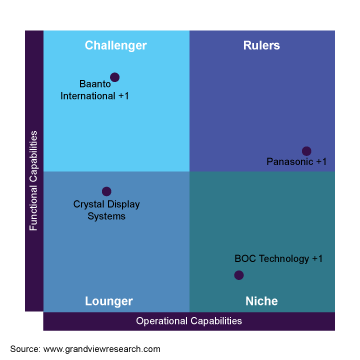
For this study, we have conducted extensive secondary research that includes data captured from industry articles, association reports, and government publications. We have selected a total of 21 suppliers and have recommended them based on the robust ranking methodology, considering the core capabilities offered by each supplier.

The suppliers are plotted in the quadrants based on the rankings derived.
Rulers/Leaders: This quadrant includes suppliers that have exceptional functional and operational capabilities along with a strong global presence. Suppliers under this category offer a wide range of products and services for the category.
Challengers: Suppliers in this quadrant offer most of their products and services for the category, but lack operational capabilities such as employee strength, revenue, or global reach.
Niches: Vendors in this quadrant have adequate experience and high revenue but lack service/product expertise. They often provide only certain types of offerings to their end-users.
Loungers: The majority of the startups fall under this category as they lack expertise in product and service offerings and employee management.
Price & Cost Intelligence
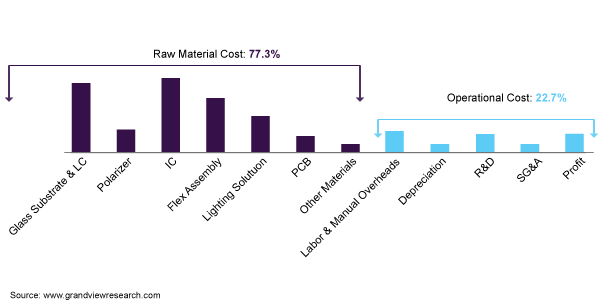
Raw materials account for approximately 77% of the total manufacturing cost for POS displays. Upon comparing the cost structure of a POS display with that of a large panel display, the two cost heads that vary significantly are ICs and flex assembly (the cost of these materials is higher for POS display screens than that of large panel display screens).

Sourcing Intelligence
The sourcing intelligence section of the report consists of sourcing strategies for optimal cost savings and supplier negotiation. The report highlights sourcing best practices that can be implemented by procurement professionals in the organization.
"With the need for real-time tracking along with cost-saving measures being applied across organizations, several suppliers are shifting from semi-automated procurement tools to cloud-based platforms to improve speed and efficiency of operations. Moreover, the outsourcing maintenance of these tools enables further cost-saving opportunities."
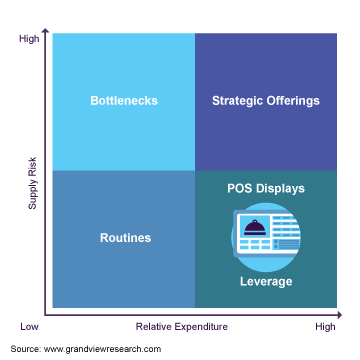
The report also includes category portfolio analysis to mitigate risks that may arise from the suppliers and relative expenditures involved.

POS Display Market Report Scope
Report Attribute
Details
Base year for estimation
2018
Actual estimates/Historical data
2019 - 2020
Forecast period
2021 - 2025
Market representation
Revenue in USD billion
Regional scope
North America; Europe; Asia Pacific; Latin America; MEA
Report coverage
Market Intelligence, Supplier Intelligence, Recommended Suppliers, Pricing and Cost Intelligence, and Sourcing Intelligence
Segments Covered in the POS Display ReportThe report forecasts category spending and growth at global levels and provides an analysis of the latest trends, drivers, and challenges for the POS display market. The supplier intelligence provided in the report gives an overview of the type of suppliers present in the market and their ranking for the same. We have also recommended suppliers with a detailed supplier profile based on the ranking derived.
The cost structure and TCO analysis provide an overview of the expenses associated with the category that can be leveraged for better negotiation. Additionally, the pricing models highlighted will help the client to choose the best-suited pricing model according to their specific needs.
The Sourcing Intelligence section highlights the different aspects of efficient procurement for the category. It provides a detailed overview of the different engagement and operating models to get associated with the supplier. The section also provides an overview of the KPIs and SLA terms that are necessary to be discussed with the supplier to reduce supply chain risks. Moreover, key sourcing topics such as Quick Wins, Day One Analysis, Portfolio Analysis, and negotiation strategies have been highlighted for better bargaining with the suppliers.
Frequently Asked Questions About This Report
b. The global POS display market size was estimated at USD 10.6 billion in 2019 and is expected to reach USD 11.5 billion in 2020.
b. The global POS display market is expected to grow at a compound annual growth rate of 7.9% from 2020 to 2025 to reach USD 16.9 billion by 2025.
b. LCC/BCC sourcing analysis indicates China to be one of the best sourcing destinations for point of sale display manufacturers.
b. Some key suppliers in the POS display market are AU Optronics; Baanto International; BOE Technology; Crystal Display Systems; Toshiba ; Panasonic; Samsung Electronics.
b. Prevalence of regional sourcing practices, increasing spend transparency, migration to cloud-based procurement tools, and standardization of contract periods, are some of the sourcing best practices in the POS display market.
Share this report with your colleague or friend.
Need a Tailored Report?
Customize this report to your needs — add regions, segments, or data points, with 20% free customization.

ISO 9001:2015 & 27001:2022 Certified
We are GDPR and CCPA compliant! Your transaction & personal information is safe and secure. For more details, please read our privacy policy.
Trusted market insights - try a free sample
See how our reports are structured and why industry leaders rely on Grand View Research. Get a free sample or ask us to tailor this report to your needs.


