The global polyols market size to be valued at USD 45.17 billion by 2025 and is expected to grow at a compound annual growth rate (CAGR) of 8.5% from 2018 to 2025. Rising efforts for energy conservation are propelling demand for rigid foams with high insulation properties, particularly in the building and construction industry. This is expected to emerge as a significant factor driving the global market over the forecast period. Growth of the construction sector, primarily in Asia Pacific, to accommodate a rapidly burgeoning population is anticipated to boost product consumption in building components such as exterior panels, insulation protective materials, and housing electronics. Expanding automotive and packaging industries are also contributing toward market growth.
Furthermore, key manufacturers have been investigating bio-based polyols to reduce dependence on conventional petrochemical-derived polyols given rising environmental concerns and volatility in raw material prices. The nature of the vendor landscape is concentrated and oligopolistic. As of 2017, top manufacturers accounted for a share of over 45.0% in the market.
Different strategies adopted by market leaders have paved the path for smaller players to follow. Moreover, new entrants are seeking more significant opportunities in the global market for polyol products as well as polyurethane products such as foams, coatings, elastomers, and sealants. Companies attempting to establish themselves in the market have to compete with existing multinationals such as Huntsman International LLC, Eastman Chemical Corporation, DIC Corporation, Mitsubishi Chemical Corporation, Tosoh Corporation, Woodbridge Foam Corporation, and RTP Company.
Moreover, polyol suppliers are engaging in forward integration to produce polyurethane, thereby significantly reducing logistics costs and procurement hassles in the long run. Consumers are becoming increasingly aware regarding product benefits, which has compelled suppliers to maintain high-quality levels by integrating into the production stage.
The increasing demand for rigid and flexible polyurethane in the context of different application areas such as bedding, cushioning, carpets, making of the car seats, and other interiors drive the market. Polyols have application in the automotive industry, owing to the features such as low cost, enhanced hydrolytic stability, and increased demand for polyols. Specifically, polyols are required in the energy conservation activities for the rigid foams with high insulation properties, within the construction market. Moreover, the increasing pace of industrialization has surged the use of polymers and other components in the loping countries.
Additionally, the use of polyols has been seen in various infrastructure development projects which are supported by government initiatives. The polyols are used as a special component within the food and beverage industry as well as a sugar replacement ingredient in different products such as candies, ice creams, fruit spreads, and yogurt.
There is a significant demand for polyols from the consumer products, electronics, footwear, and packaging industry determining a significant contribution to the overall market growth. Furthermore, polyols are widely used in building and construction activities. The rapid increase in the size of the population has surged the infrastructure and housing requirements. This is expected to create a robust growth opportunity for the market.
Globally, polyether polyols accounted for the largest market share in 2017. The segment is expected to continue its dominance over the forecast period. Polyether polyols have rebound properties, wear and tear resistance, and hydrolytic stability owing to which it is used to formulate rigid polyurethane foams. These are used by various end-use industries such as transportation, construction, furniture, and packaging.
Polyester polyols have high tensile strength and shock absorption properties owing to which they are extensively used in vibration dampening applications. Both polyether and polyester polyols are used in polyurethane, urethane, and polyisocyanurate applications. Increasing demand for PU-based foams and coatings, adhesives, sealants, and elastomers (C.A.S.E) from various end-use industries such as automotive, textile, insulation, packaging, electrical and electronics is projected to boost industry growth over the forecast period.
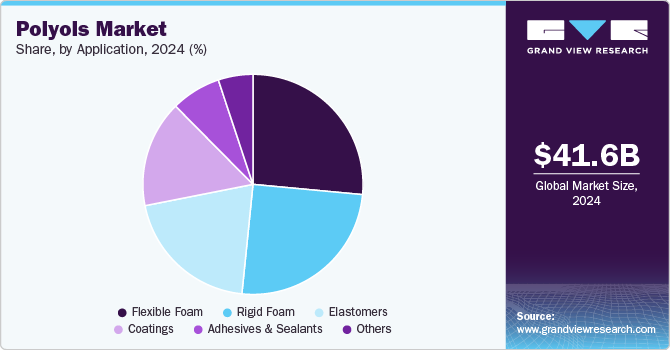
Flexible foam emerged as the largest application segment in 2017 in the polyols market and accounted for a share of over 27.0% by volume that year. Flexible foams are widely utilized as cushioning material for furniture, bedding and mattresses, seating, and other soft products in several end-use industries such as furniture and mattress, automotive, handbag and luggage, footwear and textile, home appliances, engineering, and packaging.
Both polyether and polyester polyols are used to make flexible foams. These foams are produced with an average density of 1.5 to 3 lb/ft³. Flexible foam made with polyols exhibits high durability, resiliency, energy absorption, handling strength, enhanced thermal insulation, and excellent mechanical attributes, which are likely to support its demand from various industries over the forecast period.
Elastomers are expected to emerge as the fastest-growing application segment over the forecast period. Elastomers are polymers with the combined strength of plastic and elasticity of rubber. Polyol-based elastomers are used in molded rubber components in various industries including building and construction, apparels and footwear, automotive, packaging, furnishing, appliances, marine, medical, and electronics owing to their excellent chemical and mechanical properties, low cost, and high durability.
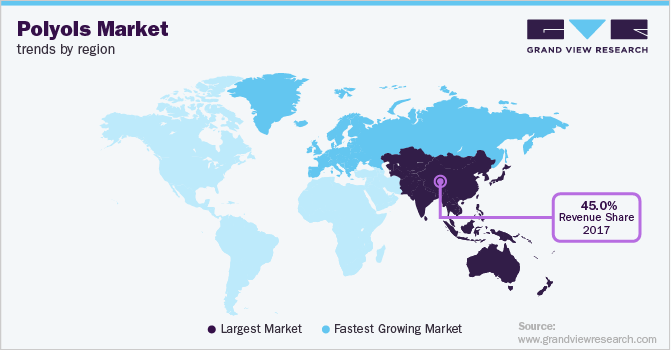
Asia Pacific emerged as the largest regional market in 2017 with a share of over 45.0%. Growing automotive industry, along with increasing polymer consumption, is anticipated to remain a key factor driving the regional market. APAC is also likely to register the fastest growth over the forecast period.
Europe, led by Germany, U.K., and France, emerged as the second-largest polyols-consuming region in 2017. Increasing demand for insulation in low-income households to conserve energy efficiently, coupled with favorable regulatory support by governments, is anticipated to propel the demand for polyols in Europe.
Latin America is foreseen to emerge as the second fastest-growing regional market after Asia Pacific from 2018 to 2025. This can be attributed to the presence of various automotive OEMs, along with growth of the building and construction industry. Automobile manufacturers in the region are becoming increasingly competitive and are adopting polyurethane materials to lower production cost.
Some of the prominent players are Covestro, BASF SE, The Dow Chemical Company, Shell, and Huntsman. Companies such as BASF, Dow Chemical, and Covestro have well-developed research and development facilities, along with a global footprint and a loyal customer base. Deploying large amounts of capital, gaining technical know-how, and establishing an efficient supply chain system are significant challenges for new entrants in the global market.
Automotive as well as building and construction industries in developing countries in Asia Pacific are expected to witness rapid growth in the coming years. India and China are projected to emerge as significant demand drivers in the global automotive market. Thus, polyol manufacturers and suppliers are increasingly focusing on this region. Some of the leading players operating in this market include:
Covestro AG
BASF SE
The Dow Chemical Company
Shell, and
Huntsman
In March 2023, BASF started production of Sovermol®, its first bio-based polyol in Mangalore, India. The product meets the rapidly expanding need for eco-friendly goods in Asia Pacific for use in New Energy Vehicles (NEV), windmills, flooring, and protective industrial coatings.
In September 2022, Covestro introduced more environmentally friendly polyether polyols based on bio-circular raw materials. Both essential elements for PU foams, together with isocyanates, are now obtainable using alternative raw materials.
Report Attribute |
Details |
Revenue forecast in 2025 |
USD 45.17 billion |
Growth rate |
CAGR of 8.5% from 2018 to 2025 |
Base year for estimation |
2017 |
Historical data |
2014 - 2016 |
Forecast period |
2018 - 2025 |
Quantitative units |
Revenue in USD billion and CAGR from 2018 to 2025 |
Report coverage |
Revenue forecast, company ranking, competitive landscape, growth factors, and trends |
Segments covered |
Product, application, region |
Regional scope |
North America; Europe; Asia Pacific; Latin America; Middle East & Africa |
Country scope |
U.S.; Canada; Germany; U.K.; France; China; India; Japan; Brazil; Mexico; Saudi Arabia |
Key companies profiled |
Covestro, BASF SE, The Dow Chemical Company, Shell, and Huntsman. Companies such as BASF, Dow Chemical, Covestro |
Customization scope |
Free report customization (equivalent to up to 8 analysts working days) with purchase. Addition or alteration to country, regional & segment scope. |
Pricing and purchase options |
Avail customized purchase options to meet your exact research needs. Explore purchase options |
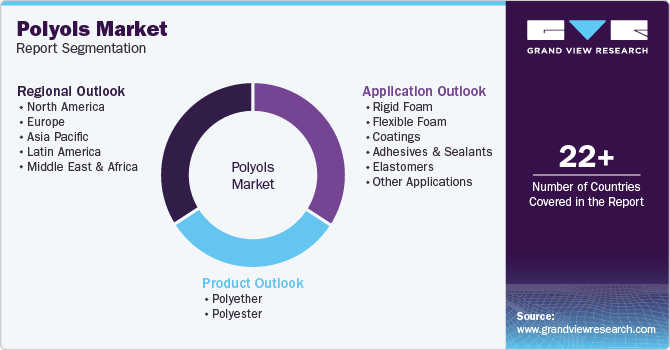
This report forecasts revenue growth at global, regional, and country levels and provides an analysis on the latest industry trends in each of the sub-segments from 2014 to 2025. For the purpose of this study, Grand View Research has segmented the global polyols market report on the basis of product, application, and region.
Product Outlook (Volume, Kilotons; Revenue, USD Million, 2014 - 2025)
Polyether
Polyester
Application Outlook (Volume, Kilotons; Revenue, USD Million, 2014 - 2025)
Rigid Foam
Flexible Foam
Coatings
Adhesives & Sealants
Elastomers
Others
Regional Outlook (Volume, Kilotons; Revenue, USD Million, 2014 - 2025)
North America
The U.S.
Canada
Europe
Germany
The U.K.
France
Asia Pacific
China
India
Japan
Latin America
Brazil
Mexico
Middle East & Africa
Saudi Arabia
Table of Contents
Chapter 1 Polyols Market: Methodology and Scope
1.1 Research methodology
1.2 Research scope and assumptions
1.3 List of data sources
Chapter 2 Polyols Market: Executive Summary
2.1 Market Summary
Chapter 3 Polyols Market Variables, Trends & Scope
3.1 Market segmentation
3.2 Penetration & growth prospect mapping, 2014 - 2025
3.3 Polyols market - value chain analysis
3.4 Technology overview
3.5 Regulatory framework
3.6 Raw Material Trends
3.7 Polyols market dynamics
3.7.1 Market driver analysis
3.7.1.1 Growing application of polyurethane in automotive industry
3.7.1.2 High demand for building insulation owing to the sustainability concerns
3.7.2 Market restraint analysis
3.7.2.1 Growing environmental concerns
3.8 Key opportunities prioritized
3.8.1 New market avenues
3.8.2 Adhesive & sealant benchmarking
3.9 Industry analysis - Porter’s
3.10 Polyols market - Macro-Environmental Analysis
Chapter 4 Polyols Market: Product Estimates & Trend Analysis
4.1 Global polyols market share, by product, 2017 & 2025
4.2 Polyether
4.2.1 Global polyether polyols market estimates & forecasts, 2014 - 2025
4.3 Polyester
4.3.1 Global polyester polyols market estimates & forecasts, 2014 - 2025
Chapter 5 Polyols Market: Application Estimates & Trend Analysis
5.1 Global polyols market share, by application, 2016 & 2025
5.2 Rigid Foams
5.2.1 Global polyols market estimates & forecasts, in rigid foams, 2014 - 2025
5.3 Flexible Foams
5.3.1 Global polyols market estimates & forecasts, in flexible foams, 2014 - 2025
5.4 Coatings
5.4.1 Global polyols market estimates & forecasts, in coatings, 2014 - 2025
5.5 Adhesives & Sealants
5.5.1 Global polyols market estimates & forecasts, in adhesives & sealants, 2014 - 2025
5.6 Elastomers
5.6.1 Global polyols market estimates & forecasts, in elastomers, 2014 - 2025
Chapter 6 Polyols Market: Regional Estimates & Trend Analysis
6.1 Global polyols market share, by region, 2016 & 2025
6.2 North America
6.2.1 Market estimates & forecasts, 2014 - 2025 (Kilotons) (USD Million)
6.2.2 Market estimates & forecasts, by product, 2014 - 2025 (Kilotons) (USD Million)
6.2.3 Market estimates & forecasts, by application, 2014 - 2025 (Kilotons) (USD Million)
6.2.4 The U.S.
6.2.4.1 Market estimates & forecasts, 2014 - 2025 (Kilotons) (USD Million)
6.2.4.2 Market estimates & forecasts, by product, 2014 - 2025 (Kilotons) (USD Million)
6.2.4.3 Market estimates & forecasts, by application, 2014 - 2025 (Kilotons) (USD Million)
6.2.5 Canada
6.2.5.1 Market estimates & forecasts, 2014 - 2025 (kilotons) (usd million)
6.2.5.2 Market estimates & forecasts, by product, 2014 - 2025 (Kilotons) (USD Million)
6.2.5.3 Market estimates & forecasts, by application, 2014 - 2025 (Kilotons) (USD Million)
6.3 Europe
6.3.1 Market estimates & forecasts, 2014 - 2025 (Kilotons) (USD Million)
6.3.2 Market estimates & forecasts, by product, 2014 - 2025 (Kilotons) (USD Million)
6.3.3 Market estimates & forecasts, by application, 2014 - 2025 (Kilotons) (USD Million)
6.3.4 Germany
6.3.4.1 Market estimates & forecasts, 2014 - 2025 (Kilotons) (USD Million)
6.3.4.2 Market estimates & forecasts, by product, 2014 - 2025 (Kilotons) (USD Million)
6.3.4.3 Market estimates & forecasts, by application, 2014 - 2025 (Kilotons) (USD Million)
6.3.5 The U.K.
6.3.5.1 Market estimates & forecasts, 2014 - 2025 (Kilotons) (USD Million)
6.3.5.2 Market estimates & forecasts, by product, 2014 - 2025 (Kilotons) (USD Million)
6.3.5.3 Market estimates & forecasts, by application, 2014 - 2025 (Kilotons) (USD Million)
6.3.6 France
6.3.6.1 Market estimates & forecasts, 2014 - 2025 (Kilotons) (USD Million)
6.3.6.2 Market estimates & forecasts, by product, 2014 - 2025 (Kilotons) (USD Million)
6.3.6.3 Market estimates & forecasts, by application, 2014 - 2025 (Kilotons) (USD Million)
6.4 Asia Pacific
6.4.1 Market estimates & forecasts, 2014 - 2025 (Kilotons) (USD Million)
6.4.2 Market estimates & forecasts, by product, 2014 - 2025 (Kilotons) (USD Million)
6.4.3 Market estimates & forecasts, by application, 2014 - 2025 (Kilotons) (USD Million)
6.4.4 China
6.4.4.1 Market estimates & forecasts, 2014 - 2025 (Kilotons) (USD Million)
6.4.4.2 Market estimates & forecasts, by product, 2014 - 2025 (Kilotons) (USD Million)
6.4.4.3 Market estimates & forecasts, by application, 2014 - 2025 (Kilotons) (USD Million)
6.4.5 India
6.4.5.1 Market estimates & forecasts, 2014 - 2025 (Kilotons) (USD Million)
6.4.5.2 Market estimates & forecasts, by product, 2014 - 2025 (Kilotons) (USD Million)
6.4.5.3 Market estimates & forecasts, by application, 2014 - 2025 (Kilotons) (USD Million)
6.4.6 Japan
6.4.6.1 Market estimates & forecasts, 2014 - 2025 (Kilotons) (USD Million)
6.4.6.2 Market estimates & forecasts, by product, 2014 - 2025 (Kilotons) (USD Million)
6.4.6.3 Market estimates & forecasts, by application, 2014 - 2025 (Kilotons) (USD Million)
6.5 Latin America
6.5.1 Market estimates & forecasts, 2014 - 2025 (Kilotons) (USD Million)
6.5.2 Market estimates & forecasts, by product, 2014 - 2025 (Kilotons) (USD Million)
6.5.3 Market estimates & forecasts, by application, 2014 - 2025 (Kilotons) (USD Million)
6.5.4 Brazil
6.5.4.1 Market estimates & forecasts, 2014 - 2025 (Kilotons) (USD Million)
6.5.4.2 Market estimates & forecasts, by product, 2014 - 2025 (Kilotons) (USD Million)
6.5.4.3 Market estimates & forecasts, by application, 2014 - 2025 (Kilotons) (USD Million)
6.5.5 Mexico
6.5.5.1 Market estimates & forecasts, 2014 - 2025 (Kilotons) (USD Million)
6.5.5.2 Market estimates & forecasts, by product, 2014 - 2025 (Kilotons) (USD Million)
6.5.5.3 Market estimates & forecasts, by application, 2014 - 2025 (Kilotons) (USD Million)
6.6 Middle East & Africa
6.6.1 Market estimates & forecasts, 2014 - 2025 (Kilotons) (USD Million)
6.6.2 Market estimates & forecasts, by product, 2014 - 2025 (Kilotons) (USD Million)
6.6.3 Market estimates & forecasts, by application, 2014 - 2025 (Kilotons) (USD Million)
6.6.4 Saudi Arabia
6.6.4.1 Market estimates & forecasts, 2014 - 2025 (Kilotons) (USD Million)
6.6.4.2 Market estimates & forecasts, by product, 2014 - 2025 (Kilotons) (USD Million)
6.6.4.3 Market estimates & forecasts, by application, 2014 - 2025 (Kilotons) (USD Million)
Chapter 7 Competitive Landscape
7.1 Company market share analysis, 2017
7.2 Vendor Landscape
7.3 Polyols End-user Analysis, by Application
7.4 Competitive Environment
7.5 Company Market Positioning
7.6 Strategic Framework
Chapter 8 Company Profiles
8.1 The Dow Chemical Company
8.1.1 Company Overview
8.1.2 Financial Performance
8.1.3 Industries and Services Catered
8.1.4 Product Benchmarking
8.1.5 Strategic Initiatives
8.2 BASF SE
8.2.1 Company Overview
8.2.2 Financial Performance
8.2.3 Industries and Services Catered
8.2.4 Product Benchmarking
8.2.5 Strategic Initiatives
8.3 Covestro AG
8.3.1 Company Overview
8.3.2 Financial Performance
8.3.3 Industries and Services Catered
8.3.4 Product Benchmarking
8.3.5 Strategic Initiative
8.4 Huntsman International LLC
8.4.1 Company Overview
8.4.2 Financial Performance
8.4.3 Industries and Services Catered
8.4.4 Product Benchmarking
8.4.5 Strategic Initiatives
8.5 Lanxess AG
8.5.1 Company Overview
8.5.2 Financial Performance
8.5.3 Industries and Services Catered
8.5.4 Product Benchmarking
8.5.5 Strategic Initiatives
8.6 Mitsui Chemicals, Inc.
8.6.1 Company Overview
8.6.2 Financial Performance
8.6.3 Industries and Services Catered
8.6.4 Product Benchmarking
8.6.5 Strategic Initiative
8.7 COIM
8.7.1 Company Overview
8.7.2 Industries and Services Catered
8.7.3 Product Benchmarking
8.8 Tosoh Corporation
8.8.1 Company Overview
8.8.2 Financial Performance
8.8.3 Industries and Services Catered
8.8.4 Product Benchmarking
8.9 DowDuPont
8.9.1 Company Overview
8.9.2 Financial Performance
8.9.3 Industries and Services Catered
8.9.4 Product Benchmarking
8.10 PCC SE
8.10.1 Company Overview
8.10.2 Financial Performance
8.10.3 Industries and Services Catered
8.10.4 Product Benchmarking
8.11 Perstorp Holding AB
8.11.1 Company Overview
8.11.2 Financial Performance
8.11.3 Industries and Services Catered
8.11.4 Product Benchmarking
8.11.5 Strategic Initiatives
8.12 Emery Oleochemicals
8.12.1 Company Overview
8.12.2 Industries and Services Catered
8.12.3 Product Benchmarking
8.13 Invista BV
8.13.1 Company Overview
8.13.2 Industries and Services Catered
8.13.3 Product Benchmarking
8.14 Royal Dutch Shell plc
8.14.1 Company Overview
8.14.2 Financial Performance
8.14.3 Product Benchmarking
8.15 Stepan Company
8.15.1 Company Overview
8.15.2 Financial Performance
8.15.3 Industries and Services Catered
8.15.4 Product Benchmarking
8.16 Vertellus Specialties, Inc.
8.16.1 Company Overview
8.16.2 Industries and Services Catered
8.16.3 Product Benchmarking
8.16.4 Strategic Initiatives
8.17 Yantai Wanhua
8.17.1 Company Overview
8.17.2 Financial Performance
8.17.3 Industries and Services Catered
8.17.4 Product Benchmarking
8.18 Oleon
8.18.1 Company Overview
8.18.2 Industries and Services Catered
8.18.3 Product Benchmarking
8.19 Shanghai Dongda Polyurethane Co. Ltd.
8.19.1 Company Overview
8.19.2 Industries and Services Catered
8.19.3 Product Benchmarking
8.19.4 Strategic Initiative
8.20 Sadara Chemical Company
8.20.1 Company Overview
8.20.2 Industries and Services Catered
8.20.3 Product Benchmarking
List of Tables
TABLE 1 Key international regulations & their impact on the polyol industry
TABLE 2 Driving forces for lightweight vehicles
TABLE 3 Major air emission in producing 1 kg polyols
TABLE 4 Global polyether polyols market estimates & forecasts, 2014 - 2025 (Kilotons) (USD Million)
TABLE 5 Global polyester polyols market estimates & forecasts, 2014 - 2025 (Kilotons) (USD Million)
TABLE 6 Global polyols market estimates & forecasts, in rigid foams, 2014 - 2025 (Kilotons) (USD Million)
TABLE 7 Global polyether polyols market estimates & forecasts, in flexible foams, 2014 - 2025 (Kilotons) (USD Million)
TABLE 8 Global polyols market estimates & forecasts, in coatings, 2014 - 2025 (Kilotons) (USD Million)
TABLE 9 Global polyols market estimates & forecasts, in adhesives & sealants, 2014 - 2025 (Kilotons) (USD Million)
TABLE 10 Global polyols market estimates & forecasts, in elastomers, 2014 - 2025 (Kilotons) (USD Million)
TABLE 11 North America polyols market estimates & forecasts, 2014 - 2025 (Kilotons) (USD Million)
TABLE 12 North America polyols market estimates & forecasts, by product, 2014 - 2025 (Kilotons)
TABLE 13 North America polyols market, by product, 2014 - 2025 (USD Million)
TABLE 14 North America polyols market estimates & forecasts, by application, 2014 - 2025 (Kilotons)
TABLE 15 North America polyols market estimates & forecasts, by application, 2014 - 2025 (USD Million)
TABLE 16 U.S. polyols market estimates & forecasts, 2014 - 2025 (Kilotons) (USD Million)
TABLE 17 U.S. polyols market estimates & forecasts, by product, 2014 - 2025 (Kilotons)
TABLE 18 U.S. polyols market estimates & forecasts, by product, 2014 - 2025 (USD Million)
TABLE 19 U.S. polyols market estimates & forecasts, by application, 2014 - 2025 (Kilotons)
TABLE 20 U.S. polyols market estimates & forecasts, by application, 2014 - 2025 (USD Million)
TABLE 21 Canada polyols market estimates & forecasts, 2014 - 2025 (Kilotons) (USD Million)
TABLE 22 Canada polyols market estimates & forecasts, by product, 2014 - 2025 (Kilotons)
TABLE 23 Canada polyols market estimates & forecasts, by product, 2014 - 2025 (USD Million)
TABLE 24 Canada polyols market estimates & forecasts, by application, 2014 - 2025 (Kilotons)
TABLE 25 Canada polyols market estimates & forecasts, by application, 2014 - 2025 (USD Million)
TABLE 26 Europe polyols market estimates & forecasts, 2014 - 2025 (Kilotons) (USD Million)
TABLE 27 Europe polyols market estimates & forecasts, by product, 2014 - 2025 (Kilotons)
TABLE 28 Europe polyols market, by product, 2014 - 2025 (USD Million)
TABLE 29 Europe polyols market estimates & forecasts, by application, 2014 - 2025 (Kilotons)
TABLE 30 Europe polyols market estimates & forecasts, by application, 2014 - 2025 (USD Million)
TABLE 31 Germany polyols market estimates & forecasts, 2014 - 2025 (Kilotons) (USD Million)
TABLE 32 Germany polyols market estimates & forecasts, by product, 2014 - 2025 (Kilotons)
TABLE 33 Germany polyols market estimates & forecasts, by product, 2014 - 2025 (USD Million)
TABLE 34 Germany polyols market estimates & forecasts, by application, 2014 - 2025 (Kilotons)
TABLE 35 Germany polyols market estimates & forecasts, by application, 2014 - 2025 (USD Million)
TABLE 36 U.K. polyols market estimates & forecasts, 2014 - 2025 (Kilotons) (USD Million)
TABLE 37 U.K. polyols market estimates & forecasts, by product, 2014 - 2025 (Kilotons)
TABLE 38 U.K. polyols market estimates & forecasts, by product, 2014 - 2025 (USD Million)
TABLE 39 U.K. polyols market estimates & forecasts, by application, 2014 - 2025 (Kilotons)
TABLE 40 U.K. polyols market estimates & forecasts, by application, 2014 - 2025 (USD Million)
TABLE 41 France polyols market estimates & forecasts, 2014 - 2025 (Kilotons) (USD Million)
TABLE 42 France polyols market estimates & forecasts, by product, 2014 - 2025 (Kilotons)
TABLE 43 France polyols market estimates & forecasts, by product, 2014 - 2025 (USD Million)
TABLE 44 France polyols market estimates & forecasts, by application, 2014 - 2025 (Kilotons)
TABLE 45 France polyols market estimates & forecasts, by application, 2014 - 2025 (USD Million)
TABLE 46 Asia Pacific polyols market estimates & forecasts, 2014 - 2025 (Kilotons) (USD Million)
TABLE 47 Asia Pacific polyols market estimates & forecasts, by product, 2014 - 2025 (Kilotons)
TABLE 48 Asia Pacific polyols market, by product, 2014 - 2025 (USD Million)
TABLE 49 Asia Pacific polyols market estimates & forecasts, by application, 2014 - 2025 (Kilotons)
TABLE 50 Asia Pacific polyols market estimates & forecasts, by application, 2014 - 2025 (USD Million)
TABLE 51 China polyols market estimates & forecasts, 2014 - 2025 (Kilotons) (USD Million)
TABLE 52 China polyols market estimates & forecasts, by product, 2014 - 2025 (Kilotons)
TABLE 53 China polyols market estimates & forecasts, by product, 2014 - 2025 (USD Million)
TABLE 54 China polyols market estimates & forecasts, by application, 2014 - 2025 (Kilotons)
TABLE 55 China polyols market estimates & forecasts, by application, 2014 - 2025 (USD Million)
TABLE 56 India polyols market estimates & forecasts, 2014 - 2025 (Kilotons) (USD Million)
TABLE 57 India polyols market estimates & forecasts, by product, 2014 - 2025 (Kilotons)
TABLE 58 India polyols market estimates & forecasts, by product, 2014 - 2025 (USD Million)
TABLE 59 India polyols market estimates & forecasts, by application, 2014 - 2025 (Kilotons)
TABLE 60 India polyols market estimates & forecasts, by application, 2014 - 2025 (USD Million)
TABLE 61 Japan polyols market estimates & forecasts, 2014 - 2025 (Kilotons) (USD Million)
TABLE 62 Japan polyols market estimates & forecasts, by product, 2014 - 2025 (Kilotons)
TABLE 63 Japan polyols market estimates & forecasts, by product, 2014 - 2025 (USD Million)
TABLE 64 Japan polyols market estimates & forecasts, by application, 2014 - 2025 (Kilotons)
TABLE 65 Japan polyols market estimates & forecasts, by application, 2014 - 2025 (USD Million)
TABLE 66 Latin America polyols market estimates & forecasts, 2014 - 2025 (Kilotons) (USD Million)
TABLE 67 Latin America polyols market estimates & forecasts, by product, 2014 - 2025 (Kilotons)
TABLE 68 Latin America polyols market, by product, 2014 - 2025 (USD Million)
TABLE 69 Latin America polyols market estimates & forecasts, by application, 2014 - 2025 (Kilotons)
TABLE 70 Latin America polyols market estimates & forecasts, by application, 2014 - 2025 (USD Million)
TABLE 71 Brazil polyols market estimates & forecasts, 2014 - 2025 (Kilotons) (USD Million)
TABLE 72 Brazil polyols market estimates & forecasts, by product, 2014 - 2025 (Kilotons)
TABLE 73 Brazil polyols market estimates & forecasts, by product, 2014 - 2025 (USD Million)
TABLE 74 Brazil polyols market estimates & forecasts, by application, 2014 - 2025 (Kilotons)
TABLE 75 Brazil polyols market estimates & forecasts, by application, 2014 - 2025 (USD Million)
TABLE 76 Mexico polyols market estimates & forecasts, 2014 - 2025 (Kilotons) (USD Million)
TABLE 77 Mexico polyols market estimates & forecasts, by product, 2014 - 2025 (Kilotons)
TABLE 78 Mexico polyols market estimates & forecasts, by product, 2014 - 2025 (USD Million)
TABLE 79 Mexico polyols market estimates & forecasts, by application, 2014 - 2025 (Kilotons)
TABLE 80 Mexico polyols market estimates & forecasts, by application, 2014 - 2025 (USD Million)
TABLE 81 Middle East & Africa polyols market estimates & forecasts, 2014 - 2025 (Kilotons) (USD Million)
TABLE 82 Middle East & Africa polyols market estimates & forecasts, by product, 2014 - 2025 (Kilotons)
TABLE 83 Middle East & Africa polyols market, by product, 2014 - 2025 (USD Million)
TABLE 84 Middle East & Africa polyols market estimates & forecasts, by application, 2014 - 2025 (Kilotons)
TABLE 85 Middle East & Africa polyols market estimates & forecasts, by application, 2014 - 2025 (USD Million)
TABLE 86 Saudi Arabia polyols market estimates & forecasts, 2014 - 2025 (Kilotons) (USD Million)
TABLE 87 Saudi Arabia polyols market estimates & forecasts, by product, 2014 - 2025 (Kilotons)
TABLE 88 Saudi Arabia polyols market estimates & forecasts, by product, 2014 - 2025 (USD Million)
TABLE 89 Saudi Arabia polyols market estimates & forecasts, by application, 2014 - 2025 (Kilotons)
TABLE 90 Saudi Arabia polyols market estimates & forecasts, by application, 2014 - 2025 (USD Million)
List of Figures
FIG. 1 Polyols market snapshot
FIG. 2 Polyols market segmentation
FIG. 3 Polyols market volume & revenue, 2014 - 2025 (Kilotons) (USD Million)
FIG. 4 Polyols value chain analysis
FIG. 5 Global crude oil prices from 2013 to 2017 (USD per barrel)
FIG. 6 Polyols value chain analysis
FIG. 7 Global green building and sustainable construction revenue, from 2012 to 2016 (USD Billion)
FIG. 8 Percentage of firms with more than 60% of green construction projects by country, 2015 & 2015
FIG. 9 Global carbon emission levels estimates & forecasts, 2010 - 2020 (billion metric tons)
FIG. 10 Key opportunities prioritized
FIG. 11 Types of PU adhesive by total formulated product (%)
FIG. 12 Polyols market - Porter’s analysis
FIG. 13 Polyols market - PESTLE analysis
FIG. 14 Global polyols market volume, by product, 2017 & 2025
FIG. 15 Global polyols market share, by application, 2017 & 2025 (By Volume)
FIG. 16 Global polyols market share, by region, 2017 & 2025 (By Volume)
FIG. 17 Polyols - company market share analysis, 2017
FIG. 18 Company Environment
FIG. 19 Company Market Positioning
FIG. 20 Strategy Framework
Market Segmentation
Automotive industry emerged as one of the most significant drivers for PU, which also boosted the polyol market in 2017. Automobile manufacturers are focusing on reducing the vehicle weight and emissions owing to stringent regulatory norms regarding vehicular emission, which is increasing the application scope of PU in automotive industry. According to the Corporate Average Fuel Economy (CAFE) standard, by 2025, vehicles need to attain an average mileage of 50 miles per gallon. This proposed standard is approximately 40% higher than the standard mileage of the current vehicles.
The global energy crisis has fostered the development of numerous green buildings as well as several sustainable construction initiatives. Sustainability in construction activities is a vast field and encompasses several steps that must be implemented in the primary construction stages as their potential environmental impacts are quite significant. Increased efficiency in building materials has ultimately generated high demand for efficient insulating materials to regulate HVAC and counteract the amount of energy loss as a direct result of inefficient insulation. Polyol-based PU foams are subsequently being utilized as extremely efficient insulation materials, leading to greater energy savings and contributing sustainably and environmentally. Numerous businesses have realized other intangible benefits of green buildings such as increased employee productivity, improved employee satisfaction, and their positive impact on company’s brand and reputation.
The release of toxic gases on the burning of fossil fuels is expected to cause a major hindrance for the petrochemical manufacturers over the forecast period. Petrochemical products derived from crude oil release hazardous gases into the atmosphere. This factor is expected to increase the greenhouse gases (GHG) concentration in the atmosphere and thus increase the carbon footprint. China is expected to witness an increase in the quantity of carbon dioxide released into the atmosphere over the forecast period owing to the presence of large capacity manufacturing units in the country. China accounted for approximately 28.03% of the total carbon dioxide released in 2015.
This section will provide insights into the contents included in this polyols market report and help gain clarity on the structure of the report to assist readers in navigating smoothly.
Industry overview
Industry trends
Market drivers and restraints
Market size
Growth prospects
Porter’s analysis
PESTEL analysis
Key market opportunities prioritized
Competitive landscape
Company overview
Financial performance
Product benchmarking
Latest strategic developments
Market size, estimates, and forecast from 2018 to 2030
Market estimates and forecast for product segments up to 2030
Regional market size and forecast for product segments up to 2030
Market estimates and forecast for application segments up to 2030
Regional market size and forecast for application segments up to 2030
Company financial performance
A three-pronged approach was followed for deducing the polyols market estimates and forecasts. The process has three steps: information procurement, analysis, and validation. The whole process is cyclical, and steps repeat until the estimates are validated. The three steps are explained in detail below:
Information procurement: Information procurement is one of the most extensive and important stages in our research process, and quality data is critical for accurate analysis. We followed a multi-channel data collection process for polyols market to gather the most reliable and current information possible.
Analysis: We mine the data collected to establish baselines for forecasting, identify trends and opportunities, gain insight into consumer demographics and drivers, and so much more. We utilized different methods of polyols market data depending on the type of information we’re trying to uncover in our research.
Market Research Efforts: Bottom-up Approach for estimating and forecasting demand size and opportunity, top-down Approach for new product forecasting and penetration, and combined approach of both Bottom-up and Top-down for full coverage analysis.
Value-Chain-Based Sizing & Forecasting: Supply-side estimates for understanding potential revenue through competitive benchmarking, forecasting, and penetration modeling.
Demand-side estimates for identifying parent and ancillary markets, segment modeling, and heuristic forecasting.
Qualitative Functional Deployment (QFD) Modelling for market share assessment.
Market formulation and validation: We mine the data collected to establish baselines for forecasting, identify trends and opportunities, gain insight into consumer demographics and drivers, and so much more. We utilize different methods of data analysis depending on the type of information we’re trying to uncover in our research.
Market Formulation: This step involves the finalization of market numbers. This step on an internal level is designed to manage outputs from the Data Analysis step.
Data Normalization: The final market estimates and forecasts are then aligned and sent to industry experts, in-panel quality control managers for validation.
This step also entails the finalization of the report scope and data representation pattern.
Validation: The process entails multiple levels of validation. All these steps run in parallel, and the study is forwarded for publishing only if all three levels render validated results.
The polyols market was categorized into three segments, namely Product (Polyether, Polyester), application (Rigid Foam, Flexible Foam, Coatings, Adhesives & Sealants, Elastomers), and regions (North America, Europe, Asia Pacific, Latin America, and Middle East & Africa).
The polyols market was segmented into application, and regions. The demand at a segment level was deduced using a funnel method. Concepts like the TAM, SAM, SOM, etc., were put into practice to understand the demand. We at GVR deploy three methods to deduce market estimates and determine forecasts. These methods are explained below:
Demand estimation of each product across countries/regions summed up to from the total market.
Variable analysis for demand forecast.
Demand estimation via analyzing paid database, and company financials either via annual reports or paid database.
Primary interviews for data revalidation and insight collection.
Used extensively for new product forecasting or analyzing penetration levels.
Tool used invoice product flow and penetration models Use of regression multi-variant analysis for forecasting Involves extensive use of paid and public databases.
Primary interviews and vendor-based primary research for variable impact analysis.
The polyols market was analyzed at a regional level. The globe was divided into North America, Europe, Asia Pacific, Latin America, and Middle East & Africa, keeping in focus variables like consumption patterns, export-import regulations, consumer expectations, etc. These regions were further divided into eleven countries, namely, the U.S.; Canada; Germany; the UK; France; China; India; Japan; Brazil; Mexico; Saudi Arabia.
All three above-mentioned market research methodologies were applied to arrive at regional-level conclusions. The regions were then summed up to form the global market.
The polyols market was analyzed via companies operating in the sector. Analyzing these companies and cross-referencing them to the demand equation helped us validate our assumptions and conclusions. Key market players analyzed include:
The Dow Chemical Company - The Dow Chemical Company, commonly referred to as Dow, is a multinational company that produces plastics, agriculture products, and chemicals and has its presence in over 160 countries. The company caters its chemical products to many segments including oil & gas, renewable energy, water, transportation, household, packaging, and automotive.
BASF SE - BASF SE is a German chemical production company operating through its subsidiaries and joint ventures in over 80 countries with more than 353 production sites spread across the globe. The company operates through five business segments, namely chemicals, performance products, functional materials & solutions, agricultural solutions, and oil & gas. It also has 13 operating divisions and around 84 sub business units.
Covestro AG - Covestro AG is an independent subsidiary of Bayer AG Group. It is a global producer of high-performance plastics and polymers with multiple businesses catering to industries such as pharmaceutical, chemical, consumer healthcare products, agriculture, biotechnology, and veterinary drugs.
Huntsman International LLC - Huntsman International LLC is a manufacturer and marketer of chemical-based products. The company operates through four business segments: advanced materials, polyurethanes, performance products, and textile effects.
Lanxess AG - Lanxess AG is a specialty chemical manufacturer operating in 25 countries with 75 production sites across the globe. The company pioneers in the development, manufacturing, and marketing of chemical intermediates, fine specialty chemicals, and plastics. It operates its business through following segments: advanced intermediates, specialty additives, performance chemicals, engineering materials, and ARLANXEO.
Mitsui Chemicals, Inc. - Mitsui Chemicals, Inc. is a multinational chemical company that manufactures and distributes industrial chemical products. The company operates through the following business segments: health care, mobility, food & packaging, and basic materials. It offers polyols through its coating and engineering materials sub-segment, which operates under food & packaging segment. The company also manufactures products such as specialty gases, elastomers, specialty polyolefin, adhesives, coatings, construction materials, propylene, polypropylene, ethylene, solar cell sheet, and optical films.
COIM - COIM is an Italian based chemical manufacturing company that manufactures and distributes specialty chemicals including polyols, polyurethane adhesives, polyesters, and structural resins.
Tosoh Corporation - Tosoh Corporation is a leading manufacturer as well as supplier of specialty chemicals and materials around the globe. The company consists of eight business segments: advance materials, cement, bio science, chlor-alkali, organic chemicals, olefins, polymers, and polyurethanes. It offers polyols under polyurethanes business segment and includes polyester polyols for coatings and polyester polyols for elastomers.
DowDuPont - DowDuPont is a science-based company that manufactures a wide variety of products that offer practical as well as essential solutions to its customers. It provides its products and services in over 90 countries around the globe. In August 2017, DuPont merged with the Dow Chemical Company to form DowDuPont.
PCC SE - PCC SE is a European chemical company that manufactures and distributes polyols and specialty chemicals across the globe. The company operates through four business divisions, namely chemicals, energy, logistics, and holding/projects. Chemicals division includes five product segments: polyols, surfactants, chlorine, specialty chemicals, and consumer products. It offers polyols through six subsidiaries located in Poland, Germany, and Bulgaria. It has 40 manufacturing sites in 18 countries worldwide.
Supply Side Estimates
Company revenue estimation via referring to annual reports, investor presentations, and Hoover’s.
Segment revenue determination via variable analysis and penetration modeling.
Competitive benchmarking to identify market leaders and their collective revenue shares.
Forecasting via analyzing commercialization rates, pipelines, market initiatives, distribution networks, etc.
Demand side estimates
Identifying parent markets and ancillary markets
Segment penetration analysis to obtain pertinent
revenue/volume
Heuristic forecasting with the help of subject matter experts
Forecasting via variable analysis
Understanding market dynamics (in terms of drivers, restraints, & opportunities) in the countries.
Understanding trends & variables in the individual countries & their impact on growth and using analytical tools to provide high-level insights into the market dynamics and the associated growth pattern.
Understanding market estimates and forecasts (with the base year as 2017, historic information from 2014 to 2016, and forecast from 2018 to 2025). Regional estimates & forecasts for each category are available and are summed up to form the global market estimates.
The report provides market value for the base year 2017 and a yearly forecast till 2025 in terms of revenue/volume or both. The market for each of the segment outlooks has been provided on region & country basis for the above-mentioned forecast period.
The key industry dynamics, major technological trends, and application markets are evaluated to understand their impact on the demand for the forecast period. The growth rates were estimated using correlation, regression, and time-series analysis.
We have used the bottom-up approach for market sizing, analyzing key regional markets, dynamics, & trends for various products and end-users. The total market has been estimated by integrating the country markets.
All market estimates and forecasts have been validated through primary interviews with the key industry participants.
Inflation has not been accounted for to estimate and forecast the market.
Numbers may not add up due to rounding off.
Europe consists of EU-8, Central & Eastern Europe, along with the Commonwealth of Independent States (CIS).
Asia Pacific includes South Asia, East Asia, Southeast Asia, and Oceania (Australia & New Zealand).
Latin America includes Central American countries and the South American continent
Middle East includes Western Asia (as assigned by the UN Statistics Division) and the African continent.
GVR strives to procure the latest and unique information for reports directly from industry experts, which gives it a competitive edge. Quality is of utmost importance to us, therefore every year we focus on increasing our experts’ panel. Primary interviews are one of the critical steps in identifying recent market trends and scenarios. This process enables us to justify and validate our market estimates and forecasts to our clients. With more than 8,000 reports in our database, we have connected with some key opinion leaders across various domains, including healthcare, technology, consumer goods, and the chemical sector. Our process starts with identifying the right platform for a particular type of report, i.e., emails, LinkedIn, seminars, or telephonic conversation, as every report is unique and requires a differentiated approach.
We send out questionnaires to different experts from various regions/ countries, which is dependent on the following factors:
Report/Market scope: If the market study is global, we send questionnaires to industry experts across various regions, including North America, Europe, Asia Pacific, Latin America, and MEA.
Market Penetration: If the market is driven by technological advancements, population density, disease prevalence, or other factors, we identify experts and send out questionnaires based on region or country dominance.
The time to start receiving responses from industry experts varies based on how niche or well-penetrated the market is. Our reports include a detailed chapter on the KoL opinion section, which helps our clients understand the perspective of experts already in the market space.
"The quality of research they have done for us has been excellent."