The global pet food ingredients market size was estimated at USD 60.48 billion in 2023 and is expected to grow at a compound annual growth rate (CAGR) of 4.9% from 2024 to 2030. The increasing adoption of pets globally and pet humanization due to the work-from-home trend, which affected consumer perception regarding the pet’s nutritional needs, are driving the demand for the pet food ingredient market. The COVID-19 pandemic had a positive impact on the growth of the pet food ingredients market. During the pandemic, most consumers adopted pets, resulting in a spike in sales of pet food ingredients. This sales spike was witnessed during the first lockdown, as consumers stocked up on food in anticipation of future shortages. The growing trend of pet humanization was witnessed during the pandemic as consumers could spend more time bonding with their pets.
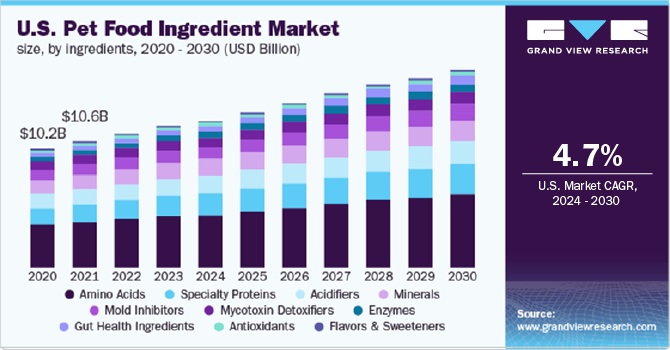
The increasing consumer awareness of pets' health-specific needs and the work-from-home trend resulted in an increase in the adoption of pets across the globe. Due to the work-from-home trend, pet parents have been able to bond with their pets and see them as a member of their family. This results in taking care of the specific needs of pets and becoming more aware of their nutritional needs, as different nourishment is required for pets that are sedentary, spayed, ill, or very active. These factors drive the demand for quality pet food in the pet market.
Manufacturers of all sizes, from start-ups to the most extensive pet retailers in the U.S., are introducing new goods and services such as human-grade fresh meals, activity monitors, and medical diagnostic tools. Many brands that market human-grade food for dogs and cats have emerged due to the rising pet humanization trend. Some of those meals include a whole wheat food diet, squash, and sweet potatoes. Animal-based pet food ingredients are associated with various health advantages, including improved skin and coat condition, improved cognitive benefits for older pets, and efficient support for digestive and intestinal health. For instance, Farmina, a global pet food manufacturer, manufactures various animal-based pet food items such as chicken, lamb, duck, and fish.
The market is relatively fragmented and competitive in nature. The market participants are focusing on increasing their market share. The market is at a promising stage characterized by various new product launches, expansion, mergers and acquisitions.
Key manufacturers are also inclined toward the establishment of production facilities at strategic locations to reduce transportation cost, benefit from local incentives, and make the product readily available to the end users.
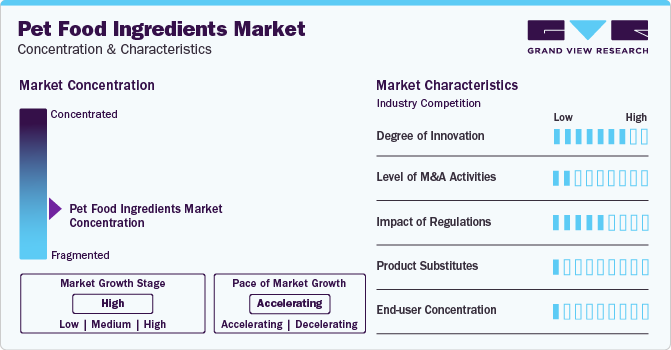
Key companies are fully integrated across the value chain, from growing agricultural crops to developing supplements for industrial and commercial use.Companies are anticipated to adopt backward as well as forward integration in order to ensure a consistent supply of raw materials and reduce costs involved in logistics & operations.
Companies enter into long term contracts with agricultural firms, meat processors and slaughter houses for sourcing raw materials. They employ highly qualified scientist who evaluate the product in terms of availability, quantity, and quality.
Based on ingredient type, the market has been segmented into amino acids, acidifiers, vitamins, specialty proteins, minerals, flavors and sweeteners, gut health ingredients, mold inhibitors, phosphates, and carotenoids. The amino acids segment accounted for the largest market share of 30.9% in 2022 in terms of revenue and is expected to expand at a CAGR of 6.3% in the forecast period. This is owing to the efficiencies offered by the ingredient, including supporting good vision, cardiac and immune system function, heart health, preventing infections, and slowing the growth of bacteria and pathogens among pets.
The gut health ingredient segment is expected to advance at the fastest CAGR of 10.9% during the forecast period of 2024-2030. As consumers today are looking for products having ingredients that support the gut health of pets and farm animals, the segment is expected to proliferate in the coming years. The increased awareness about pet health-specific ingredients and their availability in the market has given rise to this segment.
Based on pet, dogs dominated the market with a share of over 40% in 2023. Growing consumer concerns towards pet health have increased the spending on healthy dog foods. Dog obesity is one of the most common heath concerns amongst dog owners. According to Vet Innovations, Inc., nearly 100 million pets in the U.S. are estimated to be overweight Thus, with increasing health concerns the consumers have been adopting functional pet food with added ingredients such as nutrients, protein, vitamins, & minerals to keep their pets healthy.
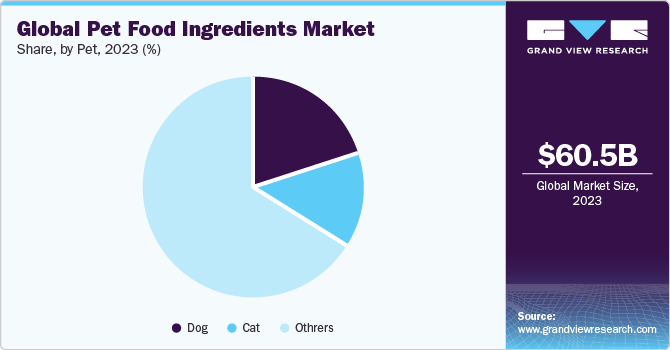
Prebiotics as well as probiotics are widely utilized gut health ingredients in cat food. Cats have short, simple gastrointestinal tracts leading to restricted capacity to ferment non-digestible substances. Hence in order to increase digestibility and maintain gut health, ingredients such as prebiotics are added. Prebiotic intake can reduce the occurrence or severity of infections. They stimulate the growth of healthy gut bacteria. While these ingredients are naturally present in cat food, some of the consumers externally supplement probiotics to cats’ diets.
Asia Pacific dominated the market with a share of over 35.0% in 2023. China dominated the Asia Pacific market and is expected to expand at the fastest CAGR of over 5.8% during the forecast period. The trend of grain-free & natural pet food and functional ingredients in pet food markets has been growing in popularity, which is gaining the interest of consumers in China. The regulations for pet food labeling in China include standardized tables with exact amounts of different ingredients that must be declared on a label. For instance, pet food must include at least 26% chicken to be designated a Chicken Formula. Additionally needed are declarations of moisture content.
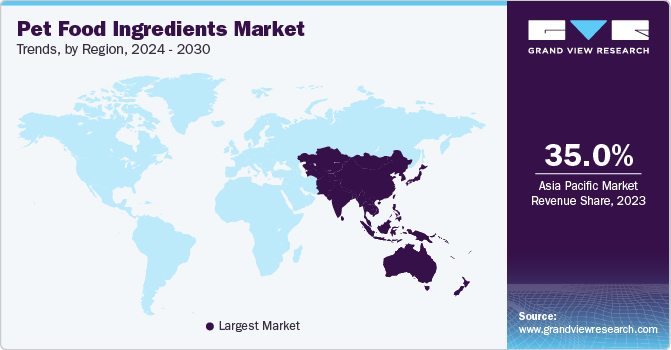
Australia has a pet population of approximately 28.7 million with dogs and cats accounting for a share of around 48% and 33% respectively. The consumers in the economy spend over USD 33.2 billion on pet care.
Europe pet food ingredients market accounted for a significant market share in 2023 and is anticipated to progress at a CAGR of over 4.5% over the forecast period. Western Europe dominated the region with a significant market share. This is attributed to several factors, including the increasing cat population over dogs, the pet humanization trend, growing consumer demand for high-quality pet food providing good health to pets, and the palatability of the ingredients. Countries such as Germany, the U.K., and France are significant contributors to the growth of the regional market.
The pet food ingredient market features various global and regional players, which makes it a competitive market. The world’s leading companies are using partnerships, collaborations, acquisitions, mergers, and agreements as strategies to withstand the intense competition and increase their market share.
Report Attribute |
Details |
Market size value in 2024 |
USD 62.88 billion |
Revenue forecast in 2030 |
USD 83.60 billion |
Growth rate |
CAGR of 4.9% from 2024 to 2030 |
Historical data |
2018 - 2023 |
Forecast period |
2024 - 2030 |
Quantitative Units |
Volume in kilotons, revenue in USD million/billion, and CAGR from 2024 to 2030 |
Report coverage |
Volume forecast, revenue forecast, competitive landscape, growth factors, and trends |
Segments covered |
Ingredient type, pet, region |
Regional scope |
U.S., Canada, Mexico, Western Europe, Germany, U.K., France, Eastern Europe, Russia, China, Japan, Thailand, Australia, Taiwan, South Korea, Brazil, Argentina, Chile, Colombia, Saudi Arabia , South Africa, Turkey, Morocco |
Country scope |
Acail Gás , Air Liquide, Air Products and Chemicals, Inc., Greco Gas Inc., Linde AG, Messer Group, Sicgil India Limited, SOL Group, Strandmøllen A/S, Taiyo Nippon Sanso Corporation |
Key companies profiled |
FoodSafe Technologies, Symrise, AFB International, DuPont Nutrition & Health, Biorigin, Lallemand, Inc., Eurotec Nutrition, Impextraco Ltda Brazil, Pancosma, Alltech, Vitablend Nederland B.V., Elanco |
Customization scope |
Free report customization (equivalent up to 8 analysts working days) with purchase. Addition or alteration to country, regional & segment scope. |
Pricing and purchase options |
Avail customized purchase options to meet your exact research needs. Explore purchase options |
This report forecasts revenue and volume growth at the global, regional, and country levels and provides an analysis of the latest industry trends and opportunities in each of the sub-segments from 2018 to 2030. For this study, Grand View Research has segmented the global pet food ingredients market report based on ingredient type, pet, and region:
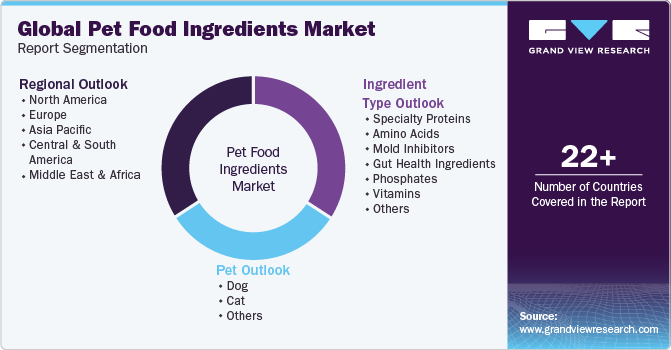
Ingredient Type Outlook (Volume, Kilotons, Revenue, USD Million, 2018 - 2030)
Specialty Proteins
Beef Proteins
Egg Proteins
Blended Proteins
Hydrolyzed Proteins
Pork Protein
Fish Protein
Poultry Protein
Ovine Proteins
Cervine Proteins
Other animal Proteins
Plant Proteins
Algal proteins
Amino Acids
Lysine
Methionine
Threonine
Cysteine
Others
Mold Inhibitors
Gut Health Ingredients
Beta-glucan
Cereals
Mushroom
Yeasts
Seaweed
Phosphates
Monocalcium
Dicalcium
Phospholipids
Others
Vitamins
Water-soluble
Fat-soluble
Acidifiers
Carotenoids
Astaxanthin
Beta-carotene
Zeaxanthine
Lutein
Others
Enzymes
Phytases
Carbohydrases
Proteases
Others
Mycotoxin Detoxifiers
Flavors & Sweeteners
Antimicrobials & Antibiotics
Minerals
Antioxidants
Pet Outlook (Volume, Kilotons, Revenue, USD Million, 2018 - 2030)
Dog
Cat
Others
North America
U.S.
Canada
Mexico
Europe
Western Europe
Germany
U.K.
France
Eastern Europe
Russia
Asia Pacific
China
Japan
Thailand
Australia
South Korea
Taiwan
Central & South America
Brazil
Argentina
Chile
Colombia
Middle East & Africa
Saudi Arabia
South Africa
Turkey
Morocco
b. The global pet food ingredients market size was estimated at USD 57.4 billion in 2022.
b. The global pet food ingredients market, in terms of revenue, is expected to grow at a compound annual growth rate of 4.8% from 2023 to 2030 to reach USD 83.6 billion by 2030
b. Asia Pacific dominated the pet food ingredients market with a revenue share of 36% in 2022. This is attributed to the presence of major market vendors, availability of raw materials, and labor at a lower price
b. Some of the key players operating in this industry are FoodSafe Technologies, Symrise, AFB International, DuPont Nutrition & Health, Biorigin, Lallemand Inc., Eurotec Nutrition, Impextraco Ltda Brazil, Pancosma, Altech, Vitablend Nederland B.V., and Elanco among others.
b. The key factors that are driving the global pet food ingredients market include pet humanization, pet premiumization, and increased pet ownership.
Table of Contents
Chapter 1. Pet Food Ingredients Market: Methodology and Scope
1.1. Market Segmentation & Scope
1.2. Market Definition
1.3. Information Procurement
1.3.1. Purchased Database
1.3.2. GVR’s Internal Database
1.3.3. Secondary Sources & Third-Party Perspectives
1.3.4. Primary Research
1.4. Information Analysis
1.4.1. Data Analysis Models
1.5. Market Formulation & Data Visualization
1.6. Data Validation & Publishing
Chapter 2. Pet Food Ingredients Market: Executive Summary
2.1. Market Insights
2.2. Segmental Outlook
2.3. Competitive Outlook
Chapter 3. Pet Food Ingredients Market: Variables, Trends & Scope
3.1. Market Lineage Outlook
3.2. Industry Value Chain Analysis
3.2.1. Raw Material Trends
3.2.2. Sales Channel Analysis
3.2.3. Manufacturing/Technology Overview
3.3. Price Trend Analysis, 2018 - 2030
3.3.1. Factors influencing Prices
3.4. Regulatory Framework
3.5. Trade Analysis
3.6. Market Dynamics
3.6.1. Market Driver Analysis
3.6.2. Market Restraint Analysis
3.6.3. Industry Opportunity Analysis
3.7. Porter’s Five Forces Analysis
3.7.1. Supplier Power
3.7.2. Buyer Power
3.7.3. Substitution Threat
3.7.4. Threat from New Entrant
3.7.5. Competitive Rivalry
3.8. PESTEL Analysis
3.8.1. Political Landscape
3.8.2. Economic Landscape
3.8.3. Social Landscape
3.8.4. Technological Landscape
3.8.5. Environmental Landscape
3.8.6. Legal Landscape
Chapter 4. Pet Food Ingredients Market: Ingredient Type Outlook Estimates & Forecasts
4.1. Pet Food Ingredients Market: Ingredient Type Movement Analysis, 2023 & 2030
4.2. Specialty Proteins
4.2.1. Market estimates and forecast, 2018 - 2030 (USD Million) (Kilotons)
4.2.2. Beef Proteins
4.2.2.1. Market estimates and forecast, 2018 - 2030 (USD Million) (Kilotons)
4.2.3. Egg Proteins
4.2.3.1. Market estimates and forecast, 2018 - 2030 (USD Million) (Kilotons)
4.2.4. Blended Proteins
4.2.4.1. Market estimates and forecast, 2018 - 2030 (USD Million) (Kilotons)
4.2.5. Hydrolyzed Proteins
4.2.5.1. Market estimates and forecast, 2018 - 2030 (USD Million) (Kilotons)
4.2.6. Pork Protein
4.2.6.1. Market estimates and forecast, 2018 - 2030 (USD Million) (Kilotons)
4.2.7. Fish Protein
4.2.7.1. Market estimates and forecast, 2018 - 2030 (USD Million) (Kilotons)
4.2.8. Poultry Protein
4.2.8.1. Market estimates and forecast, 2018 - 2030 (USD Million) (Kilotons)
4.2.9. Ovine Proteins
4.2.9.1. Market estimates and forecast, 2018 - 2030 (USD Million) (Kilotons)
4.2.10. Cervine Proteins
4.2.10.1. Market estimates and forecast, 2018 - 2030 (USD Million) (Kilotons)
4.2.11. Other animal Proteins
4.2.11.1. Market estimates and forecast, 2018 - 2030 (USD Million) (Kilotons)
4.2.12. Plant Proteins
4.2.12.1. Market estimates and forecast, 2018 - 2030 (USD Million) (Kilotons)
4.2.13. Algal proteins
4.2.13.1. Market estimates and forecast, 2018 - 2030 (USD Million) (Kilotons)
4.3. Amino Acids
4.3.1. Market estimates and forecast, 2018 - 2030 (USD Million) (Kilotons)
4.3.2. Lysine
4.3.2.1. Market estimates and forecast, 2018 - 2030 (USD Million) (Kilotons)
4.3.3. Methionine
4.3.3.1. Market estimates and forecast, 2018 - 2030 (USD Million) (Kilotons)
4.3.4. Threonine
4.3.4.1. Market estimates and forecast, 2018 - 2030 (USD Million) (Kilotons)
4.3.5. Cysteine
4.3.5.1. Market estimates and forecast, 2018 - 2030 (USD Million) (Kilotons)
4.3.6. Others
4.3.6.1. Market estimates and forecast, 2018 - 2030 (USD Million) (Kilotons)
4.4. Mold Inhibitors
4.4.1. Market estimates and forecast, 2018 - 2030 (USD Million) (Kilotons)
4.5. Gut Health Ingredients
4.5.1. Market estimates and forecast, 2018 - 2030 (USD Million) (Kilotons)
4.5.2. Beta-Glucan
4.5.2.1. Market estimates and forecast, 2018 - 2030 (USD Million) (Kilotons)
4.5.3. Cereals
4.5.3.1. Market estimates and forecast, 2018 - 2030 (USD Million) (Kilotons)
4.5.4. Mushroom
4.5.4.1. Market estimates and forecast, 2018 - 2030 (USD Million) (Kilotons)
4.5.5. Yeasts
4.5.5.1. Market estimates and forecast, 2018 - 2030 (USD Million) (Kilotons)
4.5.6. Seaweed
4.5.6.1. Market estimates and forecast, 2018 - 2030 (USD Million) (Kilotons)
4.6. Phosphates
4.6.1. Market estimates and forecast, 2018 - 2030 (USD Million) (Kilotons)
4.6.2. Monocalcium
4.6.2.1. Market estimates and forecast, 2018 - 2030 (USD Million) (Kilotons)
4.6.3. Dicalcium
4.6.3.1. Market estimates and forecast, 2018 - 2030 (USD Million) (Kilotons)
4.6.4. Phospholipids
4.6.4.1. Market estimates and forecast, 2018 - 2030 (USD Million) (Kilotons)
4.6.5. Others
4.6.5.1. Market estimates and forecast, 2018 - 2030 (USD Million) (Kilotons)
4.7. Vitamins
4.7.1. Market estimates and forecast, 2018 - 2030 (USD Million) (Kilotons)
4.7.2. Water-Soluble
4.7.2.1. Market estimates and forecast, 2018 - 2030 (USD Million) (Kilotons)
4.7.3. Fat-Soluble
4.7.3.1. Market estimates and forecast, 2018 - 2030 (USD Million) (Kilotons)
4.8. Acidifiers
4.8.1. Market estimates and forecast, 2018 - 2030 (USD Million) (Kilotons)
4.9. Carotenoids
4.9.1. Market estimates and forecast, 2018 - 2030 (USD Million) (Kilotons)
4.9.2. Astaxanthin
4.9.2.1. Market estimates and forecast, 2018 - 2030 (USD Million) (Kilotons)
4.9.3. Beta-Carotene
4.9.3.1. Market estimates and forecast, 2018 - 2030 (USD Million) (Kilotons)
4.9.4. Zeaxanthine
4.9.4.1. Market estimates and forecast, 2018 - 2030 (USD Million) (Kilotons)
4.9.5. Lutein
4.9.5.1. Market estimates and forecast, 2018 - 2030 (USD Million) (Kilotons)
4.9.6. Others
4.9.6.1. Market estimates and forecast, 2018 - 2030 (USD Million) (Kilotons)
4.10. Enzymes
4.10.1. Market estimates and forecast, 2018 - 2030 (USD Million) (Kilotons)
4.10.2. Phytases
4.10.2.1. Market estimates and forecast, 2018 - 2030 (USD Million) (Kilotons)
4.10.3. Carbohydrases
4.10.3.1. Market estimates and forecast, 2018 - 2030 (USD Million) (Kilotons)
4.10.4. Proteases
4.10.4.1. Market estimates and forecast, 2018 - 2030 (USD Million) (Kilotons)
4.10.5. Others
4.10.5.1. Market estimates and forecast, 2018 - 2030 (USD Million) (Kilotons)
4.11. Mycotoxin Detoxifiers
4.11.1. Market estimates and forecast, 2018 - 2030 (USD Million) (Kilotons)
4.12. Flavors & Sweeteners
4.12.1. Market estimates and forecast, 2018 - 2030 (USD Million) (Kilotons)
4.13. Antimicrobials & Antibiotics
4.13.1. Market estimates and forecast, 2018 - 2030 (USD Million) (Kilotons)
4.14. Minerals
4.14.1. Market estimates and forecast, 2018 - 2030 (USD Million) (Kilotons)
4.15. Antioxidants
4.15.1. Market estimates and forecast, 2018 - 2030 (USD Million) (Kilotons)
Chapter 5. Pet Food Ingredients Market: Pet Outlook Estimates & Forecasts
5.1. Pet Food Ingredients Market: Pet Movement Analysis, 2023 & 2030
5.2. Dog
5.2.1. Market estimates and forecast, 2018 - 2030 (USD Million) (Kilotons)
5.3. Cat
5.3.1. Market estimates and forecast, 2018 - 2030 (USD Million) (Kilotons)
5.4. Others
5.4.1. Market estimates and forecast, 2018 - 2030 (USD Million) (Kilotons)
Chapter 6. Pet Food Ingredients Market Regional Outlook Estimates & Forecasts
6.1. Regional Snapshot
6.2. Pet Food Ingredients Market: Regional Movement Analysis, 2023 & 2030
6.3. North America
6.3.1. Market estimates and forecast, 2018 - 2030 (USD Million) (Kilotons)
6.3.2. Market estimates and forecast, by ingredient type, 2018 - 2030 (USD Million) (Kilotons)
6.3.3. Market estimates and forecast, by pet, 2018 - 2030 (USD Million) (Kilotons)
6.3.4. U.S.
6.3.4.1. Key Country Dynamics
6.3.4.2. Market estimates and forecast, 2018 - 2030 (USD Million) (Kilotons)
6.3.4.3. Market estimates and forecast, by ingredient type, 2018 - 2030 (USD Million) (Kilotons)
6.3.4.4. Market estimates and forecast, by pet, 2018 - 2030 (USD Million) (Kilotons)
6.3.5. Canada
6.3.5.1. Key Country Dynamics
6.3.5.2. Market estimates and forecast, 2018 - 2030 (USD Million) (Kilotons)
6.3.5.3. Market estimates and forecast, by ingredient type, 2018 - 2030 (USD Million) (Kilotons)
6.3.5.4. Market estimates and forecast, by pet, 2018 - 2030 (USD Million) (Kilotons)
6.3.6. Mexico
6.3.6.1. Key Country Dynamics
6.3.6.2. Market estimates and forecast, 2018 - 2030 (USD Million) (Kilotons)
6.3.6.3. Market estimates and forecast, by ingredient type, 2018 - 2030 (USD Million) (Kilotons)
6.3.6.4. Market estimates and forecast, by pet, 2018 - 2030 (USD Million) (Kilotons)
6.4. Europe
6.4.1. Market estimates and forecast, 2018 - 2030 (USD Million) (Kilotons)
6.4.2. Market estimates and forecast, by ingredient type, 2018 - 2030 (USD Million) (Kilotons)
6.4.3. Market estimates and forecast, by pet, 2018 - 2030 (USD Million) (Kilotons)
6.4.4. Western Europe
6.4.4.1. Market estimates and forecast, 2018 - 2030 (USD Million) (Kilotons)
6.4.4.2. Market estimates and forecast, by ingredient type, 2018 - 2030 (USD Million) (Kilotons)
6.4.4.3. Market estimates and forecast, by pet, 2018 - 2030 (USD Million) (Kilotons)
6.4.4.4. Germany
6.4.4.4.1. Key Country Dynamics
6.4.4.4.2. Market estimates and forecast, 2018 - 2030 (USD Million) (Kilotons)
6.4.4.4.3. Market estimates and forecast, by ingredient type, 2018 - 2030 (USD Million) (Kilotons)
6.4.4.4.4. Market estimates and forecast, by pet, 2018 - 2030 (USD Million) (Kilotons)
6.4.4.5. France
6.4.4.5.1. Key Country Dynamics
6.4.4.5.2. Market estimates and forecast, 2018 - 2030 (USD Million) (Kilotons)
6.4.4.5.3. Market estimates and forecast, by ingredient type, 2018 - 2030 (USD Million) (Kilotons)
6.4.4.5.4. Market estimates and forecast, by pet, 2018 - 2030 (USD Million) (Kilotons)
6.4.4.6. UK
6.4.4.6.1. Key Country Dynamics
6.4.4.6.2. Market estimates and forecast, 2018 - 2030 (USD Million) (Kilotons)
6.4.4.6.3. Market estimates and forecast, by ingredient type, 2018 - 2030 (USD Million) (Kilotons)
6.4.4.6.4. Market estimates and forecast, by pet, 2018 - 2030 (USD Million) (Kilotons)
6.4.5. Eastern Europe
6.4.5.1. Market estimates and forecast, 2018 - 2030 (USD Million) (Kilotons)
6.4.5.2. Market estimates and forecast, by ingredient type, 2018 - 2030 (USD Million) (Kilotons)
6.4.5.3. Market estimates and forecast, by pet, 2018 - 2030 (USD Million) (Kilotons)
6.4.6. Russia
6.4.6.1. Key Country Dynamics
6.4.6.2. Market estimates and forecast, 2018 - 2030 (USD Million) (Kilotons)
6.4.6.3. Market estimates and forecast, by ingredient type, 2018 - 2030 (USD Million) (Kilotons)
6.4.6.4. Market estimates and forecast, by pet, 2018 - 2030 (USD Million) (Kilotons)
6.5. Asia Pacific
6.5.1. Market estimates and forecast, 2018 - 2030 (USD Million) (Kilotons)
6.5.2. Market estimates and forecast, by ingredient type, 2018 - 2030 (USD Million) (Kilotons)
6.5.3. Market estimates and forecast, by pet, 2018 - 2030 (USD Million) (Kilotons)
6.5.4. China
6.5.4.1. Key Country Dynamics
6.5.4.2. Market estimates and forecast, 2018 - 2030 (USD Million) (Kilotons)
6.5.4.3. Market estimates and forecast, by ingredient type, 2018 - 2030 (USD Million) (Kilotons)
6.5.4.4. Market estimates and forecast, by pet, 2018 - 2030 (USD Million) (Kilotons)
6.5.5. Japan
6.5.5.1. Key Country Dynamics
6.5.5.2. Market estimates and forecast, 2018 - 2030 (USD Million) (Kilotons)
6.5.5.3. Market estimates and forecast, by ingredient type, 2018 - 2030 (USD Million) (Kilotons)
6.5.5.4. Market estimates and forecast, by pet, 2018 - 2030 (USD Million) (Kilotons)
6.5.6. Thailand
6.5.6.1. Key Country Dynamics
6.5.6.2. Market estimates and forecast, 2018 - 2030 (USD Million) (Kilotons)
6.5.6.3. Market estimates and forecast, by ingredient type, 2018 - 2030 (USD Million) (Kilotons)
6.5.6.4. Market estimates and forecast, by pet, 2018 - 2030 (USD Million) (Kilotons)
6.5.7. Australia
6.5.7.1. Key Country Dynamics
6.5.7.2. Market estimates and forecast, 2018 - 2030 (USD Million) (Kilotons)
6.5.7.3. Market estimates and forecast, by ingredient type, 2018 - 2030 (USD Million) (Kilotons)
6.5.7.4. Market estimates and forecast, by pet, 2018 - 2030 (USD Million) (Kilotons)
6.5.8. South Korea
6.5.8.1. Key Country Dynamics
6.5.8.2. Market estimates and forecast, 2018 - 2030 (USD Million) (Kilotons)
6.5.8.3. Market estimates and forecast, by ingredient type, 2018 - 2030 (USD Million) (Kilotons)
6.5.8.4. Market estimates and forecast, by pet, 2018 - 2030 (USD Million) (Kilotons)
6.5.9. Taiwan
6.5.9.1. Key Country Dynamics
6.5.9.2. Market estimates and forecast, 2018 - 2030 (USD Million) (Kilotons)
6.5.9.3. Market estimates and forecast, by ingredient type, 2018 - 2030 (USD Million) (Kilotons)
6.5.9.4. Market estimates and forecast, by pet, 2018 - 2030 (USD Million) (Kilotons)
6.6. Central & South America
6.6.1. Market estimates and forecast, 2018 - 2030 (USD Million) (Kilotons)
6.6.2. Market estimates and forecast, by ingredient type, 2018 - 2030 (USD Million) (Kilotons)
6.6.3. Market estimates and forecast, by pet, 2018 - 2030 (USD Million) (Kilotons)
6.6.4. Brazil
6.6.4.1. Key Country Dynamics
6.6.4.2. Market estimates and forecast, 2018 - 2030 (USD Million) (Kilotons)
6.6.4.3. Market estimates and forecast, by ingredient type, 2018 - 2030 (USD Million) (Kilotons)
6.6.4.4. Market estimates and forecast, by pet, 2018 - 2030 (USD Million) (Kilotons)
6.6.5. Argentina
6.6.5.1. Key Country Dynamics
6.6.5.2. Market estimates and forecast, 2018 - 2030 (USD Million) (Kilotons)
6.6.5.3. Market estimates and forecast, by ingredient type, 2018 - 2030 (USD Million) (Kilotons)
6.6.5.4. Market estimates and forecast, by pet, 2018 - 2030 (USD Million) (Kilotons)
6.6.6. Chile
6.6.6.1. Key Country Dynamics
6.6.6.2. Market estimates and forecast, 2018 - 2030 (USD Million) (Kilotons)
6.6.6.3. Market estimates and forecast, by ingredient type, 2018 - 2030 (USD Million) (Kilotons)
6.6.6.4. Market estimates and forecast, by pet, 2018 - 2030 (USD Million) (Kilotons)
6.6.7. Colombia
6.6.7.1. Key Country Dynamics
6.6.7.2. Market estimates and forecast, 2018 - 2030 (USD Million) (Kilotons)
6.6.7.3. Market estimates and forecast, by ingredient type, 2018 - 2030 (USD Million) (Kilotons)
6.6.7.4. Market estimates and forecast, by pet, 2018 - 2030 (USD Million) (Kilotons)
6.7. Middle East & Africa
6.7.1. Market estimates and forecast, 2018 - 2030 (USD Million) (Kilotons)
6.7.2. Market estimates and forecast, by ingredient type, 2018 - 2030 (USD Million) (Kilotons)
6.7.3. Market estimates and forecast, by pet, 2018 - 2030 (USD Million) (Kilotons)
6.7.4. Saudi Arabia
6.7.4.1. Key Country Dynamics
6.7.4.2. Market estimates and forecast, 2018 - 2030 (USD Million) (Kilotons)
6.7.4.3. Market estimates and forecast, by ingredient type, 2018 - 2030 (USD Million) (Kilotons)
6.7.4.4. Market estimates and forecast, by pet, 2018 - 2030 (USD Million) (Kilotons)
6.7.5. South Africa
6.7.5.1. Key Country Dynamics
6.7.5.2. Market estimates and forecast, 2018 - 2030 (USD Million) (Kilotons)
6.7.5.3. Market estimates and forecast, by ingredient type, 2018 - 2030 (USD Million) (Kilotons)
6.7.5.4. Market estimates and forecast, by pet, 2018 - 2030 (USD Million) (Kilotons)
6.7.6. Turkey
6.7.6.1. Key Country Dynamics
6.7.6.2. Market estimates and forecast, 2018 - 2030 (USD Million) (Kilotons)
6.7.6.3. Market estimates and forecast, by ingredient type, 2018 - 2030 (USD Million) (Kilotons)
6.7.6.4. Market estimates and forecast, by pet, 2018 - 2030 (USD Million) (Kilotons)
6.7.7. Morocco
6.7.7.1. Key Country Dynamics
6.7.7.2. Market estimates and forecast, 2018 - 2030 (USD Million) (Kilotons)
6.7.7.3. Market estimates and forecast, by ingredient type, 2018 - 2030 (USD Million) (Kilotons)
6.7.7.4. Market estimates and forecast, by pet, 2018 - 2030 (USD Million) (Kilotons)
Chapter 7. Competitive Landscape
7.1. Company Categorization
7.2. Vendor Landscape
7.2.1. List Of Key Distributors & Channel Partners
7.3. Company Market Positioning Analysis, 2022
7.4. Company Heat Map Analysis
7.5. Strategy Mapping
Chapter 8. Company Profiles/Listing
8.1.1. FoodSafe Technologies
8.1.1.1. Company Overview
8.1.1.2. Financial Performance
8.1.1.3. Product Benchmarking
8.1.2. Symrise
8.1.2.1. Company Overview
8.1.2.2. Financial Performance
8.1.2.3. Product Benchmarking
8.1.3. AFB International
8.1.3.1. Company Overview
8.1.3.2. Financial Performance
8.1.3.3. Product Benchmarking
8.1.4. Danisco Animal Nutrition
8.1.4.1. Company Overview
8.1.4.2. Financial Performance
8.1.4.3. Product Benchmarking
8.1.5. Biorigin
8.1.5.1. Company Overview
8.1.5.2. Financial Performance
8.1.5.3. Product Benchmarking
8.1.6. Lallemand Inc.
8.1.6.1. Company Overview
8.1.6.2. Financial Performance
8.1.6.3. Product Benchmarking
8.1.7. Eurotec Nutrition
8.1.7.1. Company Overview
8.1.7.2. Financial Performance
8.1.7.3. Product Benchmarking
8.1.8. Impextraco NV
8.1.8.1. Company Overview
8.1.8.2. Financial Performance
8.1.8.3. Product Benchmarking
8.1.9. Pancosma
8.1.9.1. Company Overview
8.1.9.2. Financial Performance
8.1.9.3. Product Benchmarking
8.1.10. Altech
8.1.10.1. Company Overview
8.1.10.2. Financial Performance
8.1.10.3. Product Benchmarking
8.1.11. Vitablend Nederland BV
8.1.11.1. Company Overview
8.1.11.2. Financial Performance
8.1.11.3. Product Benchmarking
8.1.12. Elanco
8.1.12.1. Company Overview
8.1.12.2. Financial Performance
8.1.12.3. Product Benchmarking
List of Tables
Table 1. Pet food ingredients market estimates and forecasts, 2018 - 2030 (USD Million) (Kilotons)
Table 2. Pet food ingredients market estimates and forecasts, By Ingredient Type, 2018 - 2030 (USD Million)
Table 3. Pet food ingredients market estimates and forecasts, By Ingredient Type, 2018 - 2030 (Kilotons)
Table 4. Pet food ingredients market estimates and forecasts, By Pet, 2018 - 2030 (USD Million)
Table 5. Pet food ingredients market estimates and forecasts, By Pet, 2018 - 2030 (Kilotons)
Table 6. North America pet food ingredients market estimates and forecasts, 2018 - 2030 (USD Million) (Kilotons)
Table 7. North America pet food ingredients market estimates and forecasts, by ingredient type, 2018 - 2030 (USD Million)
Table 8. North America pet food ingredients market estimates and forecasts, by ingredient type, 2018 - 2030 (Kilotons)
Table 9. North America pet food ingredients market estimates and forecasts, by pet, 2018 - 2030 (USD Million)
Table 10. North America pet food ingredients market estimates and forecasts, by pet, 2018 - 2030 (Kilotons)
Table 11. U.S. pet food ingredients market estimates and forecasts, 2018 - 2030 (USD Million) (Kilotons)
Table 12. U.S. pet food ingredients market estimates and forecasts, by ingredient type, 2018 - 2030 (USD Million)
Table 13. U.S. pet food ingredients market estimates and forecasts, by ingredient type, 2018 - 2030 (Kilotons)
Table 14. U.S. pet food ingredients market estimates and forecasts, by pet, 2018 - 2030 (USD Million)
Table 15. U.S. pet food ingredients market estimates and forecasts, by pet, 2018 - 2030 (Kilotons)
Table 16. Canada pet food ingredients market estimates and forecasts, 2018 - 2030 (USD Million) (Kilotons)
Table 17. Canada pet food ingredients market estimates and forecasts, by ingredient type, 2018 - 2030 (USD Million)
Table 18. Canada pet food ingredients market estimates and forecasts, by ingredient type, 2018 - 2030 (Kilotons)
Table 19. Canada pet food ingredients market estimates and forecasts, by pet, 2018 - 2030 (USD Million)
Table 20. Canada pet food ingredients market estimates and forecasts, by pet, 2018 - 2030 (Kilotons)
Table 21. Mexico pet food ingredients market estimates and forecasts, 2018 - 2030 (USD Million) (Kilotons)
Table 22. Mexico pet food ingredients market estimates and forecasts, by ingredient type, 2018 - 2030 (USD Million)
Table 23. Mexico pet food ingredients market estimates and forecasts, by ingredient type, 2018 - 2030 (Kilotons)
Table 24. Mexico pet food ingredients market estimates and forecasts, by pet, 2018 - 2030 (USD Million)
Table 25. Mexico pet food ingredients market estimates and forecasts, by pet, 2018 - 2030 (Kilotons)
Table 26. Europe pet food ingredients market estimates and forecasts, 2018 - 2030 (USD Million) (Kilotons)
Table 27. Europe pet food ingredients market estimates and forecasts, by ingredient type, 2018 - 2030 (USD Million)
Table 28. Europe pet food ingredients market estimates and forecasts, by ingredient type, 2018 - 2030 (Kilotons)
Table 29. Europe pet food ingredients market estimates and forecasts, by pet, 2018 - 2030 (USD Million)
Table 30. Europe pet food ingredients market estimates and forecasts, by pet, 2018 - 2030 (Kilotons)
Table 31. Western Europe pet food ingredients market estimates and forecasts, 2018 - 2030 (USD Million) (Kilotons)
Table 32. Western Europe pet food ingredients market estimates and forecasts, by ingredient type, 2018 - 2030 (USD Million)
Table 33. Western Europe pet food ingredients market estimates and forecasts, by ingredient type, 2018 - 2030 (Kilotons)
Table 34. Western Europe pet food ingredients market estimates and forecasts, by pet, 2018 - 2030 (USD Million)
Table 35. Western Europe pet food ingredients market estimates and forecasts, by pet, 2018 - 2030 (Kilotons)
Table 36. Germany pet food ingredients market estimates and forecasts, 2018 - 2030 (USD Million) (Kilotons)
Table 37. Germany pet food ingredients market estimates and forecasts, by ingredient type, 2018 - 2030 (USD Million)
Table 38. Germany pet food ingredients market estimates and forecasts, by ingredient type, 2018 - 2030 (Kilotons)
Table 39. Germany pet food ingredients market estimates and forecasts, by pet, 2018 - 2030 (USD Million)
Table 40. Germany pet food ingredients market estimates and forecasts, by pet, 2018 - 2030 (Kilotons)
Table 41. UK pet food ingredients market estimates and forecasts, 2018 - 2030 (USD Million) (Kilotons)
Table 42. UK pet food ingredients market estimates and forecasts, by ingredient type, 2018 - 2030 (USD Million)
Table 43. UK pet food ingredients market estimates and forecasts, by ingredient type, 2018 - 2030 (Kilotons)
Table 44. UK pet food ingredients market estimates and forecasts, by pet, 2018 - 2030 (USD Million)
Table 45. UK pet food ingredients market estimates and forecasts, by pet, 2018 - 2030 (Kilotons)
Table 46. France pet food ingredients market estimates and forecasts, 2018 - 2030 (USD Million) (Kilotons)
Table 47. France pet food ingredients market estimates and forecasts, by ingredient type, 2018 - 2030 (USD Million)
Table 48. France pet food ingredients market estimates and forecasts, by ingredient type, 2018 - 2030 (Kilotons)
Table 49. France pet food ingredients market estimates and forecasts, by pet, 2018 - 2030 (USD Million)
Table 50. France pet food ingredients market estimates and forecasts, by pet, 2018 - 2030 (Kilotons)
Table 51. Eastern Europe pet food ingredients market estimates and forecasts, 2018 - 2030 (USD Million) (Kilotons)
Table 52. Eastern Europe pet food ingredients market estimates and forecasts, by ingredient type, 2018 - 2030 (USD Million)
Table 53. Eastern Europe pet food ingredients market estimates and forecasts, by ingredient type, 2018 - 2030 (Kilotons)
Table 54. Eastern Europe pet food ingredients market estimates and forecasts, by pet, 2018 - 2030 (USD Million)
Table 55. Eastern Europe pet food ingredients market estimates and forecasts, by pet, 2018 - 2030 (Kilotons)
Table 56. Russia pet food ingredients market estimates and forecasts, 2018 - 2030 (USD Million) (Kilotons)
Table 57. Russia pet food ingredients market estimates and forecasts, by ingredient type, 2018 - 2030 (USD Million)
Table 58. Russia pet food ingredients market estimates and forecasts, by ingredient type, 2018 - 2030 (Kilotons)
Table 59. Russia pet food ingredients market estimates and forecasts, by pet, 2018 - 2030 (USD Million)
Table 60. Russia pet food ingredients market estimates and forecasts, by pet, 2018 - 2030 (Kilotons)
Table 61. Asia Pacific pet food ingredients market estimates and forecasts, 2018 - 2030 (USD Million) (Kilotons)
Table 62. Asia Pacific pet food ingredients market estimates and forecasts, by ingredient type, 2018 - 2030 (USD Million)
Table 63. Asia Pacific pet food ingredients market estimates and forecasts, by ingredient type, 2018 - 2030 (Kilotons)
Table 64. Asia Pacific pet food ingredients market estimates and forecasts, by pet, 2018 - 2030 (USD Million)
Table 65. Asia Pacific pet food ingredients market estimates and forecasts, by pet, 2018 - 2030 (Kilotons)
Table 66. China pet food ingredients market estimates and forecasts, 2018 - 2030 (USD Million) (Kilotons)
Table 67. China pet food ingredients market estimates and forecasts, by ingredient type, 2018 - 2030 (USD Million)
Table 68. China pet food ingredients market estimates and forecasts, by ingredient type, 2018 - 2030 (Kilotons)
Table 69. China pet food ingredients market estimates and forecasts, by pet, 2018 - 2030 (USD Million)
Table 70. China pet food ingredients market estimates and forecasts, by pet, 2018 - 2030 (Kilotons)
Table 71. Japan pet food ingredients market estimates and forecasts, 2018 - 2030 (USD Million) (Kilotons)
Table 72. Japan pet food ingredients market estimates and forecasts, by ingredient type, 2018 - 2030 (USD Million)
Table 73. Japan pet food ingredients market estimates and forecasts, by ingredient type, 2018 - 2030 (Kilotons)
Table 74. Japan pet food ingredients market estimates and forecasts, by pet, 2018 - 2030 (USD Million)
Table 75. Japan pet food ingredients market estimates and forecasts, by pet, 2018 - 2030 (Kilotons)
Table 76. Thailand pet food ingredients market estimates and forecasts, 2018 - 2030 (USD Million) (Kilotons)
Table 77. Thailand pet food ingredients market estimates and forecasts, by ingredient type, 2018 - 2030 (USD Million)
Table 78. Thailand pet food ingredients market estimates and forecasts, by ingredient type, 2018 - 2030 (Kilotons)
Table 79. Thailand pet food ingredients market estimates and forecasts, by pet, 2018 - 2030 (USD Million)
Table 80. Thailand pet food ingredients market estimates and forecasts, by pet, 2018 - 2030 (Kilotons)
Table 81. Australia pet food ingredients market estimates and forecasts, 2018 - 2030 (USD Million) (Kilotons)
Table 82. Australia pet food ingredients market estimates and forecasts, by ingredient type, 2018 - 2030 (USD Million)
Table 83. Australia pet food ingredients market estimates and forecasts, by ingredient type, 2018 - 2030 (Kilotons)
Table 84. Australia pet food ingredients market estimates and forecasts, by pet, 2018 - 2030 (USD Million)
Table 85. Australia pet food ingredients market estimates and forecasts, by pet, 2018 - 2030 (Kilotons)
Table 86. South Korea pet food ingredients market estimates and forecasts, 2018 - 2030 (USD Million) (Kilotons)
Table 87. South Korea pet food ingredients market estimates and forecasts, by ingredient type, 2018 - 2030 (USD Million)
Table 88. South Korea pet food ingredients market estimates and forecasts, by ingredient type, 2018 - 2030 (Kilotons)
Table 89. South Korea pet food ingredients market estimates and forecasts, by pet, 2018 - 2030 (USD Million)
Table 90. South Korea pet food ingredients market estimates and forecasts, by pet, 2018 - 2030 (Kilotons)
Table 91. Taiwan pet food ingredients market estimates and forecasts, 2018 - 2030 (USD Million) (Kilotons)
Table 92. Taiwan pet food ingredients market estimates and forecasts, by ingredient type, 2018 - 2030 (USD Million)
Table 93. Taiwan pet food ingredients market estimates and forecasts, by ingredient type, 2018 - 2030 (Kilotons)
Table 94. Taiwan pet food ingredients market estimates and forecasts, by pet, 2018 - 2030 (USD Million)
Table 95. Taiwan pet food ingredients market estimates and forecasts, by pet, 2018 - 2030 (Kilotons)
Table 96. Central & South America pet food ingredients market estimates and forecasts, 2018 - 2030 (USD Million) (Kilotons)
Table 97. Central & South America pet food ingredients market estimates and forecasts, by ingredient type, 2018 - 2030 (USD Million)
Table 98. Central & South America pet food ingredients market estimates and forecasts, by ingredient type, 2018 - 2030 (Kilotons)
Table 99. Central & South America pet food ingredients market estimates and forecasts, by pet, 2018 - 2030 (USD Million)
Table 100. Central & South America pet food ingredients market estimates and forecasts, by pet, 2018 - 2030 (Kilotons)
Table 101. Brazil pet food ingredients market estimates and forecasts, 2018 - 2030 (USD Million) (Kilotons)
Table 102. Brazil pet food ingredients market estimates and forecasts, by ingredient type, 2018 - 2030 (USD Million)
Table 103. Brazil pet food ingredients market estimates and forecasts, by ingredient type, 2018 - 2030 (Kilotons)
Table 104. Brazil pet food ingredients market estimates and forecasts, by pet, 2018 - 2030 (USD Million)
Table 105. Brazil pet food ingredients market estimates and forecasts, by pet, 2018 - 2030 (Kilotons)
Table 106. Argentina pet food ingredients market estimates and forecasts, 2018 - 2030 (USD Million) (Kilotons)
Table 107. Argentina pet food ingredients market estimates and forecasts, by ingredient type, 2018 - 2030 (USD Million)
Table 108. Argentina pet food ingredients market estimates and forecasts, by ingredient type, 2018 - 2030 (Kilotons)
Table 109. Argentina pet food ingredients market estimates and forecasts, by pet, 2018 - 2030 (USD Million)
Table 110. Argentina pet food ingredients market estimates and forecasts, by pet, 2018 - 2030 (Kilotons)
Table 111. Chile pet food ingredients market estimates and forecasts, 2018 - 2030 (USD Million) (Kilotons)
Table 112. Chile pet food ingredients market estimates and forecasts, by ingredient type, 2018 - 2030 (USD Million)
Table 113. Chile pet food ingredients market estimates and forecasts, by ingredient type, 2018 - 2030 (Kilotons)
Table 114. Chile pet food ingredients market estimates and forecasts, by pet, 2018 - 2030 (USD Million)
Table 115. Chile pet food ingredients market estimates and forecasts, by pet, 2018 - 2030 (Kilotons)
Table 116. Colombia pet food ingredients market estimates and forecasts, 2018 - 2030 (USD Million) (Kilotons)
Table 117. Colombia pet food ingredients market estimates and forecasts, by ingredient type, 2018 - 2030 (USD Million)
Table 118. Colombia pet food ingredients market estimates and forecasts, by ingredient type, 2018 - 2030 (Kilotons)
Table 119. Colombia pet food ingredients market estimates and forecasts, by pet, 2018 - 2030 (USD Million)
Table 120. Colombia pet food ingredients market estimates and forecasts, by pet, 2018 - 2030 (Kilotons)
Table 121. Middle East & Africa pet food ingredients market estimates and forecasts, 2018 - 2030 (USD Million) (Kilotons)
Table 122. Middle East & Africa pet food ingredients market estimates and forecasts, by ingredient type, 2018 - 2030 (USD Million)
Table 123. Middle East & Africa pet food ingredients market estimates and forecasts, by ingredient type, 2018 - 2030 (Kilotons)
Table 124. Middle East & Africa pet food ingredients market estimates and forecasts, by pet, 2018 - 2030 (USD Million)
Table 125. Middle East & Africa pet food ingredients market estimates and forecasts, by pet, 2018 - 2030 (Kilotons)
Table 126. Saudi Arabia pet food ingredients market estimates and forecasts, 2018 - 2030 (USD Million) (Kilotons)
Table 127. Saudi Arabia pet food ingredients market estimates and forecasts, by ingredient type, 2018 - 2030 (USD Million)
Table 128. Saudi Arabia pet food ingredients market estimates and forecasts, by ingredient type, 2018 - 2030 (Kilotons)
Table 129. Saudi Arabia pet food ingredients market estimates and forecasts, by pet, 2018 - 2030 (USD Million)
Table 130. Saudi Arabia pet food ingredients market estimates and forecasts, by pet, 2018 - 2030 (Kilotons)
Table 131. South Africa pet food ingredients market estimates and forecasts, 2018 - 2030 (USD Million) (Kilotons)
Table 132. South Africa pet food ingredients market estimates and forecasts, by ingredient type, 2018 - 2030 (USD Million)
Table 133. South Africa pet food ingredients market estimates and forecasts, by ingredient type, 2018 - 2030 (Kilotons)
Table 134. South Africa pet food ingredients market estimates and forecasts, by pet, 2018 - 2030 (USD Million)
Table 135. South Africa pet food ingredients market estimates and forecasts, by pet, 2018 - 2030 (Kilotons)
Table 136. Turkey pet food ingredients market estimates and forecasts, 2018 - 2030 (USD Million) (Kilotons)
Table 137. Turkey pet food ingredients market estimates and forecasts, by ingredient type, 2018 - 2030 (USD Million)
Table 138. Turkey pet food ingredients market estimates and forecasts, by ingredient type, 2018 - 2030 (Kilotons)
Table 139. Turkey pet food ingredients market estimates and forecasts, by pet, 2018 - 2030 (USD Million)
Table 140. Turkey pet food ingredients market estimates and forecasts, by pet, 2018 - 2030 (Kilotons)
Table 141. Morocco pet food ingredients market estimates and forecasts, 2018 - 2030 (USD Million) (Kilotons)
Table 142. Morocco pet food ingredients market estimates and forecasts, by ingredient type, 2018 - 2030 (USD Million)
Table 143. Morocco pet food ingredients market estimates and forecasts, by ingredient type, 2018 - 2030 (Kilotons)
Table 144. Morocco pet food ingredients market estimates and forecasts, by pet, 2018 - 2030 (USD Million)
Table 145. Morocco pet food ingredients market estimates and forecasts, by pet, 2018 - 2030 (Kilotons)
List of Figures
Fig. 1. Market segmentation
Fig. 2. Information procurement
Fig. 3. Data Analysis Models
Fig. 4. Market Formulation and Validation
Fig. 5. Market snapshot
Fig. 6. Segmental outlook- Ingredient Type and Pet
Fig. 7. Competitive outlook
Fig. 8. Pet food ingredients market, 2018-2030 (USD Million) (Kilotons)
Fig. 9. Value chain analysis
Fig. 10. Market dynamics
Fig. 11. Porter’s Analysis
Fig. 12. PESTEL Analysis
Fig. 13. Pet food ingredients market, by ingredient type: Key takeaways
Fig. 14. Pet food ingredients market, by ingredient type: Market share, 2023 & 2030
Fig. 15. Pet food ingredients market, by pet: Key takeaways
Fig. 16. Pet food ingredients market, by pet: Market share, 2023 & 2030
Fig. 17. Pet food ingredients market, by region: Key takeaways
Fig. 18. Pet food ingredients market, by region: Market share, 2023 & 2030
Market Segmentation
There is a growing phenomenon of individuals choosing to remain single or without children for extended periods. This has led to an increase in the adoption of pets for companionship. While this trend is primarily observed in European and American countries, emerging economies like India and China are also quickly embracing this trend. Consequently, a rising demand for nutritious and healthy pet food is expected to stimulate the overall market. The pet food industry has experienced significant growth in recent years, as dogs, fish, cats, and birds have become popular household companions. The number of pets is projected to continue increasing at the same rate over the next four years, creating market opportunities for various companies involved in pet food ingredient manufacturing. The adoption of cats and dogs has increased the demand for pet medicines, food, and accessories. According to the American Pet Product Association, the average cat or dog owner spends between USD 200 and USD 300 on pet food annually. In recent years, pet owners have been treating their pets as part of the family, opting for expensive natural and organic pet foods and treats. This trend, coupled with the high disposable income of consumers, particularly in North America and Europe, has contributed to the growth of the pet food market. Most young individuals and couples prefer to live separately, leading to the prevalence of nuclear families. It has been observed that people living independently often choose to adopt pets, which is expected to drive the pet food market in the next seven years.
The ingredients used in pet food are an abundant source of proteins and omega-3 fatty acids. These components not only enhance the nutritional value of the food but also offer various benefits, such as promoting growth, improving protein digestion, increasing feed conversion, boosting the immune system, and reducing mortality rates in aquatic species. As a result, pet food manufacturers are becoming more aware of the nutritional advantages provided by protein-rich ingredients, which is expected to drive the demand for these ingredients. The demand for protein is rising due to the increasing awareness among consumers about the importance of consuming food with high nutritional value. According to Tyson Foods, Inc., global protein consumption reached 285 billion tons in 2018 and is projected to reach 298 billion tons by 2020. With its growing consumer base, the Asia Pacific region is mainly driving the demand for animal-based protein, including fish. This surge in demand is expected to fuel the market for fish and fish-derived pet food ingredients in the coming years. Notable manufacturers of fish-based ingredients include BioOregon Protein, Pacific Seafood, The Scoular Company, Valley Proteins, Inc., and K-Pro GmbH, among others.
Numerous individuals experience various allergies related to pets, which leads them to avoid owning pets altogether. This aspect could potentially hinder the growth of the pet food industry. Millions of people suffer from year-round allergies and infections caused by indoor allergens like animal dander, dust mite droppings, molds, and cockroaches. However, asthma is a common affliction among pet owners due to allergies to cats and dogs. The presence of bacteria, such as Campylobacter, in pet feces can contaminate human food, resulting in symptoms like diarrhea, cramping, abdominal pain, and fever within 2-5 days of exposure. Newborns and young babies are particularly susceptible to infections transmitted by pets. Unclean and dirty dog or cat hair can harbor tapeworms, hookworms, and roundworms. These worms can cause infections and severe health problems in newborns and young babies if ingested. The larvae of hookworms can even penetrate adult skin, causing itchy and painful rashes. Rabies, one of the most severe diseases, can be transmitted to humans from dogs and cats. On average, more than 58,000 people lose their lives each year as victims of this deadly disease. All these factors are expected to have a significant impact in the next five years, with a decreasing trend after that, thanks to improved medical treatments for human health conditions and preventive medicines for pet health.
This section will provide insights into the contents included in this smart home market report and help gain clarity on the structure of the report to assist readers in navigating smoothly.
Industry overview
Industry trends
Market drivers and restraints
Market size
Growth prospects
Porter’s analysis
PESTEL analysis
Key market opportunities prioritized
Competitive landscape
Company overview
Financial performance
Product benchmarking
Latest strategic developments
Market size, estimates, and forecast from 2018 to 2030
Market estimates and forecast for product segments up to 2030
Regional market size and forecast for product segments up to 2030
Market estimates and forecast for application segments up to 2030
Regional market size and forecast for application segments up to 2030
Company financial performance
pet food ingredientspet food ingredients
A three-pronged approach was followed for deducing the pet food ingredients market estimates and forecasts. The process has three steps: information procurement, analysis, and validation. The whole process is cyclical, and steps repeat until the estimates are validated. The three steps are explained in detail below:
Information procurement: Information procurement is one of the most extensive and important stages in our research process, and quality data is critical for accurate analysis. We followed a multi-channel data collection process for pet food ingredients market to gather the most reliable and current information possible.
Analysis: We mine the data collected to establish baselines for forecasting, identify trends and opportunities, gain insight into consumer demographics and drivers, and so much more. We utilized different methods of pet food ingredients market data depending on the type of information we’re trying to uncover in our research.
Market Research Efforts: Bottom-up Approach for estimating and forecasting demand size and opportunity, top-down Approach for new product forecasting and penetration, and combined approach of both Bottom-up and Top-down for full coverage analysis.
Value-Chain-Based Sizing & Forecasting: Supply-side estimates for understanding potential revenue through competitive benchmarking, forecasting, and penetration modeling.
Demand-side estimates for identifying parent and ancillary markets, segment modeling, and heuristic forecasting.
Qualitative Functional Deployment (QFD) Modelling for market share assessment.
Market formulation and validation: We mine the data collected to establish baselines for forecasting, identify trends and opportunities, gain insight into consumer demographics and drivers, and so much more. We utilize different methods of data analysis depending on the type of information we’re trying to uncover in our research.
Market Formulation: This step involves the finalization of market numbers. This step on an internal level is designed to manage outputs from the Data Analysis step.
Data Normalization: The final market estimates and forecasts are then aligned and sent to industry experts, in-panel quality control managers for validation.
This step also entails the finalization of the report scope and data representation pattern.
Validation: The process entails multiple levels of validation. All these steps run in parallel, and the study is forwarded for publishing only if all three levels render validated results.
The pet food ingredients market was categorized into three segments, namely ingredient type (Specialty Proteins, Amino Acids, Mold Inhibitors, Gut Health Ingredients, Phosphates, Vitamins, Acidifiers, Carotenoids, Enzymes, Mycotoxin Detoxifiers, Flavors & Sweeteners, Antimicrobials & Antibiotics, Minerals, Antioxidants), pet (Dog, Cat), and regions (North America, Europe, Asia Pacific, Central & South America, Middle East & Africa).
The pet food ingredients market was segmented into ingredient type, pet, and regions. The demand at a segment level was deduced using a funnel method. Concepts like the TAM, SAM, SOM, etc., were put into practice to understand the demand. We at GVR deploy three methods to deduce market estimates and determine forecasts. These methods are explained below:
Demand estimation of each product across countries/regions summed up to from the total market.
Variable analysis for demand forecast.
Demand estimation via analyzing paid database, and company financials either via annual reports or paid database.
Primary interviews for data revalidation and insight collection.
Used extensively for new product forecasting or analyzing penetration levels.
Tool used invoice product flow and penetration models Use of regression multi-variant analysis for forecasting Involves extensive use of paid and public databases.
Primary interviews and vendor-based primary research for variable impact analysis.
The pet food ingredients market was analyzed at a regional level. The globe was divided into North America, Europe, Asia Pacific, Central & South America, and Middle East & Africa, keeping in focus variables like consumption patterns, export-import regulations, consumer expectations, etc. These regions were further divided into twenty-three countries, namely, the U.S., Canada, Mexico, Western Europe, Germany, the UK., France, Eastern Europe, Russia, China, Japan, Thailand, Australia, Taiwan, South Korea, Brazil, Argentina, Chile, Colombia, Saudi Arabia , South Africa, Turkey, Morocco.
All three above-mentioned market research methodologies were applied to arrive at regional-level conclusions. The regions were then summed up to form the global market.
The pet food ingredients market was analyzed via companies operating in the sector. Analyzing these companies and cross-referencing them to the demand equation helped us validate our assumptions and conclusions. Key market players analyzed include:
DuPont de Nemours, Inc. - DuPont de Nemours, Inc. is a diversified conglomerate that operates in various business sectors, including Sustainable Solutions, Protection Solutions, Pioneer, Performance materials, Nutrition & Health, Industrial Biosciences, Electronics & Communication, and Crop Protection. The company provides a comprehensive range of products that cater to various industries such as chemicals, water solutions, safety & protection, plastics, packaging & printing, mining, marine, healthcare & medical, government & public sector, food & beverage, energy, electronics, building & construction, automotive, and agriculture. Additionally, through its subsidiary Danisco Animal Nutrition, the company offers feed ingredients for poultry, swine, dairy, aquatic, and other species.
FoodSafe Technologies - FoodSafe Technologies is a global manufacturer and distributor of food ingredients. The company specializes in providing products for both human and animal nutrition industries. FoodSafe Technologies focuses on developing various solutions to combat pathogens, particularly gram-negative bacteria, in food products. Additionally, the company creates antimicrobials and antioxidants that extend the shelf life of pet food products while preventing the growth of fungi and bacteria. FoodSafe Technologies is proud to offer innovative non-GMO natural antimicrobials and antioxidants designed explicitly for animal feed and pet food.
Diana Group - Diana Group specializes in providing nutritional solutions derived from natural sources. The company operates in four different business segments: food, pet food, aquaculture, and probiotics. Within the pet food segment, Diana Group focuses on developing and distributing sustainable and natural solutions for the pet food industry. These solutions aim to improve pets' nutrition and overall health, including dogs, cats, and fish. The company markets and distributes its products under various brands such as SPF, Vivae, Videka, and Panelis. With a global presence, Diana Group has 17 industrial sites and 18 sales offices. Additionally, the company is actively engaged in continuous research and development, with over 30 R&D sites worldwide. Since April 2014, Diana Group has been operating as a subsidiary of Symrise AG.
AFB International - AFB International is a global leader in the development and distribution of palatable enhancers for the pet food industry. Their extensive product portfolio includes dry, liquid, and specialty palatants that enhance the taste and appeal of dog and cat food. The company is actively involved in research and development activities focused on creating innovative food ingredients, and they have established collaborations with numerous pet food manufacturers. AFB International has also made significant contributions to the field by publishing white papers, research summaries, and articles on pet food ingredients. With manufacturing facilities strategically located in the United States, Argentina, Brazil, Mexico, the Netherlands, China, and Australia, the company ensures efficient production and distribution of its high-quality products. Furthermore, AFB International is fully integrated across the entire value chain, from sourcing raw materials to delivering finished products. Since 2020, the company has operated as a subsidiary of Ensign-Bickford Industries, Inc.
BHJ A/S - BHJ specializes in the production, processing, and global distribution of raw materials for meat and fish. The company provides functional animal proteins to the food and pet food industries. Its diverse product portfolio consists of both dry and wet pet food ingredients. Dry ingredients include palatability enhancers, fats, animal proteins, and slurries. Wet ingredients include frozen blocks, meat blends, and mechanically deboned meat (MDM). With 23 manufacturing plants and 15 offices, BHJ operates in nearly 13 countries worldwide. Since 2020, it has been operating as a subsidiary of The Lauridsen Group, Inc. (LGI).
Biorigin - Biorigin specializes in the production and distribution of natural ingredients for the human and animal nutrition industry. Their product range includes food and feed solutions. The food solutions are primarily targeted towards the food and beverage industry and are marketed under the brand names BioSavour, Bioenhance, and Goldcell. The feed solutions consist of proteins, prebiotics, mycotoxin adsorbents, selenized yeast, and palatability enhancers, which are used in pet and production animal food formulation. The company has manufacturing units in both the United States and Brazil and an R&D Center. The center is equipped with three laboratories and a pilot plant that utilizes advanced equipment to develop new products. Additionally, Biorigin collaborates with various national and international universities and research institutions to create sustainable products. The company operates as a subsidiary of the Zilor group.
Lallemand, Inc. - Lallemand, Inc. is a global company that specializes in the development and distribution of animal nutrition products. Its extensive product range includes yeast fractions, enzymes, amino acids, and proteins. These products are sold under brands such as Alkosel, Melofeed, Yang, Latlide, and Agrimos. The company operates two manufacturing facilities, one in North America and another in Europe. Furthermore, Lallemand is actively engaged in research and development initiatives, collaborating with companies, institutes, and universities worldwide.
American Dehydrated Foods, Inc. (ADF) - ADF is a renowned manufacturer and distributor of poultry ingredients for pet food manufacturers globally. Their range of products includes chicken fats, chicken broth (collagen source), and chicken proteins. The company's manufacturing facility in the United States is inspected by the USDA, ensuring high standards of quality. ADF also prioritizes product quality and safety by implementing HACCP principles. To ensure a steady supply of their products, ADF has established partnerships with distributors worldwide, including Cima Nutrition Nv-Sa, Commercial Wealth Co., LTD., Glob Chain International, and Universal Feed Mill Corporation. Since 2020, ADF has been operating as a subsidiary of Symrise.
Eurotech Nutrition - Eurotec Nutrition Group operates in more than 20 countries across Europe and Latin America. The company actively participates in various sectors such as feed ingredients, grains & seeds, biodiesel, and bran production. Currently, Eurotec Nutrition Group is focused on expanding its business in Thailand. The company offers a diverse range of antioxidant products utilized in pet foods, rations, flour, and oils for animal nutrition. In South America, aside from Brazil, Eurotec Nutrition Group has a presence in Buenos Aires and Argentina, with established offices throughout the region through a network of vendors and distributors. Eurotec Nutrition, based in Argentina, is a family-owned enterprise committed to producing, distributing, marketing, and formulating animal additives and products.
Impextraco Ltda Brazil - Impextraco Ltda Brazil is a leading manufacturer and provider of functional feed for the pet food industry. The company offers many products, including vitamins, minerals, amino acids, anticoccidials, growth enhancers, antioxidants, mycotoxin binders, and prebiotics. With a fully integrated value chain, Impextraco is involved in every step of the process, from sourcing raw materials to distributing finished products. The company strategically locates its warehouses and production plants near airports to ensure efficient transportation.
Supply Side Estimates
Company revenue estimation via referring to annual reports, investor presentations, and Hoover’s.
Segment revenue determination via variable analysis and penetration modeling.
Competitive benchmarking to identify market leaders and their collective revenue shares.
Forecasting via analyzing commercialization rates, pipelines, market initiatives, distribution networks, etc.
Demand side estimates
Identifying parent markets and ancillary markets
Segment penetration analysis to obtain pertinent
revenue/volume
Heuristic forecasting with the help of subject matter experts
Forecasting via variable analysis
Understanding market dynamics (in terms of drivers, restraints, & opportunities) in the countries.
Understanding trends & variables in the individual countries & their impact on growth and using analytical tools to provide high-level insights into the market dynamics and the associated growth pattern.
Understanding market estimates and forecasts (with the base year as 2023, historic information from 2018 to 2023, and forecast from 2024 to 2030). Regional estimates & forecasts for each category are available and are summed up to form the global market estimates.
The report provides market value for the base year 2023 and a yearly forecast till 2030 in terms of revenue/volume or both. The market for each of the segment outlooks has been provided on region & country basis for the above-mentioned forecast period.
The key industry dynamics, major technological trends, and application markets are evaluated to understand their impact on the demand for the forecast period. The growth rates were estimated using correlation, regression, and time-series analysis.
We have used the bottom-up approach for market sizing, analyzing key regional markets, dynamics, & trends for various products and end-users. The total market has been estimated by integrating the country markets.
All market estimates and forecasts have been validated through primary interviews with the key industry participants.
Inflation has not been accounted for to estimate and forecast the market.
Numbers may not add up due to rounding off.
Europe consists of EU-8, Central & Eastern Europe, along with the Commonwealth of Independent States (CIS).
Asia Pacific includes South Asia, East Asia, Southeast Asia, and Oceania (Australia & New Zealand).
Latin America includes Central American countries and the South American continent
Middle East includes Western Asia (as assigned by the UN Statistics Division) and the African continent.
GVR strives to procure the latest and unique information for reports directly from industry experts, which gives it a competitive edge. Quality is of utmost importance to us, therefore every year we focus on increasing our experts’ panel. Primary interviews are one of the critical steps in identifying recent market trends and scenarios. This process enables us to justify and validate our market estimates and forecasts to our clients. With more than 8,000 reports in our database, we have connected with some key opinion leaders across various domains, including healthcare, technology, consumer goods, and the chemical sector. Our process starts with identifying the right platform for a particular type of report, i.e., emails, LinkedIn, seminars, or telephonic conversation, as every report is unique and requires a differentiated approach.
We send out questionnaires to different experts from various regions/ countries, which is dependent on the following factors:
Report/Market scope: If the market study is global, we send questionnaires to industry experts across various regions, including North America, Europe, Asia Pacific, Latin America, and MEA.
Market Penetration: If the market is driven by technological advancements, population density, disease prevalence, or other factors, we identify experts and send out questionnaires based on region or country dominance.
The time to start receiving responses from industry experts varies based on how niche or well-penetrated the market is. Our reports include a detailed chapter on the KoL opinion section, which helps our clients understand the perspective of experts already in the market space.
NEED A CUSTOM REPORT?
We can customize every report - free of charge - including purchasing stand-alone sections or country-level reports, as well as offer affordable discounts for start-ups & universities. Contact us now
We are GDPR and CCPA compliant! Your transaction & personal information is safe and secure. For more details, please read our privacy policy.
"The quality of research they have done for us has been excellent."