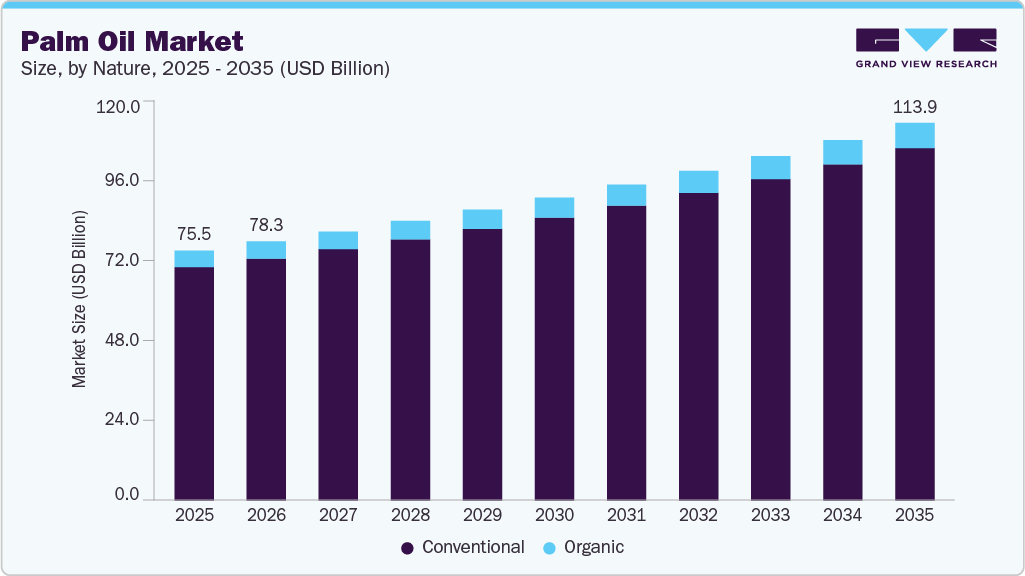
The global palm oil market size was valued at USD 70.44 billion in 2023 and is anticipated to grow at a compound annual growth rate (CAGR) of 5.1% from 2024 to 2030. The market is driven by exponentially growing demand from the food, beverage, biofuel, energy, personal care, and cosmetics industries. Major manufacturers are in Asia Pacific region due to tease of availability of raw materials in region. Market is highly competitive as well as comprehensive in nature owing to presence of a large number of all scale players which try to gain a competitive edge over others with their high production, superior distribution networks,product quality, and various competitive strategies.
Indonesia is largest palm oil producer as well as exporter of the same. Country exports product globally. The government also supports cultivators of palm plant. It is a major source of income for many small and medium scale producers in region. The industry is majorly responsible for development and upliftment of cultivators in region.
Similarly, product has witnessed increasing demand from biofuel industry. It is used in production of biofuel which is further used as a sustainable alternative to crude oil in many applications such as engine oil. Biofuel industry is a budding industry with limited applications for now.
Although industry is expected to attain development as many players are involved in research and development of industry. As the industry will gain ground demand for palm oil from industry is expected to increase and drive product market.
The market is moderately consolidated and highly competitive in nature.The players in the industry are inclined towards expansions, mergers & acquisitions, and new product launches. Players adopt these strategies to increase the reach of their products in the market and availability of their products & services in diverse geographical areas. Key market players adopting the inorganic growth strategies include Godrej Agrovet ltd., Patanjali Foods, 3F Industries, ADM, and IOI Corporation Bhd.
The government of Brazil is focused on sustainable production of palm oil for biodiesel production. The Ministry of Mines and Energy (MME) initiated a RenovaBio Program in December 2016, which legalizes the biofuel manufacturing units. Similarly, in January 2023, Godrej Agrovet Ltd. received the Indian Oil Palm Certification under the Indian Palm Oil Sustainability (IPOS) framework in recognition of the ethical business practices it has implemented in the production. These type of government initiatives are anticipated to contribute to the wellbeing of the palm oil industry in the near future.
Conventional segment dominated the market with a revenue share of more than 99% in 2023. This is attributable to the low price and easy availability of the segment. Conventional oil palm farms are a crucial source of income for small and medium sized cultivators as they can increase production with the help of synthetic chemicals. The conventional nature segment is more popular in low-income countries with high populations.
Contemporary to the conventional nature segment is the organic nature segment, which holds a very small share of market due to difficulties in production which reduce availability of products in the market. The stringent regulations for production as well as very expensive products necessary for production such as specialized soil maintenance products, makes it financially infeasible and difficult for the manufacturers to produce in large quantities. Although increasing awareness about the benefits of organic products is anticipated to attain rapid growth rate.
Fractionated palm oil dominated the market with a revenue share of over 39.2% in 2023. This is attributable to the ease of availability of product and economically feasible prices. It is very popular in low-income countries as it is abundantly available as well as affordable for masses. Constituent nature of product makes it more affluent to manufacture in large quantities.
Another major product segment is the Crude Palm Oil (CPO) product segment, which added a substantial share of 25% to global revenue owing to its major end use application in the food & beverage industry. The presence of vitamin A gives this product segment edge over the other segments making its utilization in edible products more desirable.
Its extensive use in the food industry is expected to drive market demand. There is also significant demand for CPO from cosmetics, and pharmaceutical end-use industries, as it is a crucial ingredient for production of many products from these industries.
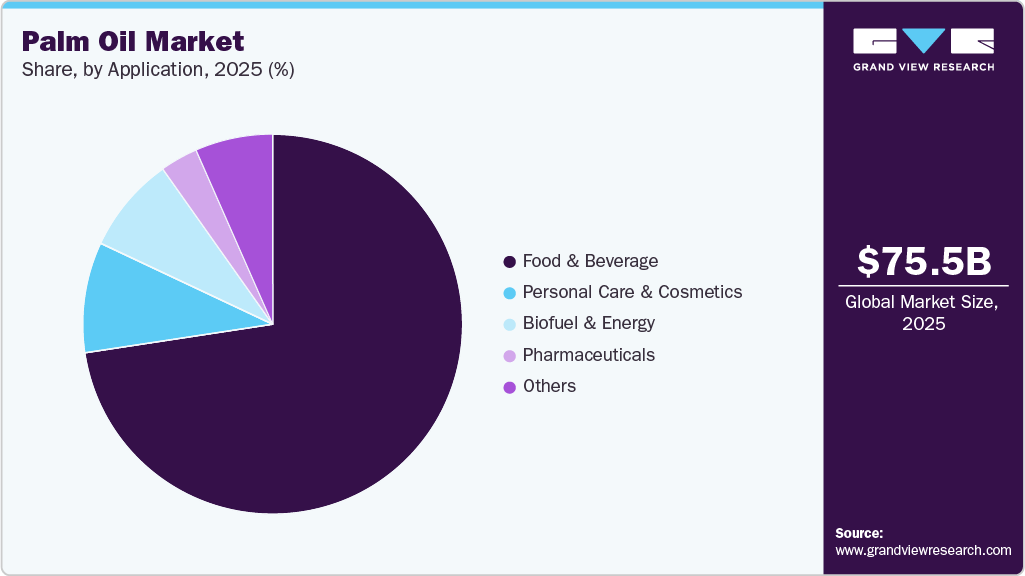
Food & beverages end-use dominated the market with a revenue share of more than 66.5% in 2023. Its high share is attributable to increasing usage of product in end use applications of the industry and increasing product portfolios that demand palm oil as a raw material. The rise in global population has also affected global product growth boosting product demand in international market.
With a scanty difference in their revenue share following the food and beverage end use segment are personal care & cosmetics and biofuel & energy end use segments. These are growing segment and are expected to attain prompt growth in coming years as advancement of technologies will occur.
The personal care & cosmetics end use segment has a moderate growth rate and is expected to contribute significantly to global revenue share by end of forecast period. In 2023, segment contributed 16% to global revenue share of product market. The diversification in product portfolios and increasing demand for organic and sustainable products that are plant based are expected to drive demand from this segment.
On the contrary to personal care & cosmetics segment, which is an established market, biofuel is a budding market which is expected to gain its full potential in foreseen period as the advancement of technology will take place. In near future as the deposits for non-renewable resources are declining biofuel which is an environment friendly alternative to conventional fuels can become a light of hope for energy industry.
Asia Pacific region dominated market with a revenue share of 68.9% in 2023. This is attributed to growing consumption by rising population of the region as well as high demand from end use applications industries, such as food & beverage industries. Rapid increase in population, changing demographic trends, and diverse food application in India and China is accountable for high consumption in the region.
This product is a major source of income for countries like Indonesia and Malaysia, which are large producers globally. Income from this business had helped countries producing palm oil to develop and advance. Small and medium players in these countries are solely dependent on revenue from this oil for their livelihood. Over the forecast period the market in the Asia Pacific region of expected to grow rapidly owing to increased demand from a growing population.
Indonesia & Malaysia accounted for approximately 85% of the global production of palm oil wherein more than 75% of the production is being exported to international markets with India being one of the largest importer followed by China and Europe. Growing imports in the India palm oil market; due to higher demand for edible oils in the food & beverage industry, is anticipated to contribute to the market growth.
North America region is anticipated to exhibit exponential growth in near future, due to distinguished demography of region, change in eating habits of mass and increase in demand from food industry for making various delicacies. The North America market has a lot of untapped potential currently which is another reason for rapid growth of product in region.
Palm oil consumption in the Middle East has been on a robust growth trajectory owing to a strong economic position and growing demand for various food items from tourists and regional consumers. Furthermore, the boom in Lagos construction sector owing to the development of megacity projects and hospitality resources including restaurants, hotels, and malls has also contributed to growth in the Nigeria palm oil market, especially for food & beverage applications.
The market has presence of multinational companies such as ADM and Wilmar International Ltd. which make market more competitive. Major players have acquired plantations or contracts with cultivators to ensure constant supply of raw materials. Volatility in prices of raw material adversely affect profitability of product. For the same, in 2023, Nagaland government signed memorandum of understanding (MoU) with Patanjali Food palm oil cultivation.
The products manufacturers are engaged in continuous R&D activities, capacity expansion, mergers & acquisitions, and other strategies to gain a competitive advantage over others. For example, In November 2019, PT. Mahkota Group acquired a palm oil mill in South Sumatra, through subsidiary, PT Berlian Inti Mekar. This plant produces CPO based products such as cooking oil or olein and processing about 400 tons of palm kernel oil per day.
Report Attribute |
Details |
Market size value in 2024 |
USD 73.77 billion |
Revenue forecast in 2030 |
USD 100.04 billion |
Growth Rate |
CAGR of 5.1% from 2024 to 2030 |
Historical data |
2018 - 2022 |
Forecast period |
2024 - 2030 |
Quantitative units |
Revenue in USD million/billion, volume in kilotons and CAGR from 2024 to 2030 |
Report coverage |
Revenue forecast, company ranking, competitive landscape, growth factors, and trends |
Segments covered |
Nature, product, end-use, region |
Regional scope |
North America; Europe; Asia Pacific; Central & South America; Middle East & Africa |
Country scope |
U.S.; Mexico; Canada; Germany; UK; France; Spain, Italy, Russia, China, India, Japan, South Korea, Malaysia, Indonesia, Brazil, Argentina, Colombia, South Africa, Saudi Arabia, Turkey, UAE, Oman, Yemen, Kenya, Nigeria, Ghana, Egypt |
Key companies profiled |
ADM; Wilmar International Ltd.; Sime Darby Plantation Berhad; IOI Corporation Berhad; Kuala Lumpur Kepong Berhad; United Plantations Berhad; Kulim (Malaysia) Berhad; IJM Corporation Berhad; PT Sampoerna Agro, Tbk; Univanich Palm Oil Public Company Ltd.; PT. Bakrie Sumatera Plantations tbk; Asian Agri |
Customization scope |
Free report customization (equivalent up to 8 analysts working days) with purchase. Addition or alteration to country, regional & segment scope. |
Pricing and purchase options |
Avail customized purchase options to meet your exact research needs. Explore purchase options |
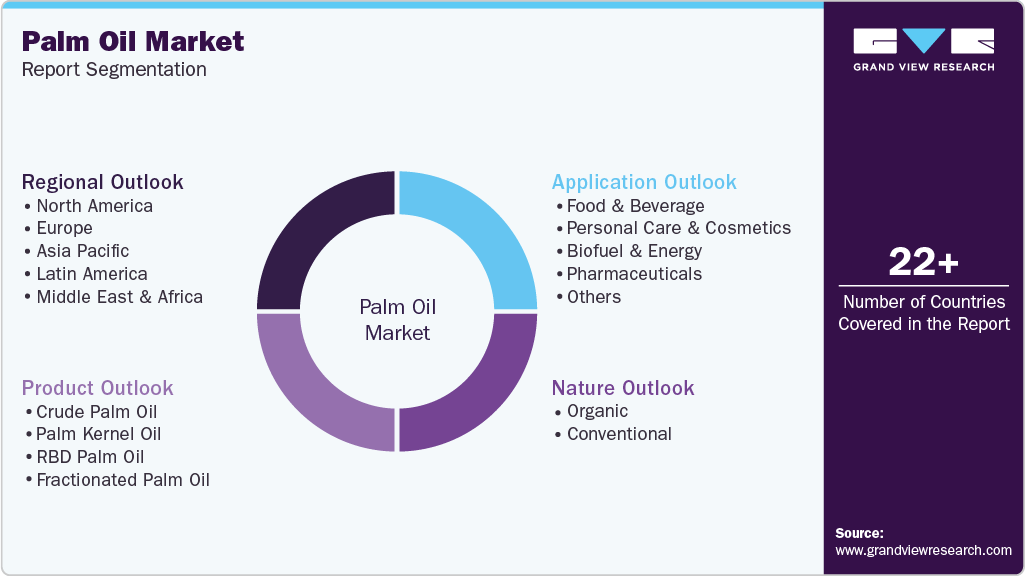
This report forecasts revenue growth at global, regional, and country levels and provides an analysis on the latest industry trends in each of the sub-segments from 2018 to 2030. For this study, Grand View Research has segmented the global palm oil market report based on nature, product, end-use and region:
Nature Outlook (Revenue, USD Million; Volume, Kilotons; 2018 - 2030)
Organic
Conventional
Product Outlook (Revenue, USD Million; Volume, Kilotons; 2018 - 2030)
Crude Palm Oil
RBD Palm Oil
Palm Kernel Oil
Fractionated Palm Oil
End-use Outlook (Revenue, USD Million; Volume, Kilotons; 2018 - 2030)
Food & Beverage
Personal Care & Cosmetics
Biofuel & Energy
Pharmaceuticals
Others
Regional Outlook (Revenue, USD Million; Volume, Kilotons; 2018 - 2030)
North America
U.S.
Mexico
Canada
Europe
Germany
UK
France
Spain
Italy
Russia
Asia Pacific
China
India
Japan
South Korea
Malaysia
Indonesia
Central & South America
Brazil
Argentina
Colombia
Middle East & Africa
South Africa
Saudi Arabia
Turkey
UAE
Oman
Yemen
Kenya
Nigeria
Ghana
Egypt
b. The global palm oil market size was estimated at USD 67.3 billion in 2022 and is expected to reach USD 70.4 billion in 2023.
b. The global palm oil market is expected to grow at a compound annual growth rate of 5.1% from 2023 to 2030 to reach USD 100.0 billion by 2030.
b. Crude palm oil (CPO) dominated the palm oil market with a share of over 55% in 2022. This is attributable to Increasing consumption in oleochemicals production of agrochemicals and cleaning products.
b. Some key players operating in the palm oil market include Wilmar; Sime Darby; IOI Corporation; Kuala Lumpur Kepong; and United Plantations Berhad
b. Key factors that are driving the palm oil market growth include increasing demand for palm oil derivatives and oleochemicals from different end-use industries.
Table of Contents
Chapter 1 Palm Oil Market: Methodology and Scope
1.1 Market Segmentation & Scope
1.2 Market Definition
1.3 Information Procurement
1.3.1 Purchased Database
1.3.2 GVR’s Internal Database
1.5 Information analysis
1.6 Market formulation & data visualization
1.7 Data validation & publishing
1.7.1 Research scope and assumptions
1.7.2 List to Data Sources
Chapter 2 Palm Oil Market: Executive Summary
2.1 Market Outlook
2.2 Segmental Outlook
2.3 Competitive Insights
Chapter 3 Palm Oil Market: Variables, Trends & Scope
3.1 Market Lineage Outlook
3.1.1 Global Vegetable Oils Market Outlook
3.2 Penetration & Growth Prospect Mapping
3.3 Country-Specific Palm Oil Productivity and Cost Structure Analysis
3.4 Palm Oil Plantation Without Deforestation in Mexico
3.5 Palm Oil Trade Flow
3.6 Factors Triggering Palm Oil Demand in De-Deficit Countries of Latin America
3.7 List of Food Brands with Palm Oil
3.8 Industry Value Chain Analysis
3.8.1 Raw Material Trends
3.8.2 Manufacturing trends
3.9 Price Trend Analysis
3.10 Technology Outlook
3.11 Regulatory Framework
3.12 Impact of COVID-19 Pandemic
3.13 Palm Oil Market Dynamics
3.13.2 Market Driver Analysis
3.13.2.1 Growing demand for natural and eco-friendly ingredients
3.13.2.2 Increasing Utilization of Palm Oil in Food Applications
3.13.3 Market Restraint Analysis
3.13.3.1 Environmental and Sustainability Concerns
3.13.3.2 Availability of Alternatives
3.13.4 Industry Challenges
3.14 Palm Oil Industry Analysis - PORTER’s
3.15 Macroeconomic Analysis
Chapter 4 Palm Oil Market: Nature Estimates & Trend Analysis
4.1 Nature movement analysis & market share, 2023 & 2030 (USD Million)
4.2 Palm Oil market estimates & forecast, by nature, 2018 - 2030 (Kilotons) (USD Million)
4.2.1 Organic
4.3 Organic palm oil market estimates & forecast, 2018 - 2030 (Kilotons) (USD Million)
4.3.1 Conventional
4.4 Conventional palm oil market estimates & forecast, 2018 - 2030 (Kilotons) (USD Million)
Chapter 5 Palm Oil Market: Product Estimates & Trend Analysis
5.1 Product movement analysis & market share, 2023 & 2030 (USD Million)
5.1.1 Palm Oil market estimates & forecast, by product, 2018 - 2030 (Kilotons) (USD Million)
5.2 Crude Palm Oil
5.2.1 Crude palm Oil market estimates & forecast, 2018 - 2030 (Kilotons) (USD Million)
5.3 RBD Palm Oil
5.3.1 RBD palm Oil market estimates & forecast, 2018 - 2030 (Kilotons) (USD Million)
5.4 Palm kernel oil
5.4.1 Palm kernel Oil market estimates & forecast, 2018 - 2030 (Kilotons) (USD Million)
5.5 Fractionated Palm Oil
5.5.1 Fractionated palm Oil market estimates & forecast, 2018 - 2030 (Kilotons) (USD Million)
Chapter 6 Palm Oil Market: End-use Estimates & Trend Analysis
6.1 End-use movement analysis & market share, 2023 & 2030 (USD Million)
6.1.1 Palm Oil market size & forecasts and trend analysis, by end-use, 2018 - 2030 (Kilotons) (USD Million)
6.2 Food & Beverages
6.2.1 Palm Oil market size & forecasts and trend analysis, in food & beverages, 2018 - 2030 (Kilotons) (USD Million)
6.3 Personal Care & Cosmetics
6.3.1 Palm Oil market size & forecasts and trend analysis, in personal care & cosmetics, 2018 - 2030 (Kilotons) (USD Million)
6.4 Biofuel & Energy
6.4.1 Palm Oil market size & forecasts and trend analysis, in biofuel & energy, 2018 - 2030 (Kilotons) (USD Million)
6.5 Pharmaceuticals
6.5.1 Palm Oil market size & forecasts and trend analysis, in pharmaceuticals, 2018 - 2030 (Kilotons) (USD Million)
6.6 Others
6.6.1 Palm Oil market size & forecasts and trend analysis, in others, 2018 - 2030 (Kilotons) (USD Million)
Chapter 7 Palm Oil Market: Regional Estimates & Trend Analysis
7.1 Regional movement analysis & market share, 2023 & 2030 (USD Million)
7.2 Palm Oil market estimates & forecast, by region, 2018 - 2030 (Kilotons) (USD Million)
7.2.1 North America
7.2.1.1 North America Palm Oil market estimates & forecast, by nature, 2018 - 2030 (Kilotons) (USD Million)
7.2.1.2 North America Palm Oil market estimates & forecast, by product, 2018 - 2030 (Kilotons) (USD Million)
7.2.1.3 North America Palm Oil market estimates & forecast, by end-use, 2018 - 2030 (Kilotons) (USD Million)
7.2.1.4 U.S.
7.2.1.4.1 U.S. Palm Oil market estimates & forecast, by nature, 2018 - 2030 (Kilotons) (USD Million)
7.2.1.4.2 U.S. Palm Oil market estimates & forecast, by product, 2018 - 2030 (Kilotons) (USD Million)
7.2.1.4.3 U.S. Palm Oil market estimates & forecast, by end-use, 2018 - 2030 (Kilotons) (USD Million)
7.2.1.5 Canada
7.2.1.5.1 Canada Palm Oil market estimates & forecast, by nature, 2018 - 2030 (Kilotons) (USD Million)
7.2.1.5.2 Canada Palm Oil market estimates & forecast, by product, 2018 - 2030 (Kilotons) (USD Million)
7.2.1.5.3 Canada Palm Oil market estimates & forecast, by end-use, 2018 - 2030 (Kilotons) (USD Million)
7.2.1.6 Mexico
7.2.1.6.1 Mexico Palm Oil market estimates & forecast, by nature, 2018 - 2030 (Kilotons) (USD Million)
7.2.1.6.2 Mexico Palm Oil market estimates & forecast, by product, 2018 - 2030 (Kilotons) (USD Million)
7.2.1.6.3 Mexico Palm Oil market estimates & forecast, by end-use, 2018 - 2030 (Kilotons) (USD Million)
7.2.2 Europe
7.2.2.1 Europe Palm Oil market estimates & forecast, by nature, 2018 - 2030 (Kilotons) (USD Million)
7.2.2.2 Europe Palm Oil market estimates & forecast, by product, 2018 - 2030 (Kilotons) (USD Million)
7.2.2.3 Europe Palm Oil market estimates & forecast, by end-use, 2018 - 2030 (Kilotons) (USD Million)
7.2.2.4 UK
7.2.2.4.1 UK Palm Oil market estimates & forecast, by nature, 2018 - 2030 (Kilotons) (USD Million)
7.2.2.4.2 UK Palm Oil market estimates & forecast, by product, 2018 - 2030 (Kilotons) (USD Million)
7.2.2.4.3 UK Palm Oil market estimates & forecast, by end-use, 2018 - 2030 (Kilotons) (USD Million)
7.2.2.5 Germany
7.2.2.5.1 Germany Palm Oil market estimates & forecast, by nature, 2018 - 2030 (Kilotons) (USD Million)
7.2.2.5.2 Germany Palm Oil market estimates & forecast, by product, 2018 - 2030 (Kilotons) (USD Million)
7.2.2.5.3 Germany Palm Oil market estimates & forecast, by end-use, 2018 - 2030 (Kilotons) (USD Million)
7.2.2.6 France
7.2.2.6.1 France Palm Oil market estimates & forecast, by nature, 2018 - 2030 (Kilotons) (USD Million)
7.2.2.6.2 France Palm Oil market estimates & forecast, by product, 2018 - 2030 (Kilotons) (USD Million)
7.2.2.6.3 France Palm Oil market estimates & forecast, by end-use, 2018 - 2030 (Kilotons) (USD Million)
7.2.2.7 Spain
7.2.2.7.1 Spain Palm Oil market estimates & forecast, by nature, 2018 - 2030 (Kilotons) (USD Million)
7.2.2.7.2 Spain Palm Oil market estimates & forecast, by product, 2018 - 2030 (Kilotons) (USD Million)
7.2.2.7.3 Spain Palm Oil market estimates & forecast, by end-use, 2018 - 2030 (Kilotons) (USD Million)
7.2.2.8 Italy
7.2.2.8.1 Italy Palm Oil market estimates & forecast, by nature, 2018 - 2030 (Kilotons) (USD Million)
7.2.2.8.2 Italy Palm Oil market estimates & forecast, by product, 2018 - 2030 (Kilotons) (USD Million)
7.2.2.8.3 Italy Palm Oil market estimates & forecast, by end-use, 2018 - 2030 (Kilotons) (USD Million)
7.2.2.9 Russia
7.2.2.9.1 Russia Palm Oil market estimates & forecast, by nature, 2018 - 2030 (Kilotons) (USD Million)
7.2.2.9.2 Russia Palm Oil market estimates & forecast, by product, 2018 - 2030 (Kilotons) (USD Million)
7.2.2.9.3 Russia Palm Oil market estimates & forecast, by end-use, 2018 - 2030 (Kilotons) (USD Million)
7.2.3 Asia Pacific
7.2.3.1 Asia Pacific Palm Oil market estimates & forecast, by nature, 2018 - 2030 (Kilotons) (USD Million)
7.2.3.2 Asia Pacific Palm Oil market estimates & forecast, by product, 2018 - 2030 (Kilotons) (USD Million)
7.2.3.3 Asia Pacific Palm Oil market estimates & forecast, by end-use, 2018 - 2030 (Kilotons) (USD Million)
7.2.3.4 China
7.2.3.4.1 China Palm Oil market estimates & forecast, by nature, 2018 - 2030 (Kilotons) (USD Million)
7.2.3.4.2 China Palm Oil market estimates & forecast, by product, 2018 - 2030 (Kilotons) (USD Million)
7.2.3.4.3 China Palm Oil market estimates & forecast, by end-use, 2018 - 2030 (Kilotons) (USD Million)
7.2.3.5 India
7.2.3.5.1 India Palm Oil market estimates & forecast, by nature, 2018 - 2030 (Kilotons) (USD Million)
7.2.3.5.2 India Palm Oil market estimates & forecast, by product, 2018 - 2030 (Kilotons) (USD Million)
7.2.3.5.3 India Palm Oil market estimates & forecast, by end-use, 2018 - 2030 (Kilotons) (USD Million)
7.2.3.6 Japan
7.2.3.6.1 Japan Palm Oil market estimates & forecast, by nature, 2018 - 2030 (Kilotons) (USD Million)
7.2.3.6.2 Japan Palm Oil market estimates & forecast, by product, 2018 - 2030 (Kilotons) (USD Million)
7.2.3.6.3 Japan Palm Oil market estimates & forecast, by end-use, 2018 - 2030 (Kilotons) (USD Million)
7.2.3.7 South Korea
7.2.3.7.1 South Korea Palm Oil market estimates & forecast, by nature, 2018 - 2030 (Kilotons) (USD Million)
7.2.3.7.2 South Korea Palm Oil market estimates & forecast, by product, 2018 - 2030 (Kilotons) (USD Million)
7.2.3.7.3 South Korea Palm Oil market estimates & forecast, by end-use, 2018 - 2030 (Kilotons) (USD Million)
7.2.3.8 Malaysia
7.2.3.8.1 Malaysia Palm Oil market estimates & forecast, by nature, 2018 - 2030 (Kilotons) (USD Million)
7.2.3.8.2 Malaysia Palm Oil market estimates & forecast, by product, 2018 - 2030 (Kilotons) (USD Million)
7.2.3.8.3 Malaysia Palm Oil market estimates & forecast, by end-use, 2018 - 2030 (Kilotons) (USD Million)
7.2.3.9 Indonesia
7.2.3.9.1 Indonesia Palm Oil market estimates & forecast, by nature, 2018 - 2030 (Kilotons) (USD Million)
7.2.3.9.2 Indonesia Palm Oil market estimates & forecast, by product, 2018 - 2030 (Kilotons) (USD Million)
7.2.3.9.3 Indonesia Palm Oil market estimates & forecast, by end-use, 2018 - 2030 (Kilotons) (USD Million)
7.2.4 Central & South America
7.2.4.1 Central & South America Palm Oil market estimates & forecast, by nature, 2018 - 2030 (Kilotons) (USD Million)
7.2.4.2 Central & South America Palm Oil market estimates & forecast, by product, 2018 - 2030 (Kilotons) (USD Million)
7.2.4.3 Central & South America Palm Oil market estimates & forecast, by end-use, 2018 - 2030 (Kilotons) (USD Million)
7.2.4.4 Brazil
7.2.4.4.1 Brazil Palm Oil market estimates & forecast, by nature, 2018 - 2030 (Kilotons) (USD Million)
7.2.4.4.2 Brazil Palm Oil market estimates & forecast, by product, 2018 - 2030 (Kilotons) (USD Million)
7.2.4.4.3 Brazil Palm Oil market estimates & forecast, by end-use, 2018 - 2030 (Kilotons) (USD Million)
7.2.4.5 Argentina
7.2.4.5.1 Argentina Palm Oil market estimates & forecast, by nature, 2018 - 2030 (Kilotons) (USD Million)
7.2.4.5.2 Argentina Palm Oil market estimates & forecast, by product, 2018 - 2030 (Kilotons) (USD Million)
7.2.4.5.3 Argentina Palm Oil market estimates & forecast, by end-use, 2018 - 2030 (Kilotons) (USD Million)
7.2.4.6 Colombia
7.2.4.6.1 Colombia Palm Oil market estimates & forecast, by nature, 2018 - 2030 (Kilotons) (USD Million)
7.2.4.6.2 Colombia Palm Oil market estimates & forecast, by product, 2018 - 2030 (Kilotons) (USD Million)
7.2.4.6.3 Colombia Palm Oil market estimates & forecast, by end-use, 2018 - 2030 (Kilotons) (USD Million)
7.2.5 Middle East & Africa
7.2.5.1 Middle East & Africa Palm Oil market estimates & forecast, by nature, 2018 - 2030 (Kilotons) (USD Million)
7.2.5.2 Middle East & Africa Palm Oil market estimates & forecast, by product, 2018 - 2030 (Kilotons) (USD Million)
7.2.5.3 Middle East & Africa Palm Oil market estimates & forecast, by end-use, 2018 - 2030 (Kilotons) (USD Million)
7.2.5.4 Saudi Arabia
7.2.5.4.1 Saudi Arabia Palm Oil market estimates & forecast, by nature, 2018 - 2030 (Kilotons) (USD Million)
7.2.5.4.2 Saudi Arabia Palm Oil market estimates & forecast, by product, 2018 - 2030 (Kilotons) (USD Million)
7.2.5.4.3 Saudi Arabia Palm Oil market estimates & forecast, by end-use, 2018 - 2030 (Kilotons) (USD Million)
7.2.5.5 South Africa
7.2.5.5.1 South Africa Palm Oil market estimates & forecast, by nature, 2018 - 2030 (Kilotons) (USD Million)
7.2.5.5.2 South Africa Palm Oil market estimates & forecast, by product, 2018 - 2030 (Kilotons) (USD Million)
7.2.5.5.3 South Africa Palm Oil market estimates & forecast, by end-use, 2018 - 2030 (Kilotons) (USD Million)
7.2.5.6 Turkey
7.2.5.6.1 Turkey Palm Oil market estimates & forecast, by nature, 2018 - 2030 (Kilotons) (USD Million)
7.2.5.6.2 Turkey Palm Oil market estimates & forecast, by product, 2018 - 2030 (Kilotons) (USD Million)
7.2.5.6.3 Turkey Palm Oil market estimates & forecast, by end-use, 2018 - 2030 (Kilotons) (USD Million)
7.2.5.7 UAE
7.2.5.7.1 UAE Palm Oil market estimates & forecast, by nature, 2018 - 2030 (Kilotons) (USD Million)
7.2.5.7.2 UAE Palm Oil market estimates & forecast, by product, 2018 - 2030 (Kilotons) (USD Million)
7.2.5.7.3 UAE Palm Oil market estimates & forecast, by end-use, 2018 - 2030 (Kilotons) (USD Million)
7.2.5.8 Oman
7.2.5.8.1 Oman Palm Oil market estimates & forecast, by nature, 2018 - 2030 (Kilotons) (USD Million)
7.2.5.8.2 Oman Palm Oil market estimates & forecast, by product, 2018 - 2030 (Kilotons) (USD Million)
7.2.5.8.3 Oman Palm Oil market estimates & forecast, by end-use, 2018 - 2030 (Kilotons) (USD Million)
7.2.5.9 Yemen
7.2.5.9.1 Yemen Palm Oil market estimates & forecast, by nature, 2018 - 2030 (Kilotons) (USD Million)
7.2.5.9.2 Yemen Palm Oil market estimates & forecast, by product, 2018 - 2030 (Kilotons) (USD Million)
7.2.5.9.3 Yemen Palm Oil market estimates & forecast, by end-use, 2018 - 2030 (Kilotons) (USD Million)
7.2.5.10 Kenya
7.2.5.10.1Kenya Palm Oil market estimates & forecast, by nature, 2018 - 2030 (Kilotons) (USD Million)
7.2.5.10.2Kenya Palm Oil market estimates & forecast, by product, 2018 - 2030 (Kilotons) (USD Million)
7.2.5.10.3Kenya Palm Oil market estimates & forecast, by end-use, 2018 - 2030 (Kilotons) (USD Million)
7.2.5.11 Nigeria
7.2.5.11.1Nigeria Palm Oil market estimates & forecast, by nature, 2018 - 2030 (Kilotons) (USD Million)
7.2.5.11.2Nigeria Palm Oil market estimates & forecast, by product, 2018 - 2030 (Kilotons) (USD Million)
7.2.5.11.3Nigeria Palm Oil market estimates & forecast, by end-use, 2018 - 2030 (Kilotons) (USD Million)
7.2.5.12 Ghana
7.2.5.12.1Ghana Palm Oil market estimates & forecast, by nature, 2018 - 2030 (Kilotons) (USD Million)
7.2.5.12.2Ghana Palm Oil market estimates & forecast, by product, 2018 - 2030 (Kilotons) (USD Million)
7.2.5.12.3Ghana Palm Oil market estimates & forecast, by end-use, 2018 - 2030 (Kilotons) (USD Million)
7.2.5.13 Egypt
7.2.5.13.1Egypt Palm Oil market estimates & forecast, by nature, 2018 - 2030 (Kilotons) (USD Million)
7.2.5.13.2Egypt Palm Oil market estimates & forecast, by product, 2018 - 2030 (Kilotons) (USD Million)
7.2.5.13.3Egypt Palm Oil market estimates & forecast, by end-use, 2018 - 2030 (Kilotons) (USD Million)
Chapter 8 Competitive Landscape
8.1 Vendor Landscape
8.2 Competitive Environment
8.3 Company Market Positioning
8.4 Strategy Framework
8.5 Company Listing
8.6 ADM
8.6.1 Company Overview
8.6.2 Financial performance
8.6.3 Product Benchmarking
8.6.4 Strategic Initiatives
8.7 Wilmar International Ltd
8.7.1 Company Overview
8.7.2 Financial performance
8.7.3 Product Benchmarking
8.7.4 Strategic Initiatives
8.8 Sime Darby Plantation Berhad
8.8.1 Company Overview
8.8.2 Financial performance
8.8.3 Product Benchmarking
8.8.4 Strategic Initiatives
8.9 IOI Corporation Berhad
8.9.1 Company Overview
8.9.2 Financial performance
8.9.3 Product Benchmarking
8.9.4 Strategic Initiatives
8.10 Kuala Lumpur Kepong Berhad
8.10.1 Company Overview
8.10.2 Financial performance
8.10.3 Product Benchmarking
8.10.4 Strategic Initiatives
8.11 United Plantations Berhad
8.11.1 Company Overview
8.11.2 Financial performance
8.11.3 Product Benchmarking
8.11.4 Strategic Initiatives
8.12 Kulim (Malaysia) Berhad
8.12.1 Company Overview
8.12.2 Financial performance
8.12.3 Product Benchmarking
8.12.4 Strategic Initiatives
8.13 IJM Corporation Berhad
8.13.1 Company Overview
8.13.2 Financial performance
8.13.3 Product Benchmarking
8.14 PT Sampoerna Agro, Tbk
8.14.1 Company Overview
8.14.2 Financial performance
8.14.3 Product Benchmarking
8.15 Univanich Palm Oil Public Company Ltd.
8.15.1 Company Overview
8.15.2 Financial performance
8.15.3 Product Benchmarking
8.16 PT. Bakrie Sumatera Plantations tbk
8.16.1 Company Overview
8.16.2 Financial performance
8.16.3 Product Benchmarking
8.17 Asian Agri
8.17.1 Company Overview
8.17.2 Product Benchmarking
8.17.3 Strategic Initiatives
List of Tables
Table 1 Palm oil cost structure variables, by country
Table 2 Palm oil export volumes by country 2018 - 2022 in tons
Table 3 Palm oil export values by country 2018 - 2022 in USD Thousand
Table 4 Palm oil import volumes by country 2018 - 2022 in Tons
Table 5 Palm oil import values by country 2018 - 2022 in USD Thousand
Table 6 Macroeconomic stats of a few Latin America countries
Table 7 Average price of common vegetable oils 2019-2022 in USD/MT
Table 8 List of Food Brands with Palm Oil
Table 9 Palm Oil - Regulatory Framework
Table 10 Palm Oil market volume estimates & forecasts, by nature, 2018 - 2030 (Kilotons)
Table 11 Palm Oil market revenue estimates & forecasts, by nature, 2018 - 2030 (USD Million)
Table 12 Organic palm oil market estimates & forecast, 2018-2030 (Kilotons) (USD Million)
Table 13 Conventional palm oil market estimates & forecast, 2018-2030 (Kilotons) (USD Million)
Table 14 Palm Oil market volume estimates & forecasts, by product, 2018 - 2030 (Kilotons)
Table 15 Palm Oil market revenue estimates & forecasts, by product, 2018 - 2030 (USD Million)
Table 16 CPO market estimates & forecast, 2018-2030 (Kilotons) (USD Million)
Table 17 RBD palm oil market estimates & forecast, 2018-2030 (Kilotons) (USD Million)
Table 18 Palm kernel oil market estimates & forecast, 2018-2030 (Kilotons) (USD Million)
Table 19 Fractionated palm oil market estimates & forecast, 2018-2030 (Kilotons) (USD Million)
Table 20 Palm Oil market volume estimates & forecasts, by end-use, 2018 - 2030 (Kilotons)
Table 21 Palm Oil market revenue estimates & forecasts, by end-use, 2018 - 2030 (USD Million)
Table 22 Palm oil market estimates & forecast, in food & beverages, 2018-2030 (Kilotons) (USD Million)
Table 23 Palm oil market estimates & forecast, in personal care & cosmetics, 2018-2030 (Kilotons) (USD Million)
Table 24 Palm oil market estimates & forecast, in biofuel & energy, 2018-2030 (Kilotons) (USD Million)
Table 25 Palm oil market estimates & forecast, in pharmaceuticals, 2018-2030 (Kilotons) (USD Million)
Table 26 Palm oil market estimates & forecast, in others, 2018-2030 (Kilotons) (USD Million)
Table 27 Palm Oil market volume estimates & forecasts, by region, 2016 - 2027, (Kilotons)
Table 28 Palm Oil market revenue estimates & forecasts, by region, 2018 - 2030 (USD Million)
Table 29 North America Palm Oil market volume estimates & forecasts, by nature, 2018 - 2030 (Kilotons)
Table 30 North America Palm Oil market revenue estimates & forecasts, by nature, 2018 - 2030 (USD Million)
Table 31 North America Palm Oil market volume estimates & forecasts, by product, 2018 - 2030 (Kilotons)
Table 32 North America Palm Oil market revenue estimates & forecasts, by product, 2018 - 2030 (USD Million)
Table 33 North America Palm Oil market volume estimates & forecasts, by end-use, 2018 - 2030 (Kilotons)
Table 34 North America Palm Oil market revenue estimates & forecasts, by end-use, 2018 - 2030 (USD Million)
Table 35 U.S. Palm Oil market volume estimates & forecasts, by nature, 2018 - 2030 (Kilotons)
Table 36 U.S. Palm Oil market revenue estimates & forecasts, by nature, 2018 - 2030 (USD Million)
Table 37 U.S. Palm Oil market volume estimates & forecasts, by product, 2018 - 2030 (Kilotons)
Table 38 U.S. Palm Oil market revenue estimates & forecasts, by product, 2018 - 2030 (USD Million)
Table 39 U.S. Palm Oil market volume estimates & forecasts, by end-use, 2018 - 2030 (Kilotons)
Table 40 U.S. Palm Oil market revenue estimates & forecasts, by end-use, 2018 - 2030 (USD Million)
Table 41 Canada Palm Oil market volume estimates & forecasts, by nature, 2018 - 2030 (Kilotons)
Table 42 Canada Palm Oil market revenue estimates & forecasts, by nature, 2018 - 2030 (USD Million)
Table 43 Canada Palm Oil market volume estimates & forecasts, by product, 2018 - 2030 (Kilotons)
Table 44 Canada Palm Oil market revenue estimates & forecasts, by product, 2018 - 2030 (USD Million)
Table 45 Canada Palm Oil market volume estimates & forecasts, by end-use, 2018 - 2030 (Kilotons)
Table 46 Canada Palm Oil market revenue estimates & forecasts, by end-use, 2018 - 2030 (USD Million)
Table 47 Mexico Palm Oil market volume estimates & forecasts, by nature, 2018 - 2030 (Kilotons)
Table 48 Mexico Palm Oil market revenue estimates & forecasts, by nature, 2018 - 2030 (USD Million)
Table 49 Mexico Palm Oil market volume estimates & forecasts, by product, 2018 - 2030 (Kilotons)
Table 50 Mexico Palm Oil market revenue estimates & forecasts, by product, 2018 - 2030 (USD Million)
Table 51 Mexico Palm Oil market volume estimates & forecasts, by end-use, 2018 - 2030 (Kilotons)
Table 52 Mexico Palm Oil market revenue estimates & forecasts, by end-use, 2018 - 2030 (USD Million)
Table 53 Europe Palm Oil market volume estimates & forecasts, by nature, 2018 - 2030 (Kilotons)
Table 54 Europe Palm Oil market revenue estimates & forecasts, by nature, 2018 - 2030 (USD Million)
Table 55 Europe Palm Oil market volume estimates & forecasts, by product, 2018 - 2030 (Kilotons)
Table 56 Europe Palm Oil market revenue estimates & forecasts, by product, 2018 - 2030 (USD Million)
Table 57 Europe Palm Oil market volume estimates & forecasts, by end-use, 2018 - 2030 (Kilotons)
Table 58 Europe Palm Oil market revenue estimates & forecasts, by end-use, 2018 - 2030 (USD Million)
Table 59 UK Palm Oil market volume estimates & forecasts, by nature, 2018 - 2030 (Kilotons)
Table 60 UK Palm Oil market revenue estimates & forecasts, by nature, 2018 - 2030 (USD Million)
Table 61 UK Palm Oil market volume estimates & forecasts, by product, 2018 - 2030 (Kilotons)
Table 62 UK Palm Oil market revenue estimates & forecasts, by product, 2018 - 2030 (USD Million)
Table 63 UK Palm Oil market volume estimates & forecasts, by end-use, 2018 - 2030 (Kilotons)
Table 64 UK Palm Oil market revenue estimates & forecasts, by end-use, 2018 - 2030 (USD Million)
Table 65 Germany Palm Oil market volume estimates & forecasts, by nature, 2018 - 2030 (Kilotons)
Table 66 Germany Palm Oil market revenue estimates & forecasts, by nature, 2018 - 2030 (USD Million)
Table 67 Germany Palm Oil market volume estimates & forecasts, by product, 2018 - 2030 (Kilotons)
Table 68 Germany Palm Oil market revenue estimates & forecasts, by product, 2018 - 2030 (USD Million)
Table 69 Germany Palm Oil market volume estimates & forecasts, by end-use, 2018 - 2030 (Kilotons)
Table 70 Germany Palm Oil market revenue estimates & forecasts, by end-use, 2018 - 2030 (USD Million)
Table 71 France Palm Oil market volume estimates & forecasts, by nature, 2018 - 2030 (Kilotons)
Table 72 France Palm Oil market revenue estimates & forecasts, by nature, 2018 - 2030 (USD Million)
Table 73 France Palm Oil market volume estimates & forecasts, by product, 2018 - 2030 (Kilotons)
Table 74 France Palm Oil market revenue estimates & forecasts, by product, 2018 - 2030 (USD Million)
Table 75 France Palm Oil market volume estimates & forecasts, by end-use, 2018 - 2030 (Kilotons)
Table 76 France Palm Oil market revenue estimates & forecasts, by end-use, 2018 - 2030 (USD Million)
Table 77 Spain Palm Oil market volume estimates & forecasts, by nature, 2018 - 2030 (Kilotons)
Table 78 Spain Palm Oil market revenue estimates & forecasts, by nature, 2018 - 2030 (USD Million)
Table 79 Spain Palm Oil market volume estimates & forecasts, by product, 2018 - 2030 (Kilotons)
Table 80 Spain Palm Oil market revenue estimates & forecasts, by product, 2018 - 2030 (USD Million)
Table 81 Spain Palm Oil market volume estimates & forecasts, by end-use, 2018 - 2030 (Kilotons)
Table 82 Spain Palm Oil market revenue estimates & forecasts, by end-use, 2018 - 2030 (USD Million)
Table 83 Italy Palm Oil market volume estimates & forecasts, by nature, 2018 - 2030 (Kilotons)
Table 84 Italy Palm Oil market revenue estimates & forecasts, by nature, 2018 - 2030 (USD Million)
Table 85 Italy Palm Oil market volume estimates & forecasts, by product, 2018 - 2030 (Kilotons)
Table 86 Italy Palm Oil market revenue estimates & forecasts, by product, 2018 - 2030 (USD Million)
Table 87 Italy Palm Oil market volume estimates & forecasts, by end-use, 2018 - 2030 (Kilotons)
Table 88 Italy Palm Oil market revenue estimates & forecasts, by end-use, 2018 - 2030 (USD Million)
Table 89 Russia Palm Oil market volume estimates & forecasts, by nature, 2018 - 2030 (Kilotons)
Table 90 Russia Palm Oil market revenue estimates & forecasts, by nature, 2018 - 2030 (USD Million)
Table 91 Russia Palm Oil market volume estimates & forecasts, by product, 2018 - 2030 (Kilotons)
Table 92 Russia Palm Oil market revenue estimates & forecasts, by product, 2018 - 2030 (USD Million)
Table 93 Russia Palm Oil market volume estimates & forecasts, by end-use, 2018 - 2030 (Kilotons)
Table 94 Russia Palm Oil market revenue estimates & forecasts, by end-use, 2018 - 2030 (USD Million)
Table 95 Asia Pacific Palm Oil market volume estimates & forecasts, by nature, 2018 - 2030 (Kilotons)
Table 96 Asia Pacific Palm Oil market revenue estimates & forecasts, by nature, 2018 - 2030 (USD Million)
Table 97 Asia Pacific Palm Oil market volume estimates & forecasts, by product, 2018 - 2030 (Kilotons)
Table 98 Asia Pacific Palm Oil market revenue estimates & forecasts, by product, 2018 - 2030 (USD Million)
Table 99 Asia Pacific Palm Oil market volume estimates & forecasts, by end-use, 2018 - 2030 (Kilotons)
Table 100 Asia Pacific Palm Oil market revenue estimates & forecasts, by end-use, 2018 - 2030 (USD Million)
Table 101 China Palm Oil market volume estimates & forecasts, by nature, 2018 - 2030 (Kilotons)
Table 102 China Palm Oil market revenue estimates & forecasts, by nature, 2018 - 2030 (USD Million)
Table 103 China Palm Oil market volume estimates & forecasts, by product, 2018 - 2030 (Kilotons)
Table 104 China Palm Oil market revenue estimates & forecasts, by product, 2018 - 2030 (USD Million)
Table 105 China Palm Oil market volume estimates & forecasts, by end-use, 2018 - 2030 (Kilotons)
Table 106 China Palm Oil market revenue estimates & forecasts, by end-use, 2018 - 2030 (USD Million)
Table 107 India Palm Oil market volume estimates & forecasts, by nature, 2018 - 2030 (Kilotons)
Table 108 India Palm Oil market revenue estimates & forecasts, by nature, 2018 - 2030 (USD Million)
Table 109 India Palm Oil market volume estimates & forecasts, by product, 2018 - 2030 (Kilotons)
Table 110 India Palm Oil market revenue estimates & forecasts, by product, 2018 - 2030 (USD Million)
Table 111 India Palm Oil market volume estimates & forecasts, by end-use, 2018 - 2030 (Kilotons)
Table 112 India Palm Oil market revenue estimates & forecasts, by end-use, 2018 - 2030 (USD Million)
Table 113 Japan Palm Oil market volume estimates & forecasts, by nature, 2018 - 2030 (Kilotons)
Table 114 Japan Palm Oil market revenue estimates & forecasts, by nature, 2018 - 2030 (USD Million)
Table 115 Japan Palm Oil market volume estimates & forecasts, by product, 2018 - 2030 (Kilotons)
Table 116 Japan Palm Oil market revenue estimates & forecasts, by product, 2018 - 2030 (USD Million)
Table 117 Japan Palm Oil market volume estimates & forecasts, by end-use, 2018 - 2030 (Kilotons)
Table 118 Japan Palm Oil market revenue estimates & forecasts, by end-use, 2018 - 2030 (USD Million)
Table 119 South Korea Palm Oil market volume estimates & forecasts, by nature, 2018 - 2030 (Kilotons)
Table 120 South Korea Palm Oil market revenue estimates & forecasts, by nature, 2018 - 2030 (USD Million)
Table 121 South Korea Palm Oil market volume estimates & forecasts, by product, 2018 - 2030 (Kilotons)
Table 122 South Korea Palm Oil market revenue estimates & forecasts, by product, 2018 - 2030 (USD Million)
Table 123 South Korea Palm Oil market volume estimates & forecasts, by end-use, 2018 - 2030 (Kilotons)
Table 124 South Korea Palm Oil market revenue estimates & forecasts, by end-use, 2018 - 2030 (USD Million)
Table 125 Malaysia Palm Oil market volume estimates & forecasts, by nature, 2018 - 2030 (Kilotons)
Table 126 Malaysia Palm Oil market revenue estimates & forecasts, by nature, 2018 - 2030 (USD Million)
Table 127 Malaysia Palm Oil market volume estimates & forecasts, by product, 2018 - 2030 (Kilotons)
Table 128 Malaysia Palm Oil market revenue estimates & forecasts, by product, 2018 - 2030 (USD Million)
Table 129 Malaysia Palm Oil market volume estimates & forecasts, by end-use, 2018 - 2030 (Kilotons)
Table 130 Malaysia Palm Oil market revenue estimates & forecasts, by end-use, 2018 - 2030 (USD Million)
Table 131 Indonesia Palm Oil market volume estimates & forecasts, by nature, 2018 - 2030 (Kilotons)
Table 132 Indonesia Palm Oil market revenue estimates & forecasts, by nature, 2018 - 2030 (USD Million)
Table 133 Indonesia Palm Oil market volume estimates & forecasts, by product, 2018 - 2030 (Kilotons)
Table 134 Indonesia Palm Oil market revenue estimates & forecasts, by product, 2018 - 2030 (USD Million)
Table 135 Indonesia Palm Oil market volume estimates & forecasts, by end-use, 2018 - 2030 (Kilotons)
Table 136 Indonesia Palm Oil market revenue estimates & forecasts, by end-use, 2018 - 2030 (USD Million)
Table 137 Central & South America Palm Oil market volume estimates & forecasts, by nature, 2018 - 2030 (Kilotons)
Table 138 Central & South America Palm Oil market revenue estimates & forecasts, by nature, 2018 - 2030 (USD Million)
Table 139 Central & South America Palm Oil market volume estimates & forecasts, by product, 2018 - 2030 (Kilotons)
Table 140 Central & South America Palm Oil market revenue estimates & forecasts, by product, 2018 - 2030 (USD Million)
Table 141 Central & South America Palm Oil market volume estimates & forecasts, by end-use, 2018 - 2030 (Kilotons)
Table 142 Central & South America Palm Oil market revenue estimates & forecasts, by end-use, 2018 - 2030 (USD Million)
Table 143 Brazil Palm Oil market volume estimates & forecasts, by nature, 2018 - 2030 (Kilotons)
Table 144 Brazil Palm Oil market revenue estimates & forecasts, by nature, 2018 - 2030 (USD Million)
Table 145 Brazil Palm Oil market volume estimates & forecasts, by product, 2018 - 2030 (Kilotons)
Table 146 Brazil Palm Oil market revenue estimates & forecasts, by product, 2018 - 2030 (USD Million)
Table 147 Brazil Palm Oil market volume estimates & forecasts, by end-use, 2018 - 2030 (Kilotons)
Table 148 Brazil Palm Oil market revenue estimates & forecasts, by end-use, 2018 - 2030 (USD Million)
Table 149 Argentina Palm Oil market volume estimates & forecasts, by nature, 2018 - 2030 (Kilotons)
Table 150 Argentina Palm Oil market revenue estimates & forecasts, by nature, 2018 - 2030 (USD Million)
Table 151 Argentina Palm Oil market volume estimates & forecasts, by product, 2018 - 2030 (Kilotons)
Table 152 Argentina Palm Oil market revenue estimates & forecasts, by product, 2018 - 2030 (USD Million)
Table 153 Argentina Palm Oil market volume estimates & forecasts, by end-use, 2018 - 2030 (Kilotons)
Table 154 Argentina Palm Oil market revenue estimates & forecasts, by end-use, 2018 - 2030 (USD Million)
Table 155 Colombia Palm Oil market volume estimates & forecasts, by nature, 2018 - 2030 (Kilotons)
Table 156 Colombia Palm Oil market revenue estimates & forecasts, by nature, 2018 - 2030 (USD Million)
Table 157 Colombia Palm Oil market volume estimates & forecasts, by product, 2018 - 2030 (Kilotons)
Table 158 Colombia Palm Oil market revenue estimates & forecasts, by product, 2018 - 2030 (USD Million)
Table 159 Colombia Palm Oil market volume estimates & forecasts, by end-use, 2018 - 2030 (Kilotons)
Table 160 Colombia Palm Oil market revenue estimates & forecasts, by end-use, 2018 - 2030 (USD Million)
Table 161 Middle East & Africa Palm Oil market volume estimates & forecasts, by nature, 2018 - 2030 (Kilotons)
Table 162 Middle East & Africa Palm Oil market revenue estimates & forecasts, by nature, 2018 - 2030 (USD Million)
Table 163 Middle East & Africa Palm Oil market volume estimates & forecasts, by product, 2018 - 2030 (Kilotons)
Table 164 Middle East & Africa Palm Oil market revenue estimates & forecasts, by product, 2018 - 2030 (USD Million)
Table 165 Middle East & Africa Palm Oil market volume estimates & forecasts, by end-use, 2018 - 2030 (Kilotons)
Table 166 Middle East & Africa Palm Oil market revenue estimates & forecasts, by end-use, 2018 - 2030 (USD Million)
Table 167 Saudi Arabia Palm Oil market volume estimates & forecasts, by nature, 2018 - 2030 (Kilotons)
Table 168 Saudi Arabia Palm Oil market revenue estimates & forecasts, by nature, 2018 - 2030 (USD Million)
Table 169 Saudi Arabia Palm Oil market volume estimates & forecasts, by product, 2018 - 2030 (Kilotons)
Table 170 Saudi Arabia Palm Oil market revenue estimates & forecasts, by product, 2018 - 2030 (USD Million)
Table 171 Saudi Arabia Palm Oil market volume estimates & forecasts, by end-use, 2018 - 2030 (Kilotons)
Table 172 Saudi Arabia Palm Oil market revenue estimates & forecasts, by end-use, 2018 - 2030 (USD Million)
Table 173 South Africa Palm Oil market volume estimates & forecasts, by nature, 2018 - 2030 (Kilotons)
Table 174 South Africa Palm Oil market revenue estimates & forecasts, by nature, 2018 - 2030 (USD Million)
Table 175 South Africa Palm Oil market volume estimates & forecasts, by product, 2018 - 2030 (Kilotons)
Table 176 South Africa Palm Oil market revenue estimates & forecasts, by product, 2018 - 2030 (USD Million)
Table 177 South Africa Palm Oil market volume estimates & forecasts, by end-use, 2018 - 2030 (Kilotons)
Table 178 South Africa Palm Oil market revenue estimates & forecasts, by end-use, 2018 - 2030 (USD Million)
Table 179 Turkey Palm Oil market volume estimates & forecasts, by nature, 2018 - 2030 (Kilotons)
Table 180 Turkey Palm Oil market revenue estimates & forecasts, by nature, 2018 - 2030 (USD Million)
Table 181 Turkey Palm Oil market volume estimates & forecasts, by product, 2018 - 2030 (Kilotons)
Table 182 Turkey Palm Oil market revenue estimates & forecasts, by product, 2018 - 2030 (USD Million)
Table 183 Turkey Palm Oil market volume estimates & forecasts, by end-use, 2018 - 2030 (Kilotons)
Table 184 Turkey Palm Oil market revenue estimates & forecasts, by end-use, 2018 - 2030 (USD Million)
Table 185 UAE Palm Oil market volume estimates & forecasts, by nature, 2018 - 2030 (Kilotons)
Table 186 UAE Palm Oil market revenue estimates & forecasts, by nature, 2018 - 2030 (USD Million)
Table 187 UAE Palm Oil market volume estimates & forecasts, by product, 2018 - 2030 (Kilotons)
Table 188 UAE Palm Oil market revenue estimates & forecasts, by product, 2018 - 2030 (USD Million)
Table 189 UAE Palm Oil market volume estimates & forecasts, by end-use, 2018 - 2030 (Kilotons)
Table 190 UAE Palm Oil market revenue estimates & forecasts, by end-use, 2018 - 2030 (USD Million)
Table 191 Oman Palm Oil market volume estimates & forecasts, by nature, 2018 - 2030 (Kilotons)
Table 192 Oman Palm Oil market revenue estimates & forecasts, by nature, 2018 - 2030 (USD Million)
Table 193 Oman Palm Oil market volume estimates & forecasts, by product, 2018 - 2030 (Kilotons)
Table 194 Oman Palm Oil market revenue estimates & forecasts, by product, 2018 - 2030 (USD Million)
Table 195 Oman Palm Oil market volume estimates & forecasts, by end-use, 2018 - 2030 (Kilotons)
Table 196 Oman Palm Oil market revenue estimates & forecasts, by end-use, 2018 - 2030 (USD Million)
Table 197 Yemen Palm Oil market volume estimates & forecasts, by nature, 2018 - 2030 (Kilotons)
Table 198 Yemen Palm Oil market revenue estimates & forecasts, by nature, 2018 - 2030 (USD Million)
Table 199 Yemen Palm Oil market volume estimates & forecasts, by product, 2018 - 2030 (Kilotons)
Table 200 Yemen Palm Oil market revenue estimates & forecasts, by product, 2018 - 2030 (USD Million)
Table 201 Yemen Palm Oil market volume estimates & forecasts, by end-use, 2018 - 2030 (Kilotons)
Table 202 Yemen Palm Oil market revenue estimates & forecasts, by end-use, 2018 - 2030 (USD Million)
Table 203 Kenya Palm Oil market volume estimates & forecasts, by nature, 2018 - 2030 (Kilotons)
Table 204 Kenya Palm Oil market revenue estimates & forecasts, by nature, 2018 - 2030 (USD Million)
Table 205 Kenya Palm Oil market volume estimates & forecasts, by product, 2018 - 2030 (Kilotons)
Table 206 Kenya Palm Oil market revenue estimates & forecasts, by product, 2018 - 2030 (USD Million)
Table 207 Kenya Palm Oil market volume estimates & forecasts, by end-use, 2018 - 2030 (Kilotons)
Table 208 Kenya Palm Oil market revenue estimates & forecasts, by end-use, 2018 - 2030 (USD Million)
Table 209 Nigeria Palm Oil market volume estimates & forecasts, by nature, 2018 - 2030 (Kilotons)
Table 210 Nigeria Palm Oil market revenue estimates & forecasts, by nature, 2018 - 2030 (USD Million)
Table 211 Nigeria Palm Oil market volume estimates & forecasts, by product, 2018 - 2030 (Kilotons)
Table 212 Nigeria Palm Oil market revenue estimates & forecasts, by product, 2018 - 2030 (USD Million)
Table 213 Nigeria Palm Oil market volume estimates & forecasts, by end-use, 2018 - 2030 (Kilotons)
Table 214 Nigeria Palm Oil market revenue estimates & forecasts, by end-use, 2018 - 2030 (USD Million)
Table 215 Ghana Palm Oil market volume estimates & forecasts, by nature, 2018 - 2030 (Kilotons)
Table 216 Ghana Palm Oil market revenue estimates & forecasts, by nature, 2018 - 2030 (USD Million)
Table 217 Ghana Palm Oil market volume estimates & forecasts, by product, 2018 - 2030 (Kilotons)
Table 218 Ghana Palm Oil market revenue estimates & forecasts, by product, 2018 - 2030 (USD Million)
Table 219 Ghana Palm Oil market volume estimates & forecasts, by end-use, 2018 - 2030 (Kilotons)
Table 220 Ghana Palm Oil market revenue estimates & forecasts, by end-use, 2018 - 2030 (USD Million)
Table 221 Egypt Palm Oil market volume estimates & forecasts, by nature, 2018 - 2030 (Kilotons)
Table 222 Egypt Palm Oil market revenue estimates & forecasts, by nature, 2018 - 2030 (USD Million)
Table 223 Egypt Palm Oil market volume estimates & forecasts, by product, 2018 - 2030 (Kilotons)
Table 224 Egypt Palm Oil market revenue estimates & forecasts, by product, 2018 - 2030 (USD Million)
Table 225 Egypt Palm Oil market volume estimates & forecasts, by end-use, 2018 - 2030 (Kilotons)
Table 226 Egypt Palm Oil market revenue estimates & forecasts, by end-use, 2018 - 2030 (USD Million)
List of Figures
Fig. 1 Palm Oil Market Segmentation & Scope
Fig. 2 Strategy Framework
Fig. 3 Various stages of research workflow
Fig. 4 Information Procurement
Fig. 5 Primary Research Pattern
Fig. 6 Primary research process
Fig. 7 Palm Oil Market Outlook
Fig. 8 Palm Oil market revenue, USD Million, 2023
Fig. 9 Global Yield of Edible Oils, 2022 (MT/HA)
Fig. 10 Palm Oil Market, 2018-2030 (Kilotons) (USD Million)
Fig. 11 Palm Oil Value Chain Analysis
Fig. 12 Global Oilseeds Palm Kernel Production, 2019-2022, (Million MT)
Fig. 13 Global Oilseeds Palm Kernel Crush, 2019-2022 (Million MT)
Fig. 14 Average Price Trend Analysis, 2018 - 2030 (USD/Kiloton)
Fig. 15 Palm Oil Market Dynamics
Fig. 16 Growth of Natural Cosmetics in Europe, 2013-2018, USD Billion
Fig. 17 Edible Oil Product Share, (% wt. Palmitic) 2023
Fig. 18 Palm Oil Industry Analysis - PORTER’s
Fig. 19 Macroeconomic Analysis
Fig. 20 Palm oil market, by nature: Key takeaways
Fig. 21 Palm oil market, by nature: Market share, 2023 & 2030
Fig. 22 Palm oil market, by product: Key takeaways
Fig. 23 Palm oil market, by product: Market share, 2023 & 2030
Fig. 24 Palm oil market, by end-use: Key takeaways
Fig. 25 Palm oil market, by end-use: Market share, 2023 & 2030
Fig. 26 Palm oil market, by region: Key takeaways
Fig. 27 Palm oil market, by region: Market share, 2023 & 2030
Fig. 28 Growth of the global cosmetics market, 2018-2022, (%)
Fig. 29 Global Pharmaceutical R&D Spending, 2018-2022, (USD Billion)
Fig. 30 Malaysian Palm Products Export to Asia Pacific by products, (2022) (%)
Fig. 31 China Palm Oil Imports, 2019-2022 (Thousand MT)
Fig. 32 Malaysia Palm Oil Production, 2019-2022 (Thousand MT)
Fig. 33 Indonesia Palm Oil Production, 2019-2022 (Thousand MT)
Fig. 34 Export destination for Colombian palm oil, (2022) (%)
Market Segmentation
Oils derived from soybean, palm, corn, cottonseed, sunflower, coconut, canola, and olive are considered edible oils. Among these, palm and soybean oils account for a major share in terms of consumption. The choice of edible oil for a particular application and consumption depends on the cost of the oil and the fatty acid profile, which indicates the benefits and features of the oil. The demand for palm oil is anticipated to register growth over the forecast period owing to the growing consumption of palm oil as a raw material for edible oils coupled with its increasing utilization in food applications.
Edible oil is an important component of food products consumed in developed economies of Asia Pacific and Central & South America, especially Brazil, India, and China. These countries are prominent importers of palm oil from Indonesia and Malaysia. Population growth and changing lifestyles have led to increasing demand for palm oil from the food industry. Edible oils are versatile and used as a constituent in various products including mayonnaise, fried foods, shortenings, margarine, biofuels, and pharmaceuticals.
Industrial palm oil plantation needs large clearance areas and usually involve extensive deforestation and expropriation of land. The development of such large plantations is also related to biodiversity loss, land tenure conflicts, and issues concerning local land ownership. These lands have little value in terms of biodiversity or environmental risks. The concerned governments take due diligence before allotting the said land and farmers are mandated to sell their entire production of fresh fruit bunches (FFB) at pre-determined prices.
The palm oil market faces adverse effects owing to limited land availability for expanding palm areas along with fertilizer cost, sustainability concerns, weather variability (short-term and long-term effects of climate change-related), labor availability, and a high amount of saturated fats. Furthermore, greenhouse gas (GHG) emission is a key sustainability issue related to palm oil production. According to the Palm Oil Action Group, palm oil is a key contributor to global warming as the soil releases a high amount of methane, which has a global warming impact of over 23 times as compared to carbon dioxide. However, advanced technologies used in palm oil production are estimated to reduce 80% of GHG emissions.
This section will provide insights into the contents included in this palm oil market report and help gain clarity on the structure of the report to assist readers in navigating smoothly.
Industry overview
Industry trends
Market drivers and restraints
Market size
Growth prospects
Porter’s analysis
PESTEL analysis
Key market opportunities prioritized
Competitive landscape
Company overview
Financial performance
Product benchmarking
Latest strategic developments
Market size, estimates, and forecast from 2018 to 2030
Market estimates and forecast for product segments up to 2030
Regional market size and forecast for product segments up to 2030
Market estimates and forecast for application segments up to 2030
Regional market size and forecast for application segments up to 2030
Company financial performance
A three-pronged approach was followed for deducing the palm oil market estimates and forecasts. The process has three steps: information procurement, analysis, and validation. The whole process is cyclical, and steps repeat until the estimates are validated. The three steps are explained in detail below:
Information procurement: Information procurement is one of the most extensive and important stages in our research process, and quality data is critical for accurate analysis. We followed a multi-channel data collection process for palm oil market to gather the most reliable and current information possible.
Analysis: We mine the data collected to establish baselines for forecasting, identify trends and opportunities, gain insight into consumer demographics and drivers, and so much more. We utilized different methods of palm oil market data depending on the type of information we’re trying to uncover in our research.
Market Research Efforts: Bottom-up Approach for estimating and forecasting demand size and opportunity, top-down Approach for new product forecasting and penetration, and combined approach of both Bottom-up and Top-down for full coverage analysis.
Value-Chain-Based Sizing & Forecasting: Supply-side estimates for understanding potential revenue through competitive benchmarking, forecasting, and penetration modeling.
Demand-side estimates for identifying parent and ancillary markets, segment modeling, and heuristic forecasting.
Qualitative Functional Deployment (QFD) Modelling for market share assessment.
Market formulation and validation: We mine the data collected to establish baselines for forecasting, identify trends and opportunities, gain insight into consumer demographics and drivers, and so much more. We utilize different methods of data analysis depending on the type of information we’re trying to uncover in our research.
Market Formulation: This step involves the finalization of market numbers. This step on an internal level is designed to manage outputs from the Data Analysis step.
Data Normalization: The final market estimates and forecasts are then aligned and sent to industry experts, in-panel quality control managers for validation.
This step also entails the finalization of the report scope and data representation pattern.
Validation: The process entails multiple levels of validation. All these steps run in parallel, and the study is forwarded for publishing only if all three levels render validated results.
The palm oil market was categorized into four segments, namely nature (Organic, Conventional), product (Crude Palm Oil, RBD Palm Oil, Palm Kernel Oil, Fractionated Palm Oil), end-use (Food & Beverage, Personal Care & Cosmetics, Biofuel & Energy, Pharmaceuticals), and region (North America, Europe, Asia Pacific, Central & South America, and Middle East & Africa).
The palm oil market was segmented into nature, product, end-use, and regions. The demand at a segment level was deduced using a funnel method. Concepts like the TAM, SAM, SOM, etc., were put into practice to understand the demand. We at GVR deploy three methods to deduce market estimates and determine forecasts. These methods are explained below:
Demand estimation of each product across countries/regions summed up to from the total market.
Variable analysis for demand forecast.
Demand estimation via analyzing paid database, and company financials either via annual reports or paid database.
Primary interviews for data revalidation and insight collection.
Used extensively for new product forecasting or analyzing penetration levels.
Tool used invoice product flow and penetration models Use of regression multi-variant analysis for forecasting Involves extensive use of paid and public databases.
Primary interviews and vendor-based primary research for variable impact analysis.
The palm oil market was analyzed at a regional level. The globe was divided into North America, Europe, Asia Pacific, Central & South America, and Middle East & Africa, keeping in focus variables like consumption patterns, export-import regulations, consumer expectations, etc. These regions were further divided into twenty-eight countries, namely, the U.S.; Mexico; Canada; Germany; the UK; France; Spain, Italy, Russia, China, India, Japan, South Korea, Malaysia, Indonesia, Brazil, Argentina, Colombia, South Africa, Saudi Arabia, Turkey, UAE, Oman, Yemen, Kenya, Nigeria, Ghana, Egypt.
All three above-mentioned market research methodologies were applied to arrive at regional-level conclusions. The regions were then summed up to form the global market.
The palm oil market was analyzed via companies operating in the sector. Analyzing these companies and cross-referencing them to the demand equation helped us validate our assumptions and conclusions. Key market players analyzed include:
ADM: The Archer Daniels Midland Company (ADM) is engaged in procuring, transporting, storing, processing, and merchandising agricultural commodities. The company operates through four business segments, namely agricultural services, corn processing, oilseed processing, and wild flavors & specialty ingredients.
Wilmar International Ltd: Wilmar International Ltd is a global manufacturer of palm oil and related products with business operations in food products, feed & industrial products, plantations, and fertilizers. Its product offerings include consumer products, specialty fats, and oleochemicals.
Sime Darby Plantation Berhad: Sime Darby Plantation Berhad has integrated business of upstream and oil extraction processes. Its plantations are located across PNG and Solomon Islands, Malaysia, and Indonesia. Besides plantation, the company is involved in the manufacturing and distribution of palm-oil-based biodiesel, oleochemicals, oil & fats, and other consumer products. It operates through its 11 refineries with an annual capacity of 3.8 million MT.
IOI Corporation Berhad: IOI Corporation Berhad is a global palm oil manufacturer with integrated business operations including plantation, manufacturing, and refining of palm oil into specialty fats & oils and oleochemicals. 64%, 24%, and 12% of its oil palm plantations are located in East Malaysia, Peninsular Malaysia, and Indonesia, respectively.
Kuala Lumpur Kepong Berhad: Kuala Lumpur Kepong Berhad (KLK) is a palm oil plantation company with integrated upstream and downstream business operations in resource-based manufacturing of products such as specialty chemicals, oleochemicals, and derivatives. It has international oleochemical business operations in Indonesia, Belgium, the Netherlands, Germany, Switzerland, China, and Malaysia.
United Plantations Berhad.: United Plantations Berhad is a plantation company with key business activities in palm oil cultivation and processing. The company has subsidiaries that are involved in palm oil processing and palm products manufacturing and distribution. It owns six palm oil mills and a subsidiary, namely Unitata refinery that manufactures specialty fats in collaboration with AarhusKarlshamn AB.
IJM Corporation Berhad: IJM Corporation Berhad is a global manufacturer with core business operations in plantation, construction, infrastructure, property, and industry. Principal activities of its plantation business include integrated processes of oil palm cultivation and its processing into crude palm oil, crude palm kernel oil, and expellers. It operates across ten countries with a primary focus on Malaysia, India, and Indonesia.
Kulim (Malaysia) Berhad: Kulim (Malaysia) Berhad is a plantation company with a key focus on palm oil plantation and processing of crude palm oil with upstream integration. Besides palm oil, the company has plantations of rubber, sentang, pineapple, and other fruits. Its core business areas include plantation, intrapreneur ventures, and oil & gas. It is also operational in property, agro-foods, and eco-tourism businesses.
PT Sampoerna Agro, Tbk: PT Sampoerna Agro, Tbk is an agribusiness company with primary operations in palm oil. Palm kernel and crude palm oil are the company’s key products obtained from its plantations and estates at West Kalimantan, Central Kalimantan, and South Sumatera Indonesian provinces. The company is also engaged in oil palm seeds, starch, and rubber business, with its cloned seeds marketed under the names DxP Sriwijaya Semi Klon and DxP Sriwijaya.
Supply Side Estimates
Company revenue estimation via referring to annual reports, investor presentations, and Hoover’s.
Segment revenue determination via variable analysis and penetration modeling.
Competitive benchmarking to identify market leaders and their collective revenue shares.
Forecasting via analyzing commercialization rates, pipelines, market initiatives, distribution networks, etc.
Demand side estimates
Identifying parent markets and ancillary markets
Segment penetration analysis to obtain pertinent
revenue/volume
Heuristic forecasting with the help of subject matter experts
Forecasting via variable analysis
Understanding market dynamics (in terms of drivers, restraints, & opportunities) in the countries.
Understanding trends & variables in the individual countries & their impact on growth and using analytical tools to provide high-level insights into the market dynamics and the associated growth pattern.
Understanding market estimates and forecasts (with the base year as 2023, historic information from 2018 to 2022, and forecast from 2024 to 2030). Regional estimates & forecasts for each category are available and are summed up to form the global market estimates.
The report provides market value for the base year 2023 and a yearly forecast till 2030 in terms of revenue/volume or both. The market for each of the segment outlooks has been provided on region & country basis for the above-mentioned forecast period.
The key industry dynamics, major technological trends, and application markets are evaluated to understand their impact on the demand for the forecast period. The growth rates were estimated using correlation, regression, and time-series analysis.
We have used the bottom-up approach for market sizing, analyzing key regional markets, dynamics, & trends for various products and end-users. The total market has been estimated by integrating the country markets.
All market estimates and forecasts have been validated through primary interviews with the key industry participants.
Inflation has not been accounted for to estimate and forecast the market.
Numbers may not add up due to rounding off.
Europe consists of EU-8, Central & Eastern Europe, along with the Commonwealth of Independent States (CIS).
Asia Pacific includes South Asia, East Asia, Southeast Asia, and Oceania (Australia & New Zealand).
Latin America includes Central American countries and the South American continent
Middle East includes Western Asia (as assigned by the UN Statistics Division) and the African continent.
GVR strives to procure the latest and unique information for reports directly from industry experts, which gives it a competitive edge. Quality is of utmost importance to us, therefore every year we focus on increasing our experts’ panel. Primary interviews are one of the critical steps in identifying recent market trends and scenarios. This process enables us to justify and validate our market estimates and forecasts to our clients. With more than 8,000 reports in our database, we have connected with some key opinion leaders across various domains, including healthcare, technology, consumer goods, and the chemical sector. Our process starts with identifying the right platform for a particular type of report, i.e., emails, LinkedIn, seminars, or telephonic conversation, as every report is unique and requires a differentiated approach.
We send out questionnaires to different experts from various regions/ countries, which is dependent on the following factors:
Report/Market scope: If the market study is global, we send questionnaires to industry experts across various regions, including North America, Europe, Asia Pacific, Latin America, and MEA.
Market Penetration: If the market is driven by technological advancements, population density, disease prevalence, or other factors, we identify experts and send out questionnaires based on region or country dominance.
The time to start receiving responses from industry experts varies based on how niche or well-penetrated the market is. Our reports include a detailed chapter on the KoL opinion section, which helps our clients understand the perspective of experts already in the market space.
"The quality of research they have done for us has been excellent."