GVR Report cover Omega 3 Market Size, Share & Trends Report

Omega 3 Market Size, Share & Trends Analysis Report By Type (EPA, DHA, ALA), By Source (Marine, Plant), By Application (Supplements & Functional Foods), By Region, And Segment Forecasts, 2024 - 2030

  • Report ID: 978-1-68038-079-8
  • Number of Report Pages: 125
  • Format: PDF, Horizon Databook

Omega 3 Market Overview

The global omega 3 market size was valued at USD 2.62 billion in 2023 and is expected to grow at a compound annual growth rate (CAGR) of 7.9% from 2024 to 2030. This is attributable to the rising use of ingredients in the human diet to support brain and heart health. Furthermore, the increasing consumer investment in healthcare and one’s well-being is also expected to boost product demand. The market is witnessing continuous diversification in its product offerings as consumers are looking for alternatives to traditional fish oil. Krill oil is one of the widely used sources of omega-3 due to its superior properties as compared to conventional fish oil. The majority of consumers in Europe and North America prefer krill oil over any other source of fish oil owing to its acid reflux, unpleasant taste, and large-sized pills. Such factors are anticipated to trigger product demand during the forecast period. 
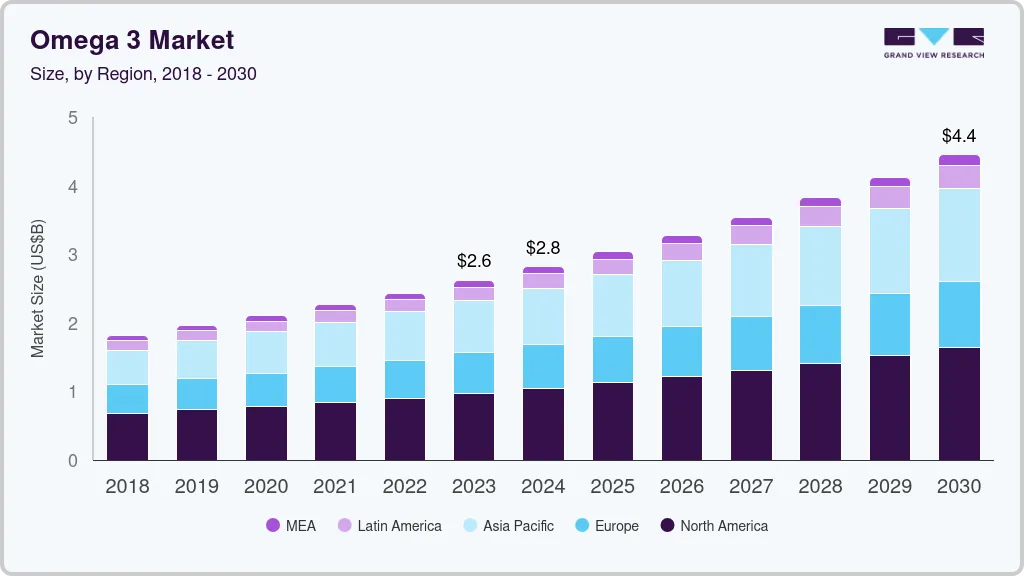
U.S. Omega 3 Market size and growth rate, 2024 - 2030

The demand for omega-3 fatty acids in the U.S. is projected to grow significantly over the next few years owing to rising consumer awareness in the country regarding the several health benefits offered, including lowering blood pressure and cholesterol and reducing risks related to heart diseases. Moreover, growing consumer preference for a healthy and nutritional diet is further expected to fuel product demand shortly.

Numerous manufacturers present in the U.S., including BioProcess Algae, Martek Biosciences Corporation, and Omega Protein Corporation are focusing on research and development activities for launching pharmaceutical-grade product in the market. Increasing consumption of enhanced medicines to treat and prevent chronic diseases is likely to spur overall consumption in the coming years.

Rising pressure on anchovy fisheries to extract fish oil has increased the demand from non-fish sources, including flaxseed, walnuts, algae, and krill oil. Furthermore, increasing government initiatives to promote the product usage in different end-use applications are projected to positively impact the market demand.

Market Concentration & Characteristics

The global market is consolidated with a few large market players accounting for a majority share. For instance, the acquisition of Ocean Nutrition Canada and Martek Biosciences by DSM shaped it as one of the largest suppliers of ingredients, in terms of volume, across the globe.

The market is growing steadily, driven by various factors; one of the key drivers is the increased awareness of the health benefits of omega-3 fatty acids. Omega-3 is known to support heart health, brain function, and overall well-being. As a result, there is a growing demand for infused supplements and fortified foods.
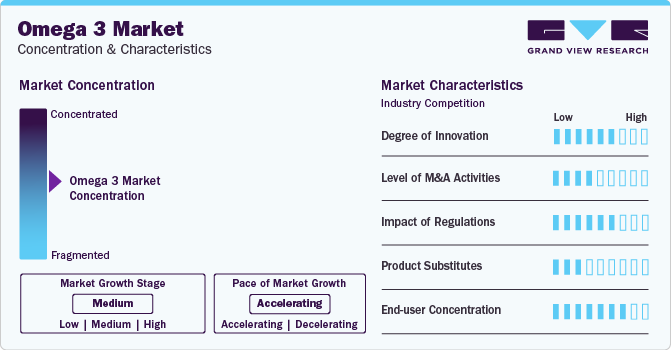
Omega 3 Market Concentration & Characteristics

The market is expanding beyond traditional fish oil sources. With rising pressure on anchovy fisheries and concerns about sustainability, there is a shift towards non-fish sources of omega 3, such as flaxseed, walnuts, algae, and krill oil. Algae-based omega-3 ingredients, in particular, are gaining popularity due to their sustainability and suitability for vegan and vegetarian diets.

Geographically, North America has been a leading region, with the highest revenue share in 2023. This is attributed to the presence of prominent manufacturers of omega-3-based pharmaceutical products and supplements in the region. However, the market is not limited to North America; other regions, such as Europe and Africa, also contribute to the global market share.

Additionally, the rising consumption in the pharmaceuticals industry and the growing research and development activities related to the product are expected to drive the market growth in North America over the forecast period. Moreover, the surging consumption of improved medicines in the region, along with the requirement to increase the life expectancy of the aging population, is expected to propel the demand for omega 3-based pharmaceuticals in North America over the forecast period.

Type Insights

Docosahexaenoic acid (DHA) dominated the market with a revenue share of more than 56% in 2023. This is attributed to the growing utilization of the product in infant formulas to improve an infant's overall health. In the human diet, DHA is the most essential and abundant omega-3 fatty acid, which helps maintain the health of the human body.

DHA is a crucial component for developing and maturing an infant's brain and eyesight. Moreover, it is widely used in nutritional supplements and fortified foods. It is also used in treating dementia, attention deficit hyperactivity disorder, coronary artery disease (CAD), and Type 2 diabetes. The advantages of DHA for health and longevity have also resulted in its use in geriatric nutrition products.

Omega-3 PUFAs, including DPA, have been associated with cardiovascular health benefits. They may help reduce the risk of heart disease by lowering triglyceride levels, reducing inflammation, improving blood vessel function, and reducing the risk of arrhythmias. Additionally, omega-3 PUFAs are crucial for brain health and development. While DHA is the most studied omega-3 PUFA in the brain, there is growing evidence suggesting the unique effects of DPA. DPA has been linked to neuroprotective properties and may have potential benefits in neurodegenerative and neurological disorders.

The demand for Eicosapentaenoic acid (EPA) will increase globally during the forecast period owing to several health benefits, such as avoiding inflammation, high blood pressure, coronary heart diseases, and excessive triglycerides (blood fats). It is also used for treating diabetes, addressing chemotherapy-related side effects, and enabling recovery from surgeries, among others.

Source Insights

The marine source dominated the market with the highest revenue share of 83.5% in 2023. This is attributable to the abundance of DHA and EPA omega-3s in fish bodies or oily, liver oil, or fatty fish, and marine microorganisms, such as marine and algae omega 3 ingredient including krill. High-omega-3 content sources for human consumption include salmon, pollock, tuna, and mackerel.

Other high EPA and DHA content sources include forage fish species with small bodies. This fish category includes anchovies, herring, sardines, mackerel, hoki, and capelin. Thus, marine, in general, is recognized worldwide as a major source of EPA and DHA, thereby leading to rising demand for omega-3 obtained from marine sources.

The plant source segment is expected to register growth over the forecast period, mainly because the global demand for vegetable oils obtained from seeds of soybeans, safflower, sunflower, cotton, and corn is surging as they are rich sources of omega 3. Key players are also shifting to plant sources as an alternative to fish oil due to their environmental benefits. For instance, in May 2023, Nuseed Global introduces Nuseed Nutriterra plant-based oil enriched with omega-3, tailored to meet the needs of the human nutrition and dietary supplement markets. Moverover, Nordic Naturals Algae Omega is a popular product in the market that provides vegans and vegetarians with a safe, sustainable, and reliable plant-based source of omega-3s EPA and DHA in high-quality algae oil. It supports brain, eye, and heart wellness, as well as immune system function.

Application Insights

Supplements & functional foods dominated the market with a revenue share of over 51% in 2023.This is attributable to the exceptional benefits offered by the product such as muscle gain, mineral fortification weight management, and beauty benefits. Growing awareness concerning a reduction in calorie intake amongst athletes and gym professionals in key countries such as India, Italy, China, and the U.S. is likely to promote the use of sports supplements and functional food products.
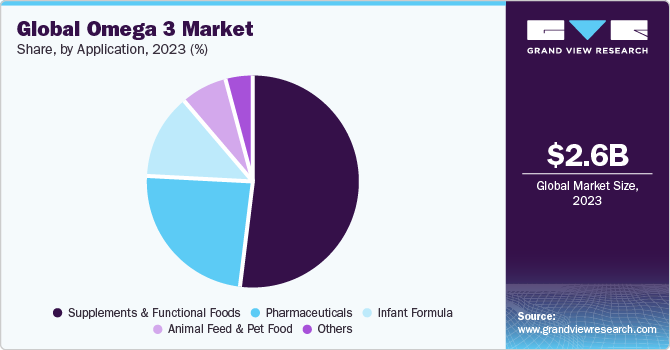
Global Omega 3 Market share and size, 2023

The pharmaceuticals segment is expected to register significant growth over the forecast period on account of its growing usage in the dermatology sector due to its scalp nourishment properties. It is used to preserve the lipid content of the skin, thus preventing moisture loss, and maintaining skin hydration. The rising utilization of omega 3 in pharmaceutical applications to treat the aforementioned skin and scalp conditions is further expected to drive the market over the forecast period.

The growing aging population, increasing lifestyle-related diseases, and rising prevalence of cancer are expected to fuel the demand for omega-3-based pharmaceutical products. In addition, technological advancements in API (active pharmaceutical ingredient) manufacturing are expected to augment the product market growth during the forecast period.

Regional Insights

North America region dominated the market with a revenue share of more than 37.1% in 2023. The demand in this geographical area is additionally stimulated by the existence of prominent pharmaceutical corporations, including Pfizer, Inc., Johnson & Johnson, Amway, and Amarin Pharma, Inc., among other entities.
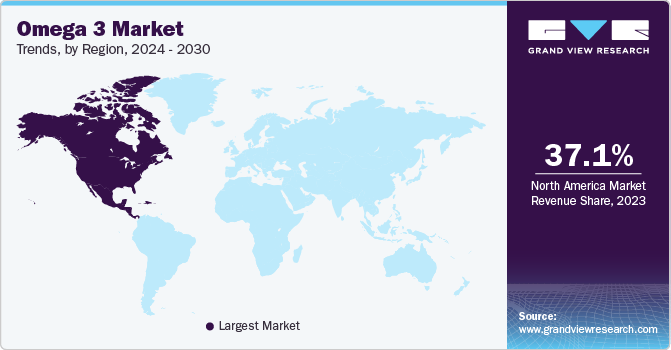
Omega 3 Market Trends, by Region, 2024 - 2030

The rising consumption of omega-3 in the pharmaceuticals industry and the growing research and development activities related to the product are expected to drive the growth of the market in North America over the forecast period. Moreover, the rising consumption of omega 3-rich supplements and functional food products by athletes owing to their ability to improve protein synthesis, increase muscle health, and enhance the physical performance of consumers is anticipated to further drive the market growth over the forecast period.

UK Omega 3 Market

In Europe, the demand for omega 3 is anticipated to witness a significant increase over the forecast period owing to surging product consumption, especially in the form of dietary supplements by the continuously increasing aging population, particularly of developed economies such as Germany, France, the Netherlands, and the UK. Moreover, the demand in the UK is largely driven by the continuous introduction of innovative products in the market. For instance, the launch of MegaRed by Reckitt Benckiser has driven the growth of omega 3-based supplements industry in the country as this product improves the heart, joint, eye, and brain health of consumers.

Asia Pacific is likely to witness growth owing to the rising demand for packaged baby nutrition formulas owing to the increasing participation of women in the workplace is anticipated to propel the demand for infant formulas in countries such as India, China, Japan, Australia, and Thailand. Furthermore, the increasing significance of omega 3 DHA for the development of the infant nervous system, vision, and brain along with the product’s ability to support long-term health is projected to drive market growth in the coming years.

Key Companies & Market Share Insights

Growing consumption of the product in various applications coupled with rising awareness regarding health and chronic diseases, and regulations favoring the use of omega-3 in infant formulations has influenced manufacturers to invest in technologies and product development in order to meet consumer demands. The market has been experiencing an increase in the number of new entrants across the value chain owing to the growing profits and huge market potential of manufacturers.

  • In March 2023, Epax announced an investment of USD 40 million in molecular distillation technology for improving the processing of highly concentrated omega 3.

  • In May 2023, Nuseed Global introduces Nuseed Nutriterra plant-based oil enriched with omega-3, tailored to meet the needs of the human nutrition and dietary supplement markets.

  • In addition, key companies such as Aker Biomarine Antarctic AS are focusing on expanding their capacity by introducing new catching vessels to increase their products, which was reflected in the sales of the company in the year 2021. Governments across developing regions are taking several initiatives to support Antarctic Krill fishing by providing research funds and creating innovation alliances, which may trigger industry growth.

Key Omega 3 Companies:

  • Aker Biomarine Antarctic AS
  • Orkla Health
  • BASF SE
  • Omega Protein Corp.
  • GC Reiber Oils
  • Lonza
  • Croda International Plc
  • EPAX
  • BioProcess Algae, LLC
  • Koninklijke DSM N.V.

Global Omega 3 Market Report Scope

Report Attribute

Details

Market size value in 2024

USD 2.82 billion

Revenue forecast in 2030

USD 4.45 billion

Growth rate

CAGR of 7.9% from 2024 to 2030

Historical data

2018 - 2023

Forecast period

2024 - 2030

Quantitative units

Revenue in USD Million, Volume in Tons and CAGR from 2024 to 2030

Report coverage

Revenue forecast, company ranking, competitive landscape, growth factors, and trends

Segments covered

Type, Source, Application and Region

Regional scope

North America, Europe, Asia Pacific, Central & South America, Middle East & Africa

Country scope

U.S.; Canada; Mexico; Germany; U.K.; France; Spain; Italy; Norway; The Netherlands; China; India; Japan; Australia; New Zealand Brazil; Argentina; UAE, South Africa

Key companies profiled

Aker Biomarine Antarctic AS; Orkla Health; BASF SE; Omega Protein Corp.; GC Reiber Oils; Lonza; Croda International Plc; EPAX; BioProcess Algae; LLC; Koninklijke DSM N.V.

Customization scope

Free report customization (equivalent up to 8 analysts working days) with purchase. Addition or alteration to country, regional & segment scope.

Pricing and purchase options

Avail customized purchase options to meet your exact research needs. Explore purchase options


Global Omega 3 Market Report Segmentation

This report forecasts revenue growth at global, regional, and country levels and provides an analysis on the latest industry trends in each of the sub-segments from 2018 to 2030. For the purpose of this study, Grand View Research has segmented the global omega 3 market report on the basis of type, source, application, and region:
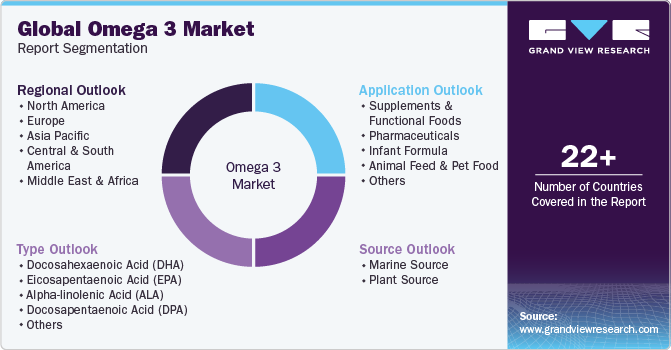
Global Omega 3 Market Report Segmentation

  • Type Outlook (Volume, Tons; Revenue, USD Million, 2018 - 2030)

    • Docosahexaenoic acid (DHA)

    • Eicosapentaenoic acid (EPA)

    • Alpha-linolenic acid (ALA)

    • Docosapentaenoic acid (DPA)

    • Others

  • Source Outlook (Volume, Tons; Revenue, USD Million, 2018 - 2030)

    • Marine Source

      • Fish Oil

      • Algal Oil

      • Krill Oil

      • Others

    • Plant Source

      • Nuts & Seeds

      • Vegetable Oils

      • Soy

  • Application Outlook (Volume, Tons; Revenue, USD Million, 2018 - 2030)

    • Supplements & Functional Foods

    • Pharmaceuticals

    • Infant Formula

    • Animal Feed & Pet Food

    • Others

  • Regional Outlook (Volume, Tons; Revenue, USD Million, 2018 - 2030)

    • North America

      • U.S.

      • Canada

      • Mexico

    • Europe

      • Germany

      • U.K.

      • France

      • Spain

      • Italy

      • The Netherlands

      • Norway

    • Asia Pacific

      • China

      • India

      • Japan

      • Australia

      • New Zealand

    • Central & South America

      • Brazil

      • Argentina

    • Middle East & Africa

      • UAE

      • South Africa

Frequently Asked Questions About This Report

Table of Contents

Chapter 1 Omega 3 Market: Methodology and Scope
                  1.1 Market Segmentation & Scope
                  1.2 Market Definition
                  1.3 Information Procurement
                      1.3.1 Purchased Database
                      1.3.2 GVR’s Internal Database
                      1.3.3 Secondary Sources & THIRD-PARTY Perspectives
                  1.4 Information Analysis
                      1.4.1 Data Analysis Models
                  1.5 Market formulation & data visualization
                  1.6 Data validation & publishing
                  1.7 Research Scope and Assumptions
Chapter 2 Omega 3 Market: Executive Summary
                  2.1 Market Snapshot
                  2.2 Segment Snapshot
                  2.3 Competitive Landscape Snapshot
Chapter 3 Omega 3 Market: Market Variables, Trends & Scope
                  3.1 Market Lineage Outlook
                      3.1.1 Global Functional Ingredients Market Outlook
                  3.2 Industry Value Chain Analysis
                      3.2.1 Manufacturing/Technology Trends
                      3.2.2 Sales Channel Analysis
                      3.3.3 Raw Material Trend
                      3.2.3 List of Potential End-Users
                  3.3 Price Trend Analysis, 2018 - 2030
                      3.3.1 Factors Affecting Prices
                  3.4 Regulatory Framework, By Regions
                  3.5 Market Dynamics
                      3.5.1 Market driver analysis
                      3.5.2 Market restraint analysis
                      3.5.3 Market Challenges Analysis
                      3.5.4 Market Opportunity Analysis
                  3.6 Business Environment Analysis
                      3.6.1 Porter’s Analysis
                      3.6.2 PESTEL Analysis
Chapter 4 Omega 3 Market: Type Estimates & Trend Analysis
                  4.1 Type movement analysis & market share, 2023 & 2030
                      4.1.1 Docosahexaenoic acid (DHA)
                          4.1.1.1 Docosahexaenoic acid (DHA) Market Estimates and Forecast, 2018 - 2030 (Tons) (USD Million)
                      4.1.2 Eicosapentaenoic Acid (EPA)
                          4.1.2.1 Eicosapentaenoic Acid (EPA) Market Estimates and Forecast, 2018 - 2030 (Tons) (USD Million)
                      4.1.3 Alpha-linolenic Acid (ALA)
                          4.1.3.1 Phenol-Formaldehyde (PF) Market Estimates and Forecast, 2018 - 2030 (Tons) (USD Million)
                      4.1.4 Docosapentaenoic Acid (DPA)
                          4.1.4.1 Docosapentaenoic Acid (DPA) Market Estimates and Forecast, 2018 - 2030 (Tons) (USD Million)
                      4.1.5 Others
                          4.1.5.1 Others Market Estimates and Forecast, 2018 - 2030 (Tons) (USD Million)
Chapter 5 Omega 3 Market: Source Estimates & Trend Analysis
                  5.1 Source movement analysis & market share, 2023 & 2030
                      5.1.1 Marine Source
                          5.1.1.1 Marine Source Omega 3 Market Estimates and Forecast, 2018 - 2030 (Tons) (USD Million)
                          5.1.1.2 Fish Oil Sourced Omega 3 Market Estimates and Forecast, 2018 - 2030 (Tons) (USD Million)
                          5.1.1.3 Algal Oil Sourced Omega 3 Market Estimates and Forecast, 2018 - 2030 (Tons) (USD Million)
                          5.1.1.4 Krill Oil Sourced Omega 3 Market Estimates and Forecast, 2018 - 2030 (Tons) (USD Million)
                          5.1.1.5 Other Marine Sources Based Omega 3 Market Estimates and Forecast, 2018 - 2030 (Tons) (USD Million)
                      5.1.2 Plant Source
                          5.1.2.1 Plant Source Omega 3 Market Estimates and Forecast, 2018 - 2030 (Tons) (USD Million)
                          5.1.2.2 Nuts & Seeds Based Omega 3 Market Estimates and Forecast, 2018 - 2030 (Tons) (USD Million)
                          5.1.2.3 Vegetable Oils Based Omega 3 Market Estimates and Forecast, 2018 - 2030 (Tons) (USD Million)
                          5.1.2.4 Soy Based Omega 3 Market Estimates and Forecast, 2018 - 2030 (Tons) (USD Million)
Chapter 6 Omega 3 Market: Application Estimates & Trend Analysis
                  6.1 Application movement analysis & market share, 2023 & 2030
                      6.1.1 Supplements & Functional Foods
                          6.1.1.1 Omega 3 Market Estimates and Forecast, in Supplements & Functional Foods, 2018 - 2030 (Tons) (USD Million)
                      6.1.2 Pharmaceuticals
                          6.1.2.1 Omega 3 Market Estimates and Forecast, in Pharmceuticals, 2018 - 2030 (Tons) (USD Million)
                      6.1.3 Infant Formula
                          6.1.3.1 Omega 3 Market Estimates and Forecast, in Infant Formula, 2018 - 2030 (Tons) (USD Million)
                      6.1.4 Animal Feed & Pet Food
                          6.1.4.1 Omega 3 Market Estimates and Forecast, in Animal Feed & Pet Food, 2018 - 2030 (Tons) (USD Million)
                      6.1.5 Others
                          6.1.5.1 Omega 3 Market Estimates and Forecast, in Others, 2018 - 2030 (Tons) (USD Million)
Chapter 7 Omega 3 Market: Regional Estimates & Trend Analysis
                  7.1 Omega 3 Market: Regional Outlook
                  7.2 North America
                      7.2.1 North America Omega 3 Market Estimates & Forecasts, 2018 - 2030 (Tons) (USD Million)
                      7.2.4 U.S.
                          7.2.4.1 Key Country Dynamics
                          7.2.4.2 U.S. Omega 3 Market Estimates & Forecasts, 2018 - 2030 (Tons) (USD Million)
                      7.2.5 Canada
                          7.2.5.1 Key Country Dynamics
                          7.2.5.2 Canada Omega 3 Market Estimates & Forecasts, 2018 - 2030 (Tons) (USD Million)
                      7.2.6 Mexico
                          7.2.6.1 Key Country Dynamics
                          7.2.6.2 Mexico Omega 3 Market Estimates & Forecasts, 2018 - 2030 (Tons) (USD Million)
                  7.3 Europe
                      7.3.1 Europe Omega 3 Market Estimates & Forecasts, 2018 - 2030 (Tons) (USD Million)
                      7.3.4 Germany
                          7.3.4.1 Key Country Dynamics
                          7.3.4.2 Germany Omega 3 Market Estimates & Forecasts, 2018 - 2030 (Tons) (USD Million)
                      7.3.5 UK
                          7.3.5.1 Key Country Dynamics
                          7.3.5.2 UK Omega 3 Market Estimates & Forecasts, 2018 - 2030 (Tons) (USD Million)
                      7.3.6 France
                          7.3.6.1 Key Country Dynamics
                          7.3.6.2 France Omega 3 Market Estimates & Forecasts, 2018 - 2030 (Tons) (USD Million)
                      7.3.6 Spain
                          7.3.6.1 Key Country Dynamics
                          7.3.6.2 Spain Omega 3 Market Estimates & Forecasts, 2018 - 2030 (Tons) (USD Million)
                      7.3.6 Netherland
                          7.3.6.1 Key Country Dynamics
                          7.3.6.2 Netherland Omega 3 Market Estimates & Forecasts, 2018 - 2030 (Tons) (USD Million)
                      7.3.6 Norway
                          7.3.6.1 Key Country Dynamics
                          7.3.6.2 Norway Omega 3 Market Estimates & Forecasts, 2018 - 2030 (Tons) (USD Million)
                  7.4 Asia Pacific
                      7.4.1 Asia Pacific Omega 3 Market Estimates & Forecasts, 2018 - 2030 (Tons) (USD Million)
                      7.4.4 China
                          7.4.4.1 Key Country Dynamics
                          7.4.4.2 China Omega 3 Market Estimates & Forecasts, 2018 - 2030 (Tons) (USD Million)
                      7.4.5 India
                          7.4.5.1 Key Country Dynamics
                          7.4.5.2 India Omega 3 Market Estimates & Forecasts, 2018 - 2030 (Tons) (USD Million)
                      7.4.6 Japan
                          7.4.6.1 Key Country Dynamics
                          7.4.6.2 Japan Omega 3 Market Estimates & Forecasts, 2018 - 2030 (Tons) (USD Million)
                      7.4.6 Australia
                          7.4.6.1 Key Country Dynamics
                          7.4.6.2 Australia Omega 3 Market Estimates & Forecasts, 2018 - 2030 (Tons) (USD Million)
                      7.4.6 New Zealand
                          7.4.6.1 Key Country Dynamics
                          7.4.6.2 New Zealand Omega 3 Market Estimates & Forecasts, 2018 - 2030 (Tons) (USD Million)
                  7.5 Central & South America
                      7.5.1 Central & South America Omega 3 Market Estimates & Forecasts, 2018 - 2030 (Tons) (USD Million)
                      7.5.4 Brazil
                          7.5.4.1 Key Country Dynamics
                          7.5.4.2 Brazil Omega 3 Market Estimates & Forecasts, 2018 - 2030 (Tons) (USD Million)
                      7.5.4 Argentina
                          7.5.4.1 Key Country Dynamics
                          7.5.4.2 Argentina Omega 3 Market Estimates & Forecasts, 2018 - 2030 (Tons) (USD Million)
                  7.6 Middle East & Africa
                      7.6.1 Middle East & Africa Omega 3 Market Estimates & Forecasts, 2018 - 2030,(Tons) (USD Million)
                      7.6.4 UAE
                          7.6.4.1 Key Country Dynamics
                          7.6.4.2 UAE Omega 3 Market Estimates & Forecasts, 2018 - 2030 (Tons) (USD Million)
                      7.6.5 South Africa
                          7.6.4.1 Key Country Dynamics
                          7.6.4.2 South Africa Omega 3 Market Estimates & Forecasts, 2018 - 2030 (Tons) (USD Million)
Chapter 8 Competitive Landscape
                  8.1 Recent Development & Imapct Analysis, By Key Market Participants
                  8.2 Company Categorization
                  8.3 Company Market Share Analysis, 2023
                  8.4 Company Heat Map Analysis
                  8.5 Strategy Mapping
                  8.6 Company Listing
                      8.6.1 H.B. Fuller
                          8.6.1.1 Participants Overview
                          8.6.1.2 Financial Performance
                          8.6.1.3 Product Benchmarking
                      8.6.2 Henkel AG & Co., KGaA
                          8.6.2.1 Participants Overview
                          8.6.2.2 Financial Performance
                          8.6.2.3 Product Benchmarking
                      8.6.3 Bostik S.A.
                          8.6.3.1 Participants Overview
                          8.6.3.2 Financial Performance
                          8.6.3.3 Product Benchmarking
                      8.6.4 3M
                          8.6.4.1 Participants Overview
                          8.6.4.2 Financial Performance
                          8.6.4.3 Product Benchmarking
                      8.6.5 Sika AG
                          8.6.5.1 Participants Overview
                          8.6.5.2 Financial Performance
                          8.6.5.3 Product Benchmarking
                      8.6.6 Ashland, Inc.
                          8.6.6.1 Participants Overview
                          8.6.6.2 Financial Performance
                          8.6.6.3 Product Benchmarking
                      8.6.7 Pidilite Industries Ltd.
                          8.6.7.1 Participants Overview
                          8.6.7.2 Financial Performance
                          8.6.7.3 Product Benchmarking
                      8.6.8 Jubiulant Industries Ltd.
                          8.6.8.1 Participants Overview
                          8.6.8.2 Financial Performance
                          8.6.8.3 Product Benchmarking
                      8.6.9 Akzo Nobel N.V.
                          8.6.9.1 Participants Overview
                          8.6.9.2 Financial Performance
                          8.6.9.3 Product Benchmarking
                      8.6.10 Franklin Adhesives & Polymers
                          8.6.10.1 Participants Overview
                          8.6.10.2 Financial Performance
                          8.6.10.3 Product Benchmarking
                      8.6.11 DowDuPont Inc.
                          8.6.11.1 Participants Overview
                          8.6.11.2 Financial Performance
                          8.6.11.3 Product Benchmarking


List of Tables

Table 1 List of abbreviation
Table 2 Global Omega 3 market estimates and forecasts by type 2018 - 2030 (Tons)
Table 3 Global Omega 3 market estimates and forecasts by type, 2018 - 2030 (USD Million)
Table 4 Global Omega 3 market estimates and forecasts by source 2018 - 2030 (Tons)
Table 5 Global Omega 3 market estimates and forecasts by source, 2018 - 2030 (USD Million)
Table 6 Global Omega 3 market estimates and forecasts by application 2018 - 2030 (Tons)
Table 7 Global Omega 3 market estimates and forecasts by application, 2018 - 2030 (USD Million)
Table 8 Global Omega 3 market estimates and forecasts by region 2018 - 2030 (Tons)
Table 9 Global Omega 3 market estimates and forecasts by region, 2018 - 2030 (USD Million)
Table 10 North America Omega 3 market estimates and forecasts by type 2018 - 2030 (Tons)
Table 11 North America Omega 3 market estimates and forecasts by type, 2018 - 2030 (USD Million)
Table 12 North America Omega 3 market estimates and forecasts by source 2018 - 2030 (Tons)
Table 13 North America Omega 3 market estimates and forecasts by source, 2018 - 2030 (USD Million)
Table 14 North America Omega 3 market estimates and forecasts by application 2018 - 2030 (Tons)
Table 15 North America Omega 3 market estimates and forecasts by application, 2018 - 2030 (USD Million)
Table 16 U.S. Macroeconomic Outlay
Table 17 U.S. Omega 3 market estimates and forecasts by type 2018 - 2030 (Tons)
Table 18 U.S. Omega 3 market estimates and forecasts by type, 2018 - 2030 (USD Million)
Table 19 U.S. Omega 3 market estimates and forecasts by source 2018 - 2030 (Tons)
Table 20 U.S. Omega 3 market estimates and forecasts by source, 2018 - 2030 (USD Million)
Table 21 U.S. Omega 3 market estimates and forecasts by application 2018 - 2030 (Tons)
Table 22 U.S. Omega 3 market estimates and forecasts by application, 2018 - 2030 (USD Million)
Table 23 Canada Macroeconomic Outlay
Table 24 Canada Omega 3 market estimates and forecasts by type 2018 - 2030 (Tons)
Table 25 Canada Omega 3 market estimates and forecasts by type, 2018 - 2030 (USD Million)
Table 26 Canada Omega 3 market estimates and forecasts by source 2018 - 2030 (Tons)
Table 27 Canada Omega 3 market estimates and forecasts by source, 2018 - 2030 (USD Million)
Table 28 Canada Omega 3 market estimates and forecasts by application 2018 - 2030 (Tons)
Table 29 Canada Omega 3 market estimates and forecasts by application, 2018 - 2030 (USD Million)
Table 30 Mexico Macroeconomic Outlay
Table 31 Mexico Omega 3 market estimates and forecasts by type 2018 - 2030 (Tons)
Table 32 Mexico Omega 3 market estimates and forecasts by type, 2018 - 2030 (USD Million)
Table 33 Mexico Omega 3 market estimates and forecasts by source 2018 - 2030 (Tons)
Table 34 Mexico Omega 3 market estimates and forecasts by source, 2018 - 2030 (USD Million)
Table 35 Mexico Omega 3 market estimates and forecasts by application 2018 - 2030 (Tons)
Table 36 Mexico Omega 3 market estimates and forecasts by application, 2018 - 2030 (USD Million)
Table 37 Europe Omega 3 market estimates and forecasts by type 2018 - 2030 (Tons)
Table 38 Europe Omega 3 market estimates and forecasts by type, 2018 - 2030 (USD Million)
Table 39 Europe Omega 3 market estimates and forecasts by source 2018 - 2030 (Tons)
Table 40 Europe Omega 3 market estimates and forecasts by source, 2018 - 2030 (USD Million)
Table 41 Europe Omega 3 market estimates and forecasts by application 2018 - 2030 (Tons)
Table 42 Europe Omega 3 market estimates and forecasts by application, 2018 - 2030 (USD Million)
Table 43 Germany Macroeconomic Outlay
Table 44 Germany Omega 3 market estimates and forecasts by type 2018 - 2030 (Tons)
Table 45 Germany Omega 3 market estimates and forecasts by type, 2018 - 2030 (USD Million)
Table 46 Germany Omega 3 market estimates and forecasts by source 2018 - 2030 (Tons)
Table 47 Germany Omega 3 market estimates and forecasts by source, 2018 - 2030 (USD Million)
Table 48 Germany Omega 3 market estimates and forecasts by application 2018 - 2030 (Tons)
Table 49 Germany Omega 3 market estimates and forecasts by application, 2018 - 2030 (USD Million)
Table 50 UK Macroeconomic Outlay
Table 51 UK Omega 3 market estimates and forecasts by type 2018 - 2030 (Tons)
Table 52 UK Omega 3 market estimates and forecasts by type, 2018 - 2030 (USD Million)
Table 53 UK Omega 3 market estimates and forecasts by source 2018 - 2030 (Tons)
Table 54 UK Omega 3 market estimates and forecasts by source, 2018 - 2030 (USD Million)
Table 55 UK Omega 3 market estimates and forecasts by application 2018 - 2030 (Tons)
Table 56 UK Omega 3 market estimates and forecasts by application, 2018 - 2030 (USD Million)
Table 57 France Macroeconomic Outlay
Table 58 France Omega 3 market estimates and forecasts by type 2018 - 2030 (Tons)
Table 59 France Omega 3 market estimates and forecasts by type, 2018 - 2030 (USD Million)
Table 60 France Omega 3 market estimates and forecasts by source 2018 - 2030 (Tons)
Table 61 France Omega 3 market estimates and forecasts by source, 2018 - 2030 (USD Million)
Table 62 France Omega 3 market estimates and forecasts by application 2018 - 2030 (Tons)
Table 63 France Omega 3 market estimates and forecasts by application, 2018 - 2030 (USD Million)
Table 64 Italy Macroeconomic Outlay
Table 65 Italy Omega 3 market estimates and forecasts by type 2018 - 2030 (Tons)
Table 66 Italy Omega 3 market estimates and forecasts by type, 2018 - 2030 (USD Million)
Table 67 Italy Omega 3 market estimates and forecasts by source 2018 - 2030 (Tons)
Table 68 Italy Omega 3 market estimates and forecasts by source, 2018 - 2030 (USD Million)
Table 69 Italy Omega 3 market estimates and forecasts by application 2018 - 2030 (Tons)
Table 70 Italy Omega 3 market estimates and forecasts by application, 2018 - 2030 (USD Million)
Table 71 Spain Macroeconomic Outlay
Table 72 Spain Omega 3 market estimates and forecasts by type 2018 - 2030 (Tons)
Table 73 Spain Omega 3 market estimates and forecasts by type, 2018 - 2030 (USD Million)
Table 74 Spain Omega 3 market estimates and forecasts by source 2018 - 2030 (Tons)
Table 75 Spain Omega 3 market estimates and forecasts by source, 2018 - 2030 (USD Million)
Table 76 Spain Omega 3 market estimates and forecasts by application 2018 - 2030 (Tons)
Table 77 Spain Omega 3 market estimates and forecasts by application, 2018 - 2030 (USD Million)
Table 78 The Netherlands Macroeconomic Outlay
Table 79 The Netherlands Omega 3 market estimates and forecasts by type 2018 - 2030 (Tons)
Table 80 The Netherlands Omega 3 market estimates and forecasts by type, 2018 - 2030 (USD Million)
Table 81 The Netherlands Omega 3 market estimates and forecasts by source 2018 - 2030 (Tons)
Table 82 The Netherlands Omega 3 market estimates and forecasts by source, 2018 - 2030 (USD Million)
Table 83 The Netherlands Omega 3 market estimates and forecasts by application 2018 - 2030 (Tons)
Table 84 The Netherlands Omega 3 market estimates and forecasts by application, 2018 - 2030 (USD Million)
Table 85 Norway Macroeconomic Outlay
Table 86 Norway Omega 3 market estimates and forecasts by type 2018 - 2030 (Tons)
Table 87 Norway Omega 3 market estimates and forecasts by type, 2018 - 2030 (USD Million)
Table 88 Norway Omega 3 market estimates and forecasts by source 2018 - 2030 (Tons)
Table 89 Norway Omega 3 market estimates and forecasts by source, 2018 - 2030 (USD Million)
Table 90 Norway Omega 3 market estimates and forecasts by application 2018 - 2030 (Tons)
Table 91 Norway Omega 3 market estimates and forecasts by application, 2018 - 2030 (USD Million)
Table 92 Asia Pacific Omega 3 market estimates and forecasts by type 2018 - 2030 (Tons)
Table 93 Asia Pacific Omega 3 market estimates and forecasts by type, 2018 - 2030 (USD Million)
Table 94 Asia Pacific Omega 3 market estimates and forecasts by source 2018 - 2030 (Tons)
Table 95 Asia Pacific Omega 3 market estimates and forecasts by source, 2018 - 2030 (USD Million)
Table 96 Asia Pacific Omega 3 market estimates and forecasts by application 2018 - 2030 (Tons)
Table 97 Asia Pacific Omega 3 market estimates and forecasts by application, 2018 - 2030 (USD Million)
Table 98 China Macroeconomic Outlay
Table 99 China Omega 3 market estimates and forecasts by type 2018 - 2030 (Tons)
Table 100 China Omega 3 market estimates and forecasts by type, 2018 - 2030 (USD Million)
Table 101 China Omega 3 market estimates and forecasts by source 2018 - 2030 (Tons)
Table 102 China Omega 3 market estimates and forecasts by source, 2018 - 2030 (USD Million)
Table 103 China Omega 3 market estimates and forecasts by application 2018 - 2030 (Tons)
Table 104 China Omega 3 market estimates and forecasts by application, 2018 - 2030 (USD Million)
Table 105 India Macroeconomic Outlay
Table 106 India Omega 3 market estimates and forecasts by type 2018 - 2030 (Tons)
Table 107 India Omega 3 market estimates and forecasts by type, 2018 - 2030 (USD Million)
Table 108 India Omega 3 market estimates and forecasts by source 2018 - 2030 (Tons)
Table 109 India Omega 3 market estimates and forecasts by source, 2018 - 2030 (USD Million)
Table 110 India Omega 3 market estimates and forecasts by application 2018 - 2030 (Tons)
Table 111 India Omega 3 market estimates and forecasts by application, 2018 - 2030 (USD Million)
Table 112 Japan Macroeconomic Outlay
Table 113 Japan Omega 3 market estimates and forecasts by type 2018 - 2030 (Tons)
Table 114 Japan Omega 3 market estimates and forecasts by type, 2018 - 2030 (USD Million)
Table 115 Japan Omega 3 market estimates and forecasts by source 2018 - 2030 (Tons)
Table 116 Japan Omega 3 market estimates and forecasts by source, 2018 - 2030 (USD Million)
Table 117 Japan Omega 3 market estimates and forecasts by application 2018 - 2030 (Tons)
Table 118 Japan Omega 3 market estimates and forecasts by application, 2018 - 2030 (USD Million)
Table 119 Australia Macroeconomic Outlay
Table 120 Australia Omega 3 market estimates and forecasts by type 2018 - 2030 (Tons)
Table 121 Australia Omega 3 market estimates and forecasts by type, 2018 - 2030 (USD Million)
Table 122 Australia Omega 3 market estimates and forecasts by source 2018 - 2030 (Tons)
Table 123 Australia Omega 3 market estimates and forecasts by source, 2018 - 2030 (USD Million)
Table 124 Australia Omega 3 market estimates and forecasts by application 2018 - 2030 (Tons)
Table 125 Australia Omega 3 market estimates and forecasts by application, 2018 - 2030 (USD Million)
Table 126 New Zealand Macroeconomic Outlay
Table 127 New Zealand Omega 3 market estimates and forecasts by type 2018 - 2030 (Tons)
Table 128 New Zealand Omega 3 market estimates and forecasts by type, 2018 - 2030 (USD Million)
Table 129 New Zealand Omega 3 market estimates and forecasts by source 2018 - 2030 (Tons)
Table 130 New Zealand Omega 3 market estimates and forecasts by source, 2018 - 2030 (USD Million)
Table 131 New Zealand Omega 3 market estimates and forecasts by application 2018 - 2030 (Tons)
Table 132 New Zealand Omega 3 market estimates and forecasts by application, 2018 - 2030 (USD Million)
Table 133 Central & South America Omega 3 market estimates and forecasts by type 2018 - 2030 (Tons)
Table 134 Central & South America Omega 3 market estimates and forecasts by type, 2018 - 2030 (USD Million)
Table 135 Central & South America Omega 3 market estimates and forecasts by source 2018 - 2030 (Tons)
Table 136 Central & South America Omega 3 market estimates and forecasts by source, 2018 - 2030 (USD Million)
Table 137 Central & South America Omega 3 market estimates and forecasts by application 2018 - 2030 (Tons)
Table 138 Central & South America Omega 3 market estimates and forecasts by application, 2018 - 2030 (USD Million)
Table 139 Brazil Macroeconomic Outlay
Table 140 Brazil Omega 3 market estimates and forecasts by type 2018 - 2030 (Tons)
Table 141 Brazil Omega 3 market estimates and forecasts by type, 2018 - 2030 (USD Million)
Table 142 Brazil Omega 3 market estimates and forecasts by source 2018 - 2030 (Tons)
Table 143 Brazil Omega 3 market estimates and forecasts by source, 2018 - 2030 (USD Million)
Table 144 Brazil Omega 3 market estimates and forecasts by application 2018 - 2030 (Tons)
Table 145 Brazil Omega 3 market estimates and forecasts by application, 2018 - 2030 (USD Million)
Table 146 Argentina Macroeconomic Outlay
Table 147 Argentina Omega 3 market estimates and forecasts by type 2018 - 2030 (Tons)
Table 148 Argentina Omega 3 market estimates and forecasts by type, 2018 - 2030 (USD Million)
Table 149 Argentina Omega 3 market estimates and forecasts by source 2018 - 2030 (Tons)
Table 150 Argentina Omega 3 market estimates and forecasts by source, 2018 - 2030 (USD Million)
Table 151 Argentina Omega 3 market estimates and forecasts by application 2018 - 2030 (Tons)
Table 152 Argentina Omega 3 market estimates and forecasts by application, 2018 - 2030 (USD Million)
Table 153 Middle East & Africa Omega 3 market estimates and forecasts by type 2018 - 2030 (Tons)
Table 154 Middle East & Africa Omega 3 market estimates and forecasts by type, 2018 - 2030 (USD Million)
Table 155 Middle East & Africa Omega 3 market estimates and forecasts by source 2018 - 2030 (Tons)
Table 156 Middle East & Africa Omega 3 market estimates and forecasts by source, 2018 - 2030 (USD Million)
Table 157 Middle East & Africa Omega 3 market estimates and forecasts by application 2018 - 2030 (Tons)
Table 158 Middle East & Africa Omega 3 market estimates and forecasts by application, 2018 - 2030 (USD Million)
Table 159 UAE Macroeconomic Outlay
Table 160 UAE Omega 3 market estimates and forecasts by type 2018 - 2030 (Tons)
Table 161 UAE Omega 3 market estimates and forecasts by type, 2018 - 2030 (USD Million)
Table 162 UAE Omega 3 market estimates and forecasts by source 2018 - 2030 (Tons)
Table 163 UAE Omega 3 market estimates and forecasts by source, 2018 - 2030 (USD Million)
Table 164 UAE Omega 3 market estimates and forecasts by application 2018 - 2030 (Tons)
Table 165 UAE Omega 3 market estimates and forecasts by application, 2018 - 2030 (USD Million)
Table 166 South Africa Macroeconomic Outlay
Table 167 South Africa Omega 3 market estimates and forecasts by type 2018 - 2030 (Tons)
Table 168 South Africa Omega 3 market estimates and forecasts by type, 2018 - 2030 (USD Million)
Table 169 South Africa Omega 3 market estimates and forecasts by source 2018 - 2030 (Tons)
Table 170 South Africa Omega 3 market estimates and forecasts by source, 2018 - 2030 (USD Million)
Table 171 South Africa Omega 3 market estimates and forecasts by application 2018 - 2030 (Tons)
Table 172 South Africa Omega 3 market estimates and forecasts by application, 2018 - 2030 (USD Million)
Table 173 Participants Overview
Table 174 Financial Performance
Table 175 Product Benchmarking
Table 176 Recent Development by Key Players & Its Impact


List of Figures

Fig. 1 Omega 3 Market Segmentation & Scope
Fig. 2 Information procurement
Fig. 3 Data analysis models
Fig. 4 Market formulation and validation
Fig. 5 Data validating & publishing
Fig. 6 Omega 3 Market Snapshot
Fig. 7 Omega 3 Market Regional Snapshot
Fig. 8 Omega 3 Market Segment Snapshot
Fig. 9 Omega 3 Market Competitive Landscape Snapshot
Fig. 10 Global Functional Ingredients Market and Omega 3 Market Value, 2023 (USD Million)
Fig. 11 Omega 3 Market - Value Chain Analysis
Fig. 12 Omega 3 Market - Price Trend Analysis 2018 - 2030 (USD/kg)
Fig. 13 Omega 3 Market - Market Dynamics
Fig. 14 PORTER’S Analysis
Fig. 15 PESTEL Analysis
Fig. 16 Omega 3 Market Estimates & Forecasts, by Type: Key Takeaways
Fig. 17 Omega 3 Market Share, By Type, 2023 & 2030
Fig. 18 Docosahexaenoic acid (DHA) Market Estimates & Forecasts, 2018 - 2030 (Tons) (USD Million)
Fig. 19 Eicosapentaenoic acid (EPA) Market Estimates & Forecasts, 2018 - 2030 (Tons) (USD Million)
Fig. 20 Alpha-linolenic acid (ALA) Market Estimates & Forecasts, 2018 - 2030 (Tons) (USD Million)
Fig. 21 Docosapentaenoic acid (DAP) Market Estimates & Forecasts, 2018 - 2030 (Tons) (USD Million)
Fig. 22 Others Market Estimates & Forecasts, 2018 - 2030 (Tons) (USD Million)
Fig. 23 Omega 3 Market Estimates & Forecasts, by Source: Key Takeaways
Fig. 24 Omega 3 Market Share, By Source, 2023 & 2030
Fig. 25 Marine Source Omega 3 Market Estimates & Forecasts, 2018 - 2030 (Tons) (USD Million)
Fig. 26 Fish Oil Sourced Omega 3 Market Estimates & Forecasts, 2018 - 2030 (Tons) (USD Million)
Fig. 27 Algal Oil Sourced Omega 3 Market Estimates & Forecasts, 2018 - 2030 (Tons) (USD Million)
Fig. 28 Krill Oil Sourced Omega 3 Market Estimates & Forecasts, 2018 - 2030 (Tons) (USD Million)
Fig. 29 Other Marine Sources Based Omega 3 Market Estimates & Forecasts, 2018 - 2030 (Tons) (USD Million)
Fig. 30 Plant Source Omega 3 Market Estimates & Forecasts, 2018 - 2030 (Tons) (USD Million)
Fig. 31 Nuts & Seeds Based Omega 3 Market Estimates & Forecasts, 2018 - 2030 (Tons) (USD Million)
Fig. 32 Vegetable Oils Based Omega 3 Market Estimates & Forecasts, 2018 - 2030 (Tons) (USD Million)
Fig. 33 Soy Based Omega 3 Market Estimates & Forecasts, 2018 - 2030 (Tons) (USD Million)
Fig. 34 Omega 3 Market Estimates & Forecasts, by Application: Key Takeaways
Fig. 35 Omega 3 Market Share, By Application, 2023 & 2030
Fig. 36 Omega 3 Market Estimates & Forecasts, in Supplements & Functional Foods, 2018 - 2030 (Tons) (USD Million)
Fig. 37 Omega 3 Market Estimates & Forecasts,in Pharmaceuticals, 2018 - 2030 (Tons) (USD Million)
Fig. 38 Omega 3 Market Estimates & Forecasts, in Infant Formula, 2018 - 2030 (Tons) (USD Million)
Fig. 39 Omega 3 Market Estimates & Forecasts, in Animal Feed & Pet Food 2018 - 2030 (Tons) (USD Million)
Fig. 40 Omega 3 Market Estimates & Forecasts, in Others, 2018 - 2030 (Tons) (USD Million)
Fig. 41 Omega 3 Market Revenue, by Region, 2023 & 2030 (USD Million)
Fig. 42 North America Omega 3 Market Estimates & Forecasts, 2018 - 2030 (Tons) (Tons) (USD Million)
Fig. 43 U.S. Omega 3 Market Estimates & Forecasts, 2018 - 2030 (Tons) (USD Million)
Fig. 44 Canada Omega 3 Market Estimates & Forecasts, 2018 - 2030 (Tons) (USD Million)
Fig. 45 Mexico Omega 3 Market Estimates & Forecasts, 2018 - 2030 (Tons) (USD Million)
Fig. 46 Europe Omega 3 Market Estimates & Forecasts, 2018 - 2030 (Tons) (USD Million)
Fig. 47 Germany Omega 3 Market Estimates & Forecasts, 2018 - 2030 (Tons) (USD Million)
Fig. 48 UK Omega 3 Market Estimates & Forecasts, 2018 - 2030 (Tons) (USD Million)
Fig. 49 France Omega 3 Market Estimates & Forecasts, 2018 - 2030 (Tons) (USD Million)
Fig. 50 Spain Omega 3 Market Estimates & Forecasts, 2018 - 2030 (Tons) (USD Million)
Fig. 51 Netherland Omega 3 Market Estimates & Forecasts, 2018 - 2030 (Tons) (USD Million)
Fig. 52 Norway Omega 3 Market Estimates & Forecasts, 2018 - 2030 (Tons) (USD Million)
Fig. 53 Asia Pacific Omega 3 Market Estimates & Forecasts, 2018 - 2030 (Tons) (USD Million)
Fig. 54 China Omega 3 Market Estimates & Forecasts, 2018 - 2030 (Tons) (USD Million)
Fig. 55 India Omega 3 Market Estimates & Forecasts, 2018 - 2030 (Tons) (USD Million)
Fig. 56 Japan Omega 3 Market Estimates & Forecasts, 2018 - 2030 (Tons) (USD Million)
Fig. 57 Australia Omega 3 Market Estimates & Forecasts, 2018 - 2030 (Tons) (USD Million)
Fig. 58 New Zealand Omega 3 Market Estimates & Forecasts, 2018 - 2030 (Tons) (USD Million)
Fig. 59 Central & South America Omega 3 Market Estimates & Forecasts, 2018 - 2030 (Tons) (USD Million)
Fig. 60 Brazil Omega 3 Market Estimates & Forecasts, 2018 - 2030 (Tons) (USD Million)
Fig. 61 Argentina Omega 3 Market Estimates & Forecasts, 2018 - 2030 (Tons) (USD Million)
Fig. 62 Middle East & Africa Omega 3 Market Estimates & Forecasts, 2018 - 2030 (Tons) (USD Million)
Fig. 63 UAE Omega 3 Market Estimates & Forecasts, 2018 - 2030 (Tons) (USD Million)
Fig. 64 South Africa Omega 3 Market Estimates & Forecasts, 2018 - 2030 (Tons) (USD Million
Fig. 65 Key Company Categorization
Fig. 66 Company Market Positioning
Fig. 67 Strategy Mapping

What questions do you have? Get quick response from our industry experts. Request a Free Consultation

Market Segmentation

  • Omega 3 Type Outlook (Volume, Tons; Revenue, USD Million, 2018 - 2030)
    • Docosahexaenoic acid (DHA)
    • Eicosapentaenoic acid (EPA)
    • Alpha-linolenic acid (ALA)
  • Omega 3 Source Outlook (Volume, Tons; Revenue, USD Million, 2018 - 2030)
    • Marine Source
    • Plant Source
  • Omega 3 Application Outlook (Volume, Tons; Revenue, USD Million, 2018 - 2030)
    • Supplements & Functional Foods
    • Pharmaceuticals
    • Infant Formula
    • Animal Feed & Pet Food
    • Others
  • Omega 3 Regional Outlook (Volume, Tons; Revenue, USD Million, 2018 - 2030)
    • North America
      • North America Omega 3 Market, By Type
        • Docosahexaenoic acid (DHA)
        • Eicosapentaenoic acid (EPA)
        • Alpha-linoleic acid (ALA)
      • North America Omega 3 Market, By Source
        • Marine Source
        • Plant Source
      • North America Omega 3 Market, By Application
        • Supplements & Functional Foods
        • Pharmaceuticals
        • Infant Formula
        • Animal Feed & Pet Food
        • Others
      • U.S.
        • U.S. Omega 3 Market, By Type
          • Docosahexaenoic acid (DHA)
          • Eicosapentaenoic acid (EPA)
          • Alpha-linoleic acid (ALA)
        • U.S. Omega 3 Market, By Source
          • Marine Source
          • Plant Source
        • U.S. Omega 3 Market, By Application
          • Supplements & Functional Foods
          • Pharmaceuticals
          • Infant Formula
          • Animal Feed & Pet Food
          • Others
      • Canada
        • Canada Omega 3 Market, By Type
          • Docosahexaenoic Acid (DHA)
          • Eicosapentaenoic Acid (EPA)
          • Alpha-Linoleic Acid (ALA)
        • Canada Omega 3 Market, By Source
          • Marine Source
          • Plant Source
        • Canada Omega 3 Market, By Application
          • Supplements & Functional Foods
          • Pharmaceuticals
          • Infant Formula
          • Animal Feed & Pet Food
          • Others
      • Mexico
        • Mexico Omega 3 Market, By Type
          • Docosahexaenoic Acid (DHA)
          • Eicosapentaenoic Acid (EPA)
          • Alpha-Linoleic Acid (ALA)
        • Mexico Omega 3 Market, By Source
          • Marine Source
          • Plant Source
        • Mexico Omega 3 Market, By Application
          • Supplements & Functional Foods
          • Pharmaceuticals
          • Infant Formula
          • Animal Feed & Pet Food
          • Others
    • Europe
      • Europe Omega 3 Market, By Type
        • Docosahexaenoic acid (DHA)
        • Eicosapentaenoic acid (EPA)
        • Alpha-linoleic acid (ALA)
      • Europe Omega 3 Market, By Source
        • Marine Source
        • Plant Source
      • Europe Omega 3 Market, By Application
        • Supplements & Functional Foods
        • Pharmaceuticals
        • Infant Formula
        • Animal Feed & Pet Food
        • Others
      • Germany
        • Germany Omega 3 Market, By Type
          • Docosahexaenoic acid (DHA)
          • Eicosapentaenoic acid (EPA)
          • Alpha-linoleic acid (ALA)
        • Germany Omega 3 Market, By Source
          • Marine Source
          • Plant Source
        • Germany Omega 3 Market, By Application
          • Supplements & Functional Foods
          • Pharmaceuticals
          • Infant Formula
          • Animal Feed & Pet Food
          • Others
      • UK
        • UK Omega 3 Market, By Type
          • Docosahexaenoic acid (DHA)
          • Eicosapentaenoic acid (EPA)
          • Alpha-linoleic acid (ALA)
        • UK Omega 3 Market, By Source
          • Marine Source
          • Plant Source
        • UK Omega 3 Market, By Application
          • Supplements & Functional Foods
          • Pharmaceuticals
          • Infant Formula
          • Animal Feed & Pet Food
          • Others
      • France
        • France Omega 3 Market, By Type
          • Docosahexaenoic Acid (DHA)
          • Eicosapentaenoic Acid (EPA)
          • Alpha-Linoleic Acid (ALA)
        • France Omega 3 Market, By Source
          • Marine Source
          • Plant Source
        • France Omega 3 Market, By Application
          • Supplements & Functional Foods
          • Pharmaceuticals
          • Infant Formula
          • Animal Feed & Pet Food
          • Others
      • Spain
        • Spain Omega 3 Market, By Type
          • Docosahexaenoic Acid (DHA)
          • Eicosapentaenoic Acid (EPA)
          • Alpha-Linoleic Acid (ALA)
        • Spain Omega 3 Market, By Source
          • Marine Source
          • Plant Source
        • Spain Omega 3 Market, By Application
          • Supplements & Functional Foods
          • Pharmaceuticals
          • Infant Formula
          • Animal Feed & Pet Food
          • Others
      • Italy
        • Italy Omega 3 Market, By Type
          • Docosahexaenoic Acid (DHA)
          • Eicosapentaenoic Acid (EPA)
          • Alpha-Linoleic Acid (ALA)
        • Italy Omega 3 Market, By Source
          • Marine Source
          • Plant Source
        • Italy Omega 3 Market, By Application
          • Supplements & Functional Foods
          • Pharmaceuticals
          • Infant Formula
          • Animal Feed & Pet Food
          • Others
      • The Netherlands
        • The Netherlands Omega 3 Market, By Type
          • Docosahexaenoic Acid (DHA)
          • Eicosapentaenoic Acid (EPA)
          • Alpha-Linoleic Acid (ALA)
        • The Netherlands Omega 3 Market, By Source
          • Marine Source
          • Plant Source
        • The Netherlands Omega 3 Market, By Application
          • Supplements & Functional Foods
          • Pharmaceuticals
          • Infant Formula
          • Animal Feed & Pet Food
          • Others
      • Norway
        • Norway Omega 3 Market, By Type
          • Docosahexaenoic Acid (DHA)
          • Eicosapentaenoic Acid (EPA)
          • Alpha-Linoleic Acid (ALA)
        • Norway Omega 3 Market, By Source
          • Marine Source
          • Plant Source
        • Norway Omega 3 Market, By Application
          • Supplements & Functional Foods
          • Pharmaceuticals
          • Infant Formula
          • Animal Feed & Pet Food
          • Others
    • Asia Pacific
      • Asia Pacific Omega 3 Market, By Type
        • Docosahexaenoic acid (DHA)
        • Eicosapentaenoic acid (EPA)
        • Alpha-linoleic acid (ALA)
      • Asia Pacific Omega 3 Market, By Source
        • Marine Source
        • Plant Source
      • Asia Pacific Omega 3 Market, By Application
        • Supplements & Functional Foods
        • Pharmaceuticals
        • Infant Formula
        • Animal Feed & Pet Food
        • Others
      • China
        • China Omega 3 Market, By Type
          • Docosahexaenoic Acid (DHA)
          • Eicosapentaenoic Acid (EPA)
          • Alpha-Linoleic Acid (ALA)
        • China Omega 3 Market, By Source
          • Marine Source
          • Plant Source
        • China Omega 3 Market, By Application
          • Supplements & Functional Foods
          • Pharmaceuticals
          • Infant Formula
          • Animal Feed & Pet Food
          • Others
      • India
        • India Omega 3 Market, By Type
          • Docosahexaenoic Acid (DHA)
          • Eicosapentaenoic Acid (EPA)
          • Alpha-Linoleic Acid (ALA)
        • India Omega 3 Market, By Source
          • Marine Source
          • Plant Source
        • India Omega 3 Market, By Application
          • Supplements & Functional Foods
          • Pharmaceuticals
          • Infant Formula
          • Animal Feed & Pet Food
          • Others
      • Japan
        • Japan Omega 3 Market, By Type
          • Docosahexaenoic Acid (DHA)
          • Eicosapentaenoic Acid (EPA)
          • Alpha-Linoleic Acid (ALA)
        • Japan Omega 3 Market, By Source
          • Marine Source
          • Plant Source
        • Japan Omega 3 Market, By Application
          • Supplements & Functional Foods
          • Pharmaceuticals
          • Infant Formula
          • Animal Feed & Pet Food
          • Others
      • Australia
        • Australia Omega 3 Market, By Type
          • Docosahexaenoic Acid (DHA)
          • Eicosapentaenoic Acid (EPA)
          • Alpha-Linoleic Acid (ALA)
        • Australia Omega 3 Market, By Source
          • Marine Source
          • Plant Source
        • Australia Omega 3 Market, By Application
          • Supplements & Functional Foods
          • Pharmaceuticals
          • Infant Formula
          • Animal Feed & Pet Food
          • Others
      • New Zealand
        • New Zealand Omega 3 Market, By Type
          • Docosahexaenoic Acid (DHA)
          • Eicosapentaenoic Acid (EPA)
          • Alpha-Linoleic Acid (ALA)
        • New Zealand Omega 3 Market, By Source
          • Marine Source
          • Plant Source
        • New Zealand Omega 3 Market, By Application
          • Supplements & Functional Foods
          • Pharmaceuticals
          • Infant Formula
          • Animal Feed & Pet Food
          • Others
    • Central & South America
      • Central & South America Omega 3 Market, By Type
        • Docosahexaenoic acid (DHA)
        • Eicosapentaenoic acid (EPA)
        • Alpha-linoleic acid (ALA)
      • Central & South America Omega 3 Market, By Source
        • Marine Source
        • Plant Source
      • Central & South America Omega 3 Market, By Application
        • Supplements & Functional Foods
        • Pharmaceuticals
        • Infant Formula
        • Animal Feed & Pet Food
        • Others
      • Brazil
        • Brazil Omega 3 Market, By Type
          • Docosahexaenoic Acid (DHA)
          • Eicosapentaenoic Acid (EPA)
          • Alpha-Linoleic Acid (ALA)
        • Brazil Omega 3 Market, By Source
          • Marine Source
          • Plant Source
        • Brazil Omega 3 Market, By Application
          • Supplements & Functional Foods
          • Pharmaceuticals
          • Infant Formula
          • Animal Feed & Pet Food
          • Others
      • Argentina
        • Argentina Omega 3 Market, By Type
          • Docosahexaenoic acid (DHA)
          • Eicosapentaenoic acid (EPA)
          • Alpha-linoleic acid (ALA)
        • Argentina Omega 3 Market, By Source
          • Marine Source
          • Plant Source
        • Argentina Omega 3 Market, By Application
          • Supplements & Functional Foods
          • Pharmaceuticals
          • Infant Formula
          • Animal Feed & Pet Food
          • Others
    • Middle East & Africa
      • Middle East & Africa Omega 3 Market, By Type
        • Docosahexaenoic acid (DHA)
        • Eicosapentaenoic acid (EPA)
        • Alpha-linoleic acid (ALA)
      • Middle East & Africa Omega 3 Market, By Source
        • Marine Source
        • Plant Source
      • Middle East & Africa Omega 3 Market, By Application
        • Supplements & Functional Foods
        • Pharmaceuticals
        • Infant Formula
        • Animal Feed & Pet Food
        • Others
      • UAE
        • UAE Omega 3 Market, By Type
          • Docosahexaenoic acid (DHA)
          • Eicosapentaenoic acid (EPA)
          • Alpha-linoleic acid (ALA)
        • UAE Omega 3 Market, By Source
          • Marine Source
          • Plant Source
        • UAE Omega 3 Market, By Application
          • Supplements & Functional Foods
          • Pharmaceuticals
          • Infant Formula
          • Animal Feed & Pet Food
          • Others

Omega 3 Market Dynamics

Driver: Rising penetration of omega 3 in the active pharmaceutical ingredient market

The demand for omega-3 polyunsaturated fatty acids in functional foods and pharmaceuticals is projected to increase in the coming years. This can be attributed to the growing awareness about healthcare and chronic diseases, which has led to a higher demand for omega-3 in various applications. Moreover, regulations supporting the use of omega-3 in infant formulations are anticipated to drive its demand in developed economies further. Market players are actively expanding their product portfolios through mergers and acquisitions. A recent example is Aker BioMarine's partnership with GEA Group AG to establish a new krill-based protein plant in Norway. Companies are also investing more in product development and research. In 2023, Nuseed Global introduced an innovative plant-based alternative to fish-derived omega-3 DHA and EPA, offering consumers a sustainable and environmentally friendly option. Epax, a brand under FMC Corporation's Health and Nutrition Division, provides high-quality pharmaceutical ingredients, including concentrated marine omega-3 fatty acids from sustainable and traceable sources. BASF Nutrition and Health, in collaboration with Ideogen, is developing an omega-3 product to address the chronic condition known as non-alcoholic fatty liver disease (NAFLD), which is prevalent in the UK and Italy.

Driver: Growing demand for dietary supplements

Omega-3 fatty acids are essential for the proper growth and development of the human body. They have a significant impact on protecting against heart and cardiovascular diseases. Omega-3 fatty acids are renowned for their ability to reduce the risk of abnormal heartbeats or arrhythmias, which can potentially lead to sudden death. Additionally, they aid in lowering triglyceride levels, slowing down the growth of atherosclerotic plaque, and reducing blood pressure. Hypertriglyceridemia, a condition characterized by extremely high triglyceride levels, can result in complications such as obesity and diabetes, further increasing the risk of heart disease. Currently, around four million Americans are affected by severe hypertriglyceridemia, and this number is projected to rise significantly in the future. The dietary supplements industry benefits from consumer attention and pharmaceutical companies' ongoing research and development efforts. The omega-3 supplement market, for example, is influenced by factors such as research, sourcing, and the ongoing pandemic. Various sources, including algae, tuna oil, calanus, herring roe, and genetically modified canola oil, are being explored for omega-3 production. An innovative example is Nutriterra Total Omega-3 by Nuseed Global, a canola oil expressing DHA, EPA, and ALA. Increasing health concerns and growing awareness among individuals about nutraceuticals are expected to be crucial in driving the dietary supplement market.

Restraint: Declining growth rate of fish production

The demand for omega-3 fatty acids in pharmaceutical products, dietary supplements, and food & beverages has experienced a rapid increase in recent years due to their exceptional health benefits and the rising prevalence of cardiovascular diseases. Fish oil, the most widely available dietary source of DHA and EPA, accounts for more than 50% of the various sources of omega-3 fatty acids. As fish oil consumption continues to rise, the availability of raw materials for fishmeal is expected to decrease. The growth in fish consumption, primarily driven by developing countries, is projected to persist in the near future due to population growth, changing lifestyles, and consumer preferences for a broader range of food options. On a global scale, fish production is anticipated to shift from the Northern Hemisphere to the Southern Hemisphere during the forecast period. With ongoing research and development efforts and advancements in omega-3 production technologies, the market is expected to expand further in the forecast period.

What Does This Report Include?

This section will provide insights into the contents included in this omega 3 market report and help gain clarity on the structure of the report to assist readers in navigating smoothly.

Omega 3 market qualitative analysis

  • Industry overview

  • Industry trends

  • Market drivers and restraints

  • Market size

  • Growth prospects

  • Porter’s analysis

  • PESTEL analysis

  • Key market opportunities prioritized

  • Competitive landscape

    • Company overview

    • Financial performance

    • Product benchmarking

    • Latest strategic developments

Omega 3 market quantitative analysis

  • Market size, estimates, and forecast from 2018 to 2030

  • Market estimates and forecast for product segments up to 2030

  • Regional market size and forecast for product segments up to 2030

  • Market estimates and forecast for application segments up to 2030

  • Regional market size and forecast for application segments up to 2030

  • Company financial performance

What questions do you have? Get quick response from our industry experts. Request a Free Consultation

Research Methodology

A three-pronged approach was followed for deducing the omega 3 market estimates and forecasts. The process has three steps: information procurement, analysis, and validation. The whole process is cyclical, and steps repeat until the estimates are validated. The three steps are explained in detail below:

Information procurement: Information procurement is one of the most extensive and important stages in our research process, and quality data is critical for accurate analysis. We followed a multi-channel data collection process for omega 3 market to gather the most reliable and current information possible.

  • We buy access to paid databases such as Hoover’s and Factiva for company financials, industry information, white papers, industry journals, SME journals, and more.
  • We tap into Grand View’s proprietary database of data points and insights from active and archived monitoring and reporting.
  • We conduct primary research with industry experts through questionnaires and one-on-one phone interviews.
  • We pull from reliable secondary sources such as white papers and government statistics, published by organizations like WHO, NGOs, World Bank, etc., Key Opinion Leaders (KoL) publications, company filings, investor documents, and more.
  • We purchase and review investor analyst reports, broker reports, academic commentary, government quotes, and wealth management publications for insightful third-party perspectives.

Analysis: We mine the data collected to establish baselines for forecasting, identify trends and opportunities, gain insight into consumer demographics and drivers, and so much more. We utilized different methods of omega 3 market data depending on the type of information we’re trying to uncover in our research.

  • Market Research Efforts: Bottom-up Approach for estimating and forecasting demand size and opportunity, top-down Approach for new product forecasting and penetration, and combined approach of both Bottom-up and Top-down for full coverage analysis.

  • Value-Chain-Based Sizing & Forecasting: Supply-side estimates for understanding potential revenue through competitive benchmarking, forecasting, and penetration modeling.

  • Demand-side estimates for identifying parent and ancillary markets, segment modeling, and heuristic forecasting.

  • Qualitative Functional Deployment (QFD) Modelling for market share assessment.

Market formulation and validation: We mine the data collected to establish baselines for forecasting, identify trends and opportunities, gain insight into consumer demographics and drivers, and so much more. We utilize different methods of data analysis depending on the type of information we’re trying to uncover in our research.

  • Market Formulation: This step involves the finalization of market numbers. This step on an internal level is designed to manage outputs from the Data Analysis step.

  • Data Normalization: The final market estimates and forecasts are then aligned and sent to industry experts, in-panel quality control managers for validation.

  • This step also entails the finalization of the report scope and data representation pattern.

  • Validation: The process entails multiple levels of validation. All these steps run in parallel, and the study is forwarded for publishing only if all three levels render validated results.

Omega 3 Market Categorization:

The omega 3 market was categorized into four segments, namely type (Docosahexaenoic acid, Eicosapentaenoic acid, Alpha-linolenic acid, Docosapentaenoic acid), source (Marine Source, Plant Source), application (Supplements & Functional Foods, Pharmaceuticals, Infant Formula, Animal Feed & Pet Food) and regions (North America, Europe, Asia Pacific, Central & South America, Middle East & Africa).

Segment Market Methodology:

The omega 3 market was segmented into type, source, application and regions. The demand at a segment level was deduced using a funnel method. Concepts like the TAM, SAM, SOM, etc., were put into practice to understand the demand. We at GVR deploy three methods to deduce market estimates and determine forecasts. These methods are explained below:

Market research approaches: Bottom-up

  • Demand estimation of each product across countries/regions summed up to from the total market.

  • Variable analysis for demand forecast.

  • Demand estimation via analyzing paid database, and company financials either via annual reports or paid database.

  • Primary interviews for data revalidation and insight collection.

Market research approaches: Top-down

  • Used extensively for new product forecasting or analyzing penetration levels.

  • Tool used invoice product flow and penetration models Use of regression multi-variant analysis for forecasting Involves extensive use of paid and public databases.

  • Primary interviews and vendor-based primary research for variable impact analysis.

Market research approaches: Combined

  • This is the most common method. We apply concepts from both the top-down and bottom-up approaches to arrive at a viable conclusion.

Regional Market Methodology:

The omega 3 market was analyzed at a regional level. The global was divided into North America, Europe, Asia Pacific, Central & South America, and Middle East & Africa, keeping in focus variables like consumption patterns, export-import regulations, consumer expectations, etc. These regions were further divided into nineteen countries, namely, the U.S.; Canada; Mexico; Germany; the UK.; France; Spain; Italy; Norway; The Netherlands; China; India; Japan; Australia; New Zealand; Brazil; Argentina; UAE, South Africa.

All three above-mentioned market research methodologies were applied to arrive at regional-level conclusions. The regions were then summed up to form the global market.

Omega 3 market companies & financials:

The omega 3 market was analyzed via companies operating in the sector. Analyzing these companies and cross-referencing them to the demand equation helped us validate our assumptions and conclusions. Key market players analyzed include:

  • Aker Biomarine Antarctic AS - Aker Biomarine Antarctic AS, a subsidiary of the Aker Group, specializes in supplying krill products abundant in omega-3 phospholipids. The company's krill harvesting vessels operate in the Antarctic and Saga Seas, while its tramper vessels are in La Manche. Aker Biomarine's krill products are renowned for their high eicosapentaenoic acid content, omega-3 fatty acids that are phospholipid-bound, and docosahexaenoic acid. The company has penetrated various markets worldwide, including pet food, aquaculture, and nutritional supplements. It maintains a presence in the United States, Uruguay, Australia, China, and Norway.

  • Orkla - Orkla, formerly known as Axellus, is engaged in the production of cod liver oil. In 1990, Möller joined forces with Orkla. Orkla Health operates four factories in Løren, Oslo; Ålesund; Ishøy, Denmark; and Leknes, Lofote. The company specializes in the manufacturing of cod liver oil and fish oils. Additionally, Orkla owns a range of food and health brands, including Möller's, Maxim, Nutrilett, CuraMed, and Collett.

  • BASF SE - BASF SE is a multinational company with five primary business divisions: chemicals, performance products, functional materials & solutions, agricultural solutions, and oil & gas. Within its performance products segment, BASF SE provides dispersion and pigments, care chemicals, nutrition and health, and performance chemicals in the form of vitamins and food additives to various industries, including pharmaceuticals, personal care and cosmetics, and hygienic and household products. Furthermore, BASF SE is publicly traded on prominent stock exchanges worldwide, including the Frankfurt Stock Exchange, London Stock Exchange, and SIX Swiss Exchange.

  • Omega Protein Corporation - Omega Protein Corporation offers a diverse range of products, encompassing fish oils, fish meals, fish soluble, cod liver oil, flaxseeds, krill oil, black currant seed oil, coconut oil, borage seed oil, evening primrose oil, hempseeds, dairy proteins, and nutraceuticals. Primarily catering to the human nutrition sector, the company's omega-3 product line finds application in cod liver oil, flaxseeds, and krill oil. With an impressive production capacity of approximately 17,000 tons of omega-3 products, Omega Protein Corporation operates across 17 locations spanning the United States, the United Kingdom, Italy, and the Netherlands. Furthermore, the company has established valuable partnerships with Russell 2000 and Peer Group.

  • GC Reiber Oils - GC Reiber Oils provides an extensive selection of items, encompassing salts, pelts, emergency foods, and omega-3 concentrates. Their omega-3 product line offers a diverse range, such as VivoMega High EPA, VivoMega Balanced, VivoMega High DHA, and VivoMega Customized. The company operates approximately nine production units strategically located across Europe, Asia Pacific, and North America.

  • Lonza - Lonza offers a range of services to the pharmaceutical industry, including product development, detection systems, and chemical synthesis capabilities for the biosciences sector. The company operates in two primary business segments: Pharma & Biotech and Specialty Ingredients. Lonza provides various products to various consumers, such as active pharmaceutical ingredients, drinking water sanitizers, industrial preservatives, and microbial control solutions. These consumers include manufacturers, distributors, service companies, and consumer and health products industry formulators. The company's services are utilized in multiple industries, including bioresearch, consumer care, water treatment, agro ingredients, pharma & biotech, and industrial solutions. Lonza caters to various applications, such as drug discovery, nutrition, hygiene and personal care, endotoxin detection, and transfection. Lonza offers a variety of products, including assay solutions, primary and stem cell protocols, cytosmart systems, bioprocess systems, high-performance materials, and specialties. The company has a global presence in the U.S., France, Spain, New Zealand, Switzerland, South Africa, Columbia, the Netherlands, Hungary, Argentina, Japan, Denmark, Brazil, and India.

  • Croda International Plc - Founded in 1925 and headquartered in Snaith, UK, Croda International Plc is a leading manufacturer of specialty chemicals. The company's wide range of products and services caters to various industries, including coating & polymers, personal care, health & crop care, geo technologies, industrial chemicals, lubricants, and polymer additives. Croda serves diverse specialties such as health & beauty, plastics, and engine lubricants. With three core sectors, namely personal care, life sciences (crop & healthcare, industrial chemicals), and performance technologies, the company offers three natural flavors of highly concentrated Omega-3 enriched with EPA and DHA ingredients that provide numerous health benefits. These Omega-3 products are available in convenient sachets and spoon servings, making them suitable for children and adults.

  • Epax - Epax, the renowned brand of concentrated omega-3 fatty acids, operates in various regions, including North America, South Korea, the Nordic regions, France, Spain, Germany, Austria, Switzerland, Italy, Japan, and Thailand. With a commitment to delivering high-quality EPA/DHA ingredients for Omega-3 products, Epax caters to both the nutraceutical and pharmaceutical sectors. As a subsidiary of the Pelagia Group, a global provider of pelagic fish products for human consumption, Epax ensures its offerings are distributed internationally as B2B dietary supplements. The growing prevalence of health-related concerns and modern lifestyles has significantly amplified the demand for omega-3 products worldwide. Epax focuses on three crucial elements in the omega-3 market: ALA (alphalinoleic acid), EPA (eicosapentaenoic acid), and DHA (docosahexaenoic acid), which are essential for overall well-being. By providing naturally occurring nutrients in the form of dietary supplements, Epax plays a vital role in promoting human health.

  • BioProcess Algae, LLC - BPA, also known as BioProcess Algae, LLC, serves various industries such as animal feed, nutraceuticals, fish feed, chemicals, and fuel. Its product portfolio includes animal feed, bioplastics, diesel ethanol, fertilizers, gasoline, jet fuel, nutritional supplements, sustainable chemicals, and numerous other everyday items. Operating on a significant commercial level, the company specializes in the development and construction of grower harvester bioreactors. These innovative systems facilitate the efficient conversion of CO2 and sunlight into valuable microbial biomass, which is then utilized for oil extraction in various markets.

  • DSM - DSM, a publicly traded company, has its stocks listed on Euronext Amsterdam N.V. DSM serves various industries, including food and beverage, dietary supplements, animal feed, personal care, automotive, medical devices, life protection, paints, alternative energy, electrical and electronics, and bio-based materials. Koninklijke DSM N.V. is renowned for its global presence in producing essential nutrients like carotenoids, vitamins, nutritional lipids, and other ingredients. Its products are supplied to industries such as animal feed, pharmaceuticals, food and beverage, and personal care. The company offers a diverse range of omega-3 products in its nutritional lipids segment, including life's DHA, life's Omega, and Omega-3 EPA/DHA. DSM has a widespread production network with approximately 115 manufacturing facilities spread across 49 countries in Africa, Asia, Oceania, and Europe.

Value chain-based sizing & forecasting

Supply Side Estimates

  • Company revenue estimation via referring to annual reports, investor presentations, and Hoover’s.

  • Segment revenue determination via variable analysis and penetration modeling.

  • Competitive benchmarking to identify market leaders and their collective revenue shares.

  • Forecasting via analyzing commercialization rates, pipelines, market initiatives, distribution networks, etc.

Demand side estimates

  • Identifying parent markets and ancillary markets

  • Segment penetration analysis to obtain pertinent

  • revenue/volume

  • Heuristic forecasting with the help of subject matter experts

  • Forecasting via variable analysis

Omega 3 Market Report Objectives:

  • Understanding market dynamics (in terms of drivers, restraints, & opportunities) in the countries.

  • Understanding trends & variables in the individual countries & their impact on growth and using analytical tools to provide high-level insights into the market dynamics and the associated growth pattern.

  • Understanding market estimates and forecasts (with the base year as 2023, historic information from 2018 to 2023, and forecast from 2024 to 2030). Regional estimates & forecasts for each category are available and are summed up to form the global market estimates.

Omega 3 Market Report Assumptions:

  • The report provides market value for the base year 2023 and a yearly forecast till 2030 in terms of revenue/volume or both. The market for each of the segment outlooks has been provided on region & country basis for the above-mentioned forecast period.

  • The key industry dynamics, major technological trends, and application markets are evaluated to understand their impact on the demand for the forecast period. The growth rates were estimated using correlation, regression, and time-series analysis.

  • We have used the bottom-up approach for market sizing, analyzing key regional markets, dynamics, & trends for various products and end-users. The total market has been estimated by integrating the country markets.

  • All market estimates and forecasts have been validated through primary interviews with the key industry participants.

  • Inflation has not been accounted for to estimate and forecast the market.

  • Numbers may not add up due to rounding off.

  • Europe consists of EU-8, Central & Eastern Europe, along with the Commonwealth of Independent States (CIS).

  • Asia Pacific includes South Asia, East Asia, Southeast Asia, and Oceania (Australia & New Zealand).

  • Latin America includes Central American countries and the South American continent

  • Middle East includes Western Asia (as assigned by the UN Statistics Division) and the African continent.

Primary Research

GVR strives to procure the latest and unique information for reports directly from industry experts, which gives it a competitive edge. Quality is of utmost importance to us, therefore every year we focus on increasing our experts’ panel. Primary interviews are one of the critical steps in identifying recent market trends and scenarios. This process enables us to justify and validate our market estimates and forecasts to our clients. With more than 8,000 reports in our database, we have connected with some key opinion leaders across various domains, including healthcare, technology, consumer goods, and the chemical sector. Our process starts with identifying the right platform for a particular type of report, i.e., emails, LinkedIn, seminars, or telephonic conversation, as every report is unique and requires a differentiated approach.

We send out questionnaires to different experts from various regions/ countries, which is dependent on the following factors:

  • Report/Market scope: If the market study is global, we send questionnaires to industry experts across various regions, including North America, Europe, Asia Pacific, Latin America, and MEA.

  • Market Penetration: If the market is driven by technological advancements, population density, disease prevalence, or other factors, we identify experts and send out questionnaires based on region or country dominance.

The time to start receiving responses from industry experts varies based on how niche or well-penetrated the market is. Our reports include a detailed chapter on the KoL opinion section, which helps our clients understand the perspective of experts already in the market space.

What questions do you have? Get quick response from our industry experts. Request a Free Consultation
pdf icn

GET A FREE SAMPLE

arrow icn

This FREE sample includes data points, ranging from trend analyses to estimates and forecasts. See for yourself.

gvr icn

NEED A CUSTOM REPORT?

We can customize every report - free of charge - including purchasing stand-alone sections or country-level reports, as well as offer affordable discounts for start-ups & universities. Contact us now

Certified Icon

We are GDPR and CCPA compliant! Your transaction & personal information is safe and secure. For more details, please read our privacy policy.