The global nuclear medicine market size was valued at USD 14.11 billion in 2023 and is projected to grow at a CAGR of 11.69% from 2024 to 2030. The market is witnessing growth due to the presence of a robust product pipeline and favorable government initiatives to improve access to nuclear medicine. Currently, betalutin, omburtamab, yttrium-90 microspheres, PNT2003, 177Lu‑PNT2002, are some of the products under clinical trials. The market has been moderately impacted due to SARS-CoV-2. The operation of reactors has been largely classified as an essential service, given its criticality. Therefore, nuclear reactors were not shut down during the SARS-CoV-2 lockdown. For instance, under Section 71 of the Labour Act 66 of 1995 in South Africa, its SAFARI-1 reactor remained operational during the lockdown enforced in the country post March 2020.
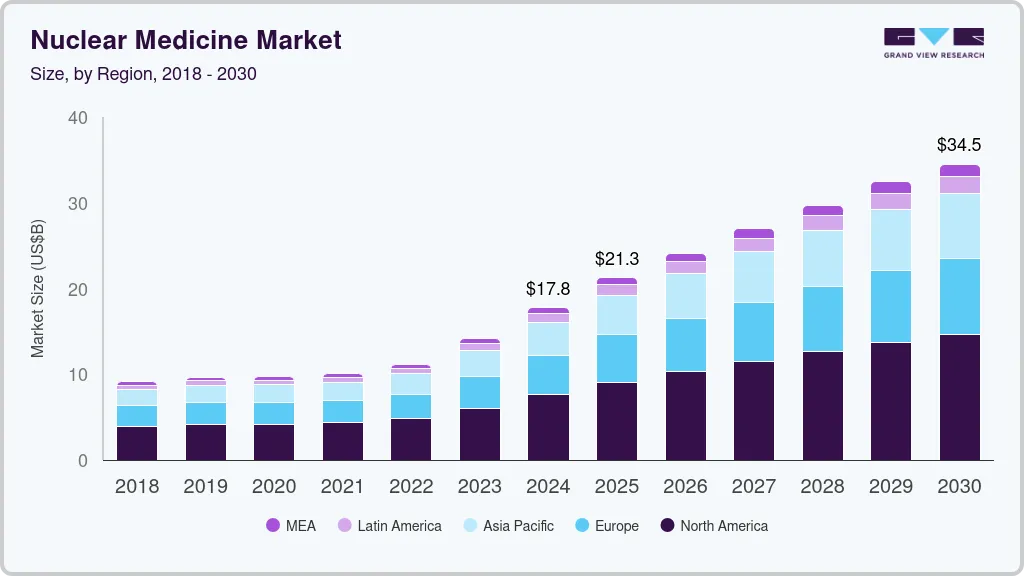
According to the World Health Organization (WHO), in 2022, there were an estimated 20 million new cancer cases and 9.7 million deaths worldwide. Additionally, 53.5 million people were reported to be alive within five years following a cancer diagnosis. Approximately 1 in 5 people develop cancer in their lifetime, with about 1 in 9 men and 1 in 12 women succumbing to the disease. Nuclear medicine plays a significant role in targeting specific cancer cells, delivering radiation directly to tumor site while sparing health tissues. This targeted approach reduces side effects and increases the effectiveness of treatment..
Furthermore, the presence of a robust product pipeline and favorable government initiatives to improve access to nuclear medicine. Currently, betalutin, yttrium-90 microspheres, PNT2003, 177Lu‑PNT2002, are some of the products under clinical trials. In December 2023, Lantheus Holdings, Inc. and POINT Biopharma Global Inc. (POINT) have announced the topline results from the pivotal Phase 3 SPLASH study. This study assessed the efficacy and safety of 177Lu-PNT2002, a PSMA-targeted radioligand therapy (RLT), in patients with metastatic castration-resistant prostate cancer (mCRPC) who have progressed following treatment with an androgen receptor pathway inhibitor (ARPI). Thus, growing investment in the field of research is anticipated to drive market growth.
The presence of a favorable reimbursement scenario for radiopharmaceuticals in the U.S., is anticipated to boost the market growth. In 2020, the Center for Medical Services (CMS) offered USD 10 add on payment for Tc-99m derived from non-highly enriched uranium (HEU) for hospital outpatient service in addition to payment for imaging procedures. The initiatives, in turn led to greater patient access for much needed diagnostic nuclear medicines used for life-threatening diseases.
Increasing advancements in the diagnosis and treatment of diseases, and approval of new nuclear-medicine-based devices helps in addressing patients treatment needs. For instance, in September 2021, GE Healthcare announced the launch of novel scanner with new automated workflow feature that offers an exceptional view of cardiac anatomy and pathology to help physicians to decide the right treatment for a patient.
Market growth stage is high, and pace of the market growth is accelerating. The radiopharmaceuticals is characterized by a high degree of innovation. This can be attributed to the advanced technologies and methodologies for transforming treatment practices. In the space, Novartis' milestone achievement with the FDA's approval for Pluvicto production at the Milburn facility in April 2023. This move is poised to shape the market landscape, reflecting a strategic response to the growing demand for advanced solutions. The space witnesses a notable M&A activities by the leading players. Leading players are strategically joining forces to expand and enhance their services, gain access to new technologies, consolidate in the rapidly growing market, and address the increasing strategic importance of nuclear medicine.
Level of M&A Activities: The level of merger and acquisition is moderate in market Leading players are strategically joining forces to expand and enhance their services, gain access to innovative technologies, consolidate in the rapidly growing market, and address the increasing strategic importance of nuclear medicine. In March 2023, Life Healthcare Group acquired TheraMed Nuclear’s non-clinical imaging business that include scanning services for the detection and treatment of diseases, such as cancer and organ dysfunction. This acquisition is expected to drive market growth.
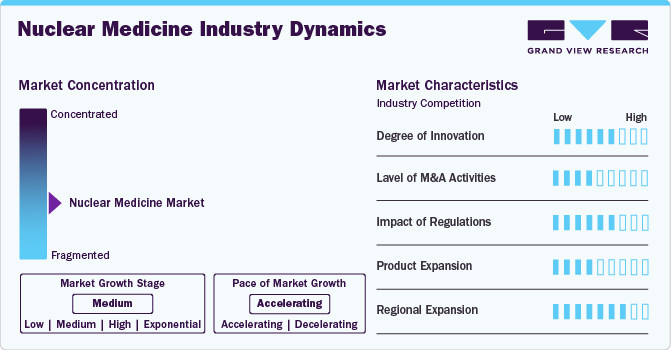
The market is also subject to increasing regulatory scrutiny. Rapid advancements in technology require continuous updates to regulatory frameworks to address new challenges and opportunities. Title 21 from the Code of Federal Regulations governs the use of radiopharmaceuticals in the U.S. The diagnostics and therapeutic applications of radiopharmaceuticals are covered separately under this title in Part 315 & Part 361, respectively. In addition, the Nuclear Regulatory Commission (NRC) regulates the use of radiopharmaceuticals in 37 states. The NRC authorizes the utilization and possession of radioactive source material, byproduct, and special nuclear material. The Center for Devices and Radiology Health (CDRH) governs the use of radiopharmaceuticals and the use of electron-emitting products, including medical devices.
Nuclear medicine methods are more accurate than traditional diagnostic and treatment methods. However, higher price of radiopharmaceuticals is increasing the chances of usage of substitute products. Thus, the threat of substitution is expected to be moderate during the forecast period. Traditional chemotherapy agents and radiation therapy can be used, as these are comparatively cheaper substitutes for radiopharmaceuticals.
Increasing access to healthcare services and the establishment of specialized medical facilities are driving market growth in this region. Developing regions are experiencing rapid growth in the nuclear medicine market due to increasing healthcare expenditure, rising prevalence of cancer, and growing awareness.
The diagnostics segment dominated the nuclear medicine market and accounted for 76.33% of share in 2023 and is anticipated to grow significantly over the forecast period. The presence of a large patient base and availability of advanced technologies such as Single-Photon Emission Computed Tomography (SPECT) and Positron Emission Tomography (PET). According to the World Nuclear Association Analysis 2024, about 50 million nuclear medicine procedures are performed annually and the demand for radioisotopes increases by around 5% every year. A wide range of radiotracers that are currently employed in diagnosis of tumors coupled with technological advancements are contributing to the growth of the segment.
The therapeutic segment is further divide into alpha emitters, beta emitters, and brachytherapy. The robust product pipeline coupled with the approval and commercialization of nuclear medicine therapeutics may fuel the segment growth. For instance, in October 2021, the U.S. FDA approved and granted breakthrough designation to diffusing alpha-emitters Radiation Therapy (DaRT) for the treatment of patients suffering from recurrent glioblastoma multiforme (GBM). It is a standalone therapy when other therapies have failed to work in patients with GBM. Currently, radium (Ra-223) is the most widely used alpha emitter in therapeutics. Development of potential radioisotopes, such as Terbium (Tb-149), Bismuth (Bi-212), and Actinium (Ac-225) is expected to augment market growth.
Urology segment dominated the market with a market share of 21.68% in 2023 and is anticipated to grow at the fastest growth over the forecast period. This can be attributed to increasing prevalence of urological diseases like prostate cancer and high demand for novel products for diagnosis and treatment. According to the World Cancer Research Fund International, in 2022, there were around 1,467,854 new cases of prostate cancer reported worldwide. It is the second most cancer diagnosed in men. Globally, countries like U.S., China, Japan, Brazil, Germany, France, UK, Russia, Italy, and India reported highest cases of prostate cancer due to rising men population and changed lifestyle of people.
Endocrine tumors segment is estimated to grow at a significant CAGR over the forecast period. The competitive landscape is influenced by strategic initiatives of key players. For instance, recent collaboration between Jubilant Draximage Inc. (Jubilant Radiopharma) and Evergreen Theragnostics, Inc. in June 2023. Jubilant Radiopharma, with its Radiopharmacy business division holding one of the largest nuclear medicine pharmacy networks in the U.S., entered into an agreement with Evergreen Theragnostics. This agreement focuses on Jubilant’s radiopharmacy business preparing, selling, and distributing doses of OCTEVY, a diagnostic agent pending FDA approval for PET imaging of somatostatin receptor-positive neuroendocrine tumors (NETs).
The hospitals segment held a considerable market share of 55% in 2023. Most of the therapeutic nuclear medicine procedures are conducted in hospitals. According to The Society of Nuclear Medicine & Nuclear Imaging, in 2023, around 20 million nuclear medicine procedures performed annually in the U.S. The recent approval of multiple therapeutic radioisotopes such as Pluvicto, Lutathera, and others are expected to boost adoption these Products in hospitals and driving segment growth.
The hospitals segment is expected to grow at a significant CAGR during the forecast period. Most of the therapeutic nuclear medicine procedures are conducted in hospitals. The recent approval of multiple therapeutic radioisotopes such as Pluvicto, Lutathera and several other products in pipeline such as Lu 177 PSMA I&T and Lu 177 edotreotide are expected to drive the segment.
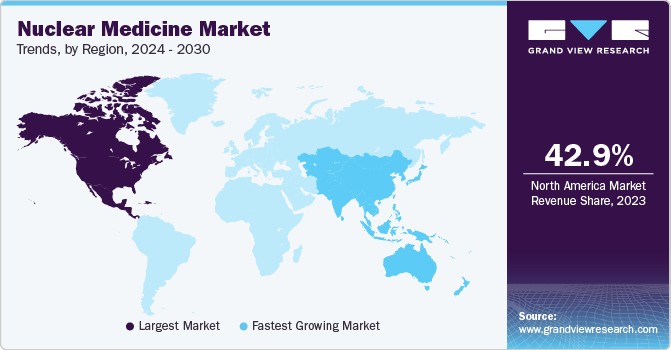
North America nuclear medicine market accounted for 42.96% share in 2023. The region's sustained dominance is driven by rapid adoption of advanced imaging technologies and the increased use of innovative therapeutic radiopharmaceuticals. Furthermore, the rising prevalence of various cancers and chronic conditions is expected to significantly boost market growth in North America during the forecast period.
U.S. nuclear medicine market dominated the North America market in 2023 owing to increasing prevalence of cardiac patients and the widespread adoption of precise imaging technologies enabled by diagnostic equipment such as PET and SPECT. However, market expansion faces obstacles such as supply chain limitations, logistical challenges, and a shortage of skilled medical personnel.
Europe nuclear medicine market was identified as a lucrative region in this industry. The growth of the market in the region can be attributed to the increasing number of hospitals and clinics which has led to high demand for products, driven by a rise in patient visits for disease diagnosis and treatment.
The nuclear medicine market in UK is expected to grow over the forecast period due to the technological advancements in nuclear imaging techniques such as PET (Positron Emission Tomography) and SPECT (Single Photon Emission Computed Tomography) are increasing the diagnostic capabilities and accuracy of nuclear medicine procedures in UK.
The nuclear medicine market Germany dominated the Europe market in 2023. This can be attributed to the increasing prevalence of chronic diseases like cancer, cardiovascular disorders, and neurological conditions underscores the growing necessity for nuclear medicine in both diagnostic procedures and therapeutic interventions.
The nuclear medicine market in France is anticipated to grow during the forecast period. This can be attributed to supportive governmental healthcare policies and investments in medical infrastructure are pivotal in fostering the expansion of nuclear medicine services throughout France. In July 2022, Framatome acquired a minority share in Global Morpho Pharma, enhancing its involvement in product development. This move expands Framatome's support for the supply chain of Lutetium-177 and other promising isotopes used in therapeutic applications.
Asia Pacific nuclear medicine market is anticipated to witness the fastest growth over the coming years. Increased awareness about nuclear medicine therapies and rising investment in the market space. For instance, in March 2022, Penang Adventist Hospital (PAH) announced the launch of private nuclear medicine center in northern part of Thailand. This launch is anticipated to have positive impact on the Asian Market.
The nuclear medicine market in China is expected to witness significant growth over the forecast period. In China, dementia stands out as a prominent chronic disease that can be diagnosed using nuclear imaging techniques. The prevalence of dementia among elderly populations in cities such as Xiamen underscores the substantial demand for nuclear imaging services aimed at diagnosing and treating this condition.
The nuclear medicine market in Japan held a considerable revenue share in 2023. The rising incidence of coronary heart disease (CHD) in urban areas underscores the demand for advanced diagnostic technologies provided by nuclear medicine. Furthermore, the significant prevalence of end-stage kidney failure (ESKF) in Japan, frequently associated with diabetes and hypertension, emphasizes the critical role of nuclear imaging in the management of these conditions.
Latin America nuclear medicine market was identified as a lucrative region in this industry. This can be attributed to recent product launches and technological advancements, such as single-photon emission computed tomography (SPECT) and positron emission tomography (PET), significantly enhancing the capabilities of nuclear medicine. These innovations provide enhanced diagnostic accuracy and treatment options for a wide range of diseases, including cancers and chronic conditions such as hyperthyroidism and blood disorders.
The nuclear medicine market in Brazil dominated the Latin America market. Brazil's substantial socioeconomic disparities contribute to unequal access to nuclear medicine services. The country's vast geographic expanse further complicates the delivery of radiopharmaceuticals and nuclear medicine services, underscoring the imperative to expand access, particularly for marginalized populations.
MEA Nuclear Medicine market was identified as a lucrative region in this industry. Governments in the MEA region is strategically investing in research and development initiatives aimed at advancing existing product. This includes enhancing existing Products and developing new ones, which collectively drive growth in the nuclear medicine market.
The nuclear medicine market in Saudi Arabia is projected to grow fastest over the forecast period. Nuclear medicine plays a crucial role in oncology for diagnostic imaging and radiation therapy purposes in Saudi Arabia. Their application in cardiology, neurology, and endocrinology offers critical insights into organ and system functionality.
Some of the key players operating in the industry are Eckert & Ziegler; Mallinckrodt; GE Healthcare; Nordion (Canada), Inc.; NTP Radioisotopes SOC Ltd. The leading players in radiation oncology industry are focusing on growth strategies, such as innovations with radiotherapy, product launches, and R&D investments.
Telix Pharmaceuticals, Inc.; Nordic Nanovector; Y-mAbs Therapeutics, Inc.are some of the emerging market participants in the radiation oncology space. Emerging companies are employing various strategies such as mergers & acquisitions to expand their footprint and grow at a fast pace
The following are the leading companies in the nuclear medicine market. These companies collectively hold the largest market share and dictate industry trends.
In January 2024, Lantheus Holdings, Inc. (Lantheus) recently solidified its position in the U.S. nuclear medicine market through strategic agreements with Perspective Therapeutics, Inc. The agreements include an exclusive licensing option for Perspective's Pb212-VMT-⍺-NET, an advanced therapy for neuroendocrine tumors, and co-development opportunities for early-stage prostate cancer treatments. Lantheus made a substantial upfront payment of USD 28 million in cash. Additionally, Lantheus plans to acquire up to 19.9% of Perspective's common stock, investing approximately $33 million, pending a qualified third-party financing transaction. In a reciprocal move, Perspective aims to purchase Lantheus' radiopharmaceutical manufacturing facility in Somerset, New Jersey, enhancing its foothold in the competitive landscape.
In March 2024, the Ministry of Health of the Republic of Serbia and Rosatom State Corporation signed a Memorandum of Understanding (MoU) regarding cooperation in nuclear medicine. This cooperation is expected to boost market growth over the forecast period.
In December 2023, Bristol Myers Squibb has entered into an agreement to acquire RayzeBio for USD 4.1 billion. RayzeBio is currently conducting clinical trials for two potential cancer therapies using actinium-255. In addition, Point, a company associated with RayzeBio, has two lutetium-177 therapies undergoing phase 3 trials. This acquisition reflects Bristol Myers Squibb's strategic move to expand its portfolio.
In April 2023, the U.S. FDA approved Novartis’ Milburn facility for the commercial production of Pluvicto. The facility is anticipated to boost the company’s production capabilities.
In January 2023, NorthStar Medical Radioisotopes notably progressed its technology to produce molybdenum-99 without uranium. This strategic move positions the company at the forefront of the nuclear medicine market, addressing critical supply chain issues.
Report Attribute |
Details |
Market size value in 2024 |
USD 17.77 billion |
Revenue forecast in 2030 |
USD 34.51 billion |
Growth Rate |
CAGR of 11.69% from 2024 to 2030 |
Actual data |
2018 - 2023 |
Forecast period |
2024 - 2030 |
Quantitative units |
Revenue in USD million/billion, and CAGR from 2024 to 2030 |
Report coverage |
Revenue forecast, company ranking, competitive landscape, growth factors, and trends |
Segments covered |
Product, Application, End-use, region |
Regional scope |
North America, Europe, Asia Pacific, Latin America, Middle East & Africa |
Country scope |
U.S., Canada, Mexico, UK, Germany, France, Italy, Spain, Denmark, Sweden, Norway, China, Japan, India, South Korea, Australia, Brazil, Argentina, South Africa, UAE, Saudi Arabia, Kuwait |
Key companies profiled |
Eckert & Ziegler; Mallinckrodt; GE Healthcare; Jubilant Life Sciences Ltd.; Nordion (Canada), Inc.; Bracco Imaging S.P.A.; IRE, the Australian Nuclear Science and Technology Organization; NTP Radioisotopes SOC Ltd.; Eczacıbaşı-Monrol; Lantheus Medical Imaging, Inc.; Cardinal Health. |
Customization scope |
Free report customization (equivalent up to 8 analysts working days) with purchase. Addition or alteration to country, regional & segment scope. |
Pricing and purchase options |
Avail customized purchase options to meet your exact research needs. Explore purchase options |
This report forecasts revenue growth at global, regional, and country levels and provides an analysis of the latest industry trends in each of the sub-segments from 2018 to 2030. For this study, Grand View Research has segmented the global Nuclear Medicine market report based on product, application, end-use, and region.
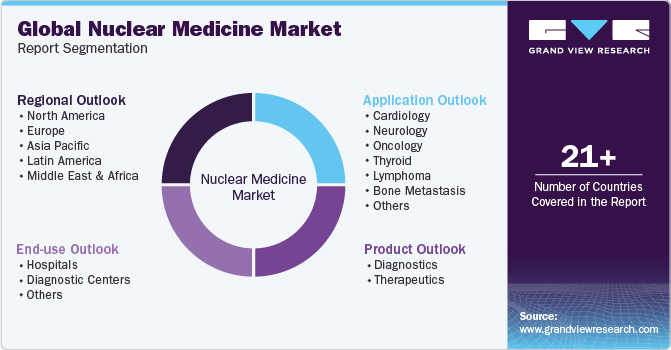
Product Outlook (Revenue, USD Million, 2018 - 2030)
Diagnostics
SPECT
TC-99m
TL-201
GA-67
I-123
Others
PET
F-18
SR-82/RB-82
PYLARIFY (piflufolastat F 18)
Illuccix (gallium Ga 68 gozetotide)
Others
Therapeutics
Alpha Emitters
RA-223
Others
Beta Emitters
I-131
Y-90
SM-153
Re-186
Lu-177
Others
Brachytherapy
Cesium-131
Iodine-125
Palladium-103
Iridium-192
Others
Application Outlook (Revenue, USD Million, 2018 - 2030)
Cardiology
SPECT
PET
Therapeutic Applications
Neurology
Oncology
Thyroid
SPECT
Therapeutic Applications
Lymphoma
Bone Metastasis
SPECT
Therapeutic Applications
Endocrine Tumor
Pulmonary Scans
Urology
Other
End-use Outlook (Revenue, USD Million, 2018 - 2030)
Hospitals
Diagnostic Centers
Others
Regional Outlook (Revenue, USD Million, 2018 - 2030)
North America
U.S.
Canada
Mexico
Europe
Germany
U.K.
France
Italy
Spain
Denmark
Sweden
Norway
Asia Pacific
China
Japan
India
South Korea
Australia
Thailand
Latin America
Brazil
Argentina
Middle East and Africa (MEA)
South Africa
Saudi Arabia
Kuwait
UAE
b. The nuclear medicine market size was valued at USD 14.11 billion in 2023 and is anticipated to reach USD 17.77 billion in 2024.
b. The global nuclear medicine market is expected to witness a compound annual growth rate of 11.69% from 2024 to 2030 to reach USD 34.51 billion by 2030.
b. Based on product, the diagnostics segment accounted for a share of 76.33% in 2023 due to the large target disease population, and availability of SPECT and PET imaging systems.
b. Some of the key players in nuclear medicine market are GE Healthcare; Jubilant Life Sciences Ltd; Nordion (Canada), Inc.; Bracco Imaging S.P.A; The institute for radioelements (IRE); NTP Radioisotopes SOC Ltd.; The Australian Nuclear Science and Technology Organization; Lantheus Medical Imaging, Inc.; Eckert & Ziegler; Mallinckrodt; and Cardinal Health amongst others.
b. The major factors driving the nuclear medicine market growth are the increasing prevalence of target diseases, increasing approval of radiotherapeutic drugs, and growing demand for accurate diagnostic methods.
Table of Contents
Chapter 1. Methodology and Scope
1.1. Market Segmentation & Scope
1.2. Segment Definitions
1.2.1. Product
1.2.2. Application
1.2.3. End Use
1.2.4. Regional scope
1.2.5. Estimates and forecasts timeline
1.3. Research Methodology
1.4. Information Procurement
1.4.1. Purchased database
1.4.2. GVR’s internal database
1.4.3. Secondary sources
1.4.4. Primary research
1.4.5. Details of primary research
1.4.5.1. Data for primary interviews in North America
1.4.5.2. Data for primary interviews in Europe
1.4.5.3. Data for primary interviews in Asia Pacific
1.4.5.4. Data for primary interviews in Latin America
1.4.5.5. Data for Primary interviews in MEA
1.5. Information or Data Analysis
1.5.1. Data analysis models
1.6. Market Formulation & Validation
1.7. Model Details
1.7.1. Commodity flow analysis (Model 1)
1.7.2. Approach 1: Commodity flow approach
1.7.3. Volume price analysis (Model 2)
1.7.4. Approach 2: Volume price analysis
1.8. List of Secondary Sources
1.9. List of Primary Sources
1.10. Objectives
Chapter 2. Executive Summary
2.1. Market Outlook
2.2. Segment Outlook
2.2.1. Product and Application outlook
2.2.2. End Use outlook
2.2.3. Regional outlook
2.3. Competitive Insights
Chapter 3. Nuclear Medicine Market Variables, Trends & Scope
3.1. Market Lineage Outlook
3.1.1. Parent market outlook
3.1.2. Related/ancillary market outlook
3.2. Market Dynamics
3.2.1. Market driver analysis
3.2.1.1. Rising incidence of cancer and cardiovascular diseases
3.2.1.2. Increasing application of radiopharmaceuticals/nuclear medicine
3.2.1.3. Growing demand for accurate diagnostic methods
3.2.2. Market restraint analysis
3.2.2.1. High cost of treatment
3.2.2.2. Stringent regulations pertaining to production, storage, & usage
3.3. Nuclear Medicine Market Analysis Tools
3.3.1. Industry Analysis - Porter’s
3.3.1.1. Supplier power
3.3.1.2. Buyer power
3.3.1.3. Substitution threat
3.3.1.4. Threat of new entrant
3.3.1.5. Competitive rivalry
3.3.2. PESTEL Analysis
3.3.2.1. Political landscape
3.3.2.2. Technological landscape
3.3.2.3. Economic landscape
3.3.3. Pipeline Analysis
Chapter 4. Nuclear Medicine Market: Product Estimates & Trend Analysis
4.1. Global Nuclear Medicine Market: Product Dashboard
4.2. Global Nuclear Medicine Market: Product Movement Analysis
4.3. Global Nuclear Medicine Market By Product, Revenue
4.4. Diagnostics
4.4.1. Diagnostics market estimates and forecasts 2018 to 2030 (USD Million)
4.4.2. SPECT
4.4.2.1. SPECT market estimates and forecasts 2018 to 2030 (USD Million)
4.4.2.2. TC-99m
4.4.2.2.1. TC-99m market estimates and forecasts 2018 to 2030 (USD Million)
4.4.2.3. TL-201
4.4.2.3.1. TL-201 market estimates and forecasts 2018 to 2030 (USD Million)
4.4.2.4. GA-67
4.4.2.4.1. GA-67 markets estimates and forecasts 2018 to 2030 (USD Million)
4.4.2.5. I-123
4.4.2.5.1. I-123 market estimates and forecasts 2018 to 2030 (USD Million)
4.4.2.6. Others
4.4.2.6.1. Others market estimates and forecasts 2018 to 2030 (USD Million)
4.4.3. PET
4.4.3.1. PET market estimates and forecasts 2018 to 2030 (USD Million)
4.4.3.2. F18
4.4.3.2.1. F18 market estimates and forecasts 2018 to 2030 (USD Million)
4.4.3.3. SR-82/RB-82
4.4.3.3.1. SR-82/RB-82 market estimates and forecasts 2018 to 2030 (USD Million)
4.4.3.4. PYLARIFY (piflufolastat F 18)
4.4.3.4.1. PYLARIFY (piflufolastat F 18) markets estimates and forecasts 2018 to 2030 (USD Million)
4.4.3.5. Illuccix (gallium Ga 68 gozetotide)
4.4.3.5.1. Illuccix (gallium Ga 68 gozetotide)s market estimates and forecasts 2018 to 2030 (USD Million)
4.4.3.6. Others
4.4.3.6.1. Others market estimates and forecasts 2018 to 2030 (USD Million)
4.5. Therapeutics
4.5.1. Therapeutics market estimates and forecasts 2018 to 2030 (USD Million)
4.5.2. Alpha Emitters
4.5.2.1. Alpha emitters market estimates and forecasts 2018 to 2030 (USD Million)
4.5.2.2. RA-223
4.5.2.2.1. RA-223 market estimates and forecasts 2018 to 2030 (USD Million)
4.5.2.3. Others
4.5.2.3.1. Others market estimates and forecasts 2018 to 2030 (USD Million)
4.5.3. Beta Emitters
4.5.3.1. Beta emitters market estimates and forecasts 2018 to 2030 (USD Million)
4.5.3.2. I-131
4.5.3.2.1. I-131 market estimates and forecasts 2018 to 2030 (USD Million)
4.5.3.3. Y-90
4.5.3.3.1. Y-90 market estimates and forecasts 2018 to 2030 (USD Million)
4.5.3.4. SM-153
4.5.3.4.1. SM-153 markets estimates and forecasts 2018 to 2030 (USD Million)
4.5.3.5. Re-186
4.5.3.5.1. Re-186 market estimates and forecasts 2018 to 2030 (USD Million)
4.5.3.6. Lu-177
4.5.3.6.1. Lu-177 market estimates and forecasts 2018 to 2030 (USD Million)
4.5.3.7. Others
4.5.3.7.1. Others market estimates and forecasts 2018 to 2030 (USD Million)
4.5.4. Brachytherapy
4.5.4.1. Brachytherapy market estimates and forecasts 2018 to 2030 (USD Million)
4.5.4.2. Cesium-131
4.5.4.2.1. Cesium-131 market estimates and forecasts 2018 to 2030 (USD Million)
4.5.4.3. Iodine-125
4.5.4.3.1. Iodine-125 market estimates and forecasts 2018 to 2030 (USD Million)
4.5.4.4. Palladium-103
4.5.4.4.1. Palladium-103 markets estimates and forecasts 2018 to 2030 (USD Million)
4.5.4.5. Iridium-192
4.5.4.5.1. Iridium-192 market estimates and forecasts 2018 to 2030 (USD Million)
4.5.4.6. Others
4.5.4.6.1. Others market estimates and forecasts 2018 to 2030 (USD Million)
Chapter 5. Nuclear Medicine Market: Application Estimates & Trend Analysis
5.1. Global Nuclear Medicine Market: Application Dashboard
5.2. Global Nuclear Medicine Market: Application Movement Analysis
5.3. Global Nuclear Medicine Market Estimates and Forecasts, By Application, Revenue (USD Million)
5.4. Cardiology
5.4.1. Cardiology market estimates and forecasts 2018 to 2030 (USD Million)
5.4.2. SPECT
5.4.2.1. SPECT market estimates and forecasts 2018 to 2030 (USD Million)
5.4.3. PET
5.4.3.1. PET market estimates and forecasts 2018 to 2030 (USD Million)
5.4.4. Therapeutic Applications
5.4.4.1. Therapeutic applications market estimates and forecasts 2018 to 2030 (USD Million)
5.5. Neurology
5.5.1. Neurology market estimates and forecasts 2018 to 2030 (USD Million)
5.6. Oncology
5.6.1. Oncology market estimates and forecasts 2018 to 2030 (USD Million)
5.7. Thyroid
5.7.1. Thyroid market estimates and forecasts 2018 to 2030 (USD Million)
5.7.2. SPECT
5.7.2.1. SPECT market estimates and forecasts 2018 to 2030 (USD Million)
5.7.3. Therapeutic Applications
5.7.3.1. Therapeutic applications market estimates and forecasts 2018 to 2030 (USD Million)
5.8. Lymphoma
5.8.1. Lymphoma market estimates and forecasts 2018 to 2030 (USD Million)
5.9. Bone Metastasis
5.9.1. Bone metastasis market estimates and forecasts 2018 to 2030 (USD Million)
5.9.2. SPECT
5.9.2.1. SPECT market estimates and forecasts 2018 to 2030 (USD Million)
5.9.3. Therapeutic Applications
5.9.3.1. Therapeutic applications market estimates and forecasts 2018 to 2030 (USD Million)
5.10. Endocrine Tumor
5.10.1. Endocrine tumor market estimates and forecasts 2018 to 2030 (USD Million)
5.11. Pulmonary Scans
5.11.1. Pulmonary scans market estimates and forecasts 2018 to 2030 (USD Million)
5.12. Urology
5.12.1. Urology market estimates and forecasts 2018 to 2030 (USD Million)
5.13. Others
5.13.1. Others market estimates and forecasts 2018 to 2030 (USD Million)
Chapter 6. Nuclear Medicine Market: End Use Estimates & Trend Analysis
6.1. Global Nuclear Medicine Market: End Use Dashboard
6.2. Global Nuclear Medicine Market: End Use Movement Analysis
6.3. Global Nuclear Medicine Market Estimates and Forecasts, by End Use, Revenue (USD Million)
6.4. Hospitals
6.4.1. Hospitals market estimates and forecasts 2018 to 2030 (USD Million)
6.5. Diagnostic Centers
6.5.1. Diagnostic centers market estimates and forecasts 2018 to 2030 (USD Million)
6.6. Others
6.6.1. Others market estimates and forecasts 2018 to 2030 (USD Million)
Chapter 7. Nuclear Medicine Market: Regional Estimates & Trend Analysis By Product, Application, and End Use
7.1. Regional Dashboard
7.2. Market Size, & Forecasts Trend Analysis, 2018 to 2030:
7.3. North America
7.3.1. U.S.
7.3.1.1. Key country dynamics
7.3.1.2. Regulatory framework/ reimbursement structure
7.3.1.3. Competitive scenario
7.3.1.4. U.S. market estimates and forecasts 2018 to 2030 (USD Million)
7.3.2. Canada
7.3.2.1. Key country dynamics
7.3.2.2. Regulatory framework/ reimbursement structure
7.3.2.3. Competitive scenario
7.3.2.4. Canada market estimates and forecasts 2018 to 2030 (USD Million)
7.3.3. Mexico
7.3.3.1. Key country dynamics
7.3.3.2. Regulatory framework/ reimbursement structure
7.3.3.3. Competitive scenario
7.3.3.4. Mexico market estimates and forecasts 2018 to 2030 (USD Million)
7.4. Europe
7.4.1. UK
7.4.1.1. Key country dynamics
7.4.1.2. Regulatory framework/ reimbursement structure
7.4.1.3. Competitive scenario
7.4.1.4. UK market estimates and forecasts 2018 to 2030 (USD Million)
7.4.2. Germany
7.4.2.1. Key country dynamics
7.4.2.2. Regulatory framework/ reimbursement structure
7.4.2.3. Competitive scenario
7.4.2.4. Germany market estimates and forecasts 2018 to 2030 (USD Million)
7.4.3. France
7.4.3.1. Key country dynamics
7.4.3.2. Regulatory framework/ reimbursement structure
7.4.3.3. Competitive scenario
7.4.3.4. France market estimates and forecasts 2018 to 2030 (USD Million)
7.4.4. Italy
7.4.4.1. Key country dynamics
7.4.4.2. Regulatory framework/ reimbursement structure
7.4.4.3. Competitive scenario
7.4.4.4. Italy market estimates and forecasts 2018 to 2030 (USD Million)
7.4.5. Spain
7.4.5.1. Key country dynamics
7.4.5.2. Regulatory framework/ reimbursement structure
7.4.5.3. Competitive scenario
7.4.5.4. Spain market estimates and forecasts 2018 to 2030 (USD Million)
7.4.6. Norway
7.4.6.1. Key country dynamics
7.4.6.2. Regulatory framework/ reimbursement structure
7.4.6.3. Competitive scenario
7.4.6.4. Norway market estimates and forecasts 2018 to 2030 (USD Million)
7.4.7. Sweden
7.4.7.1. Key country dynamics
7.4.7.2. Regulatory framework/ reimbursement structure
7.4.7.3. Competitive scenario
7.4.7.4. Sweden market estimates and forecasts 2018 to 2030 (USD Million)
7.4.8. Denmark
7.4.8.1. Key country dynamics
7.4.8.2. Regulatory framework/ reimbursement structure
7.4.8.3. Competitive scenario
7.4.8.4. Denmark market estimates and forecasts 2018 to 2030 (USD Million)
7.5. Asia Pacific
7.5.1. Japan
7.5.1.1. Key country dynamics
7.5.1.2. Regulatory framework/ reimbursement structure
7.5.1.3. Competitive scenario
7.5.1.4. Japan market estimates and forecasts 2018 to 2030 (USD Million)
7.5.2. China
7.5.2.1. Key country dynamics
7.5.2.2. Regulatory framework/ reimbursement structure
7.5.2.3. Competitive scenario
7.5.2.4. China market estimates and forecasts 2018 to 2030 (USD Million)
7.5.3. India
7.5.3.1. Key country dynamics
7.5.3.2. Regulatory framework/ reimbursement structure
7.5.3.3. Competitive scenario
7.5.3.4. India market estimates and forecasts 2018 to 2030 (USD Million)
7.5.4. Australia
7.5.4.1. Key country dynamics
7.5.4.2. Regulatory framework/ reimbursement structure
7.5.4.3. Competitive scenario
7.5.4.4. Australia market estimates and forecasts 2018 to 2030 (USD Million)
7.5.5. South Korea
7.5.5.1. Key country dynamics
7.5.5.2. Regulatory framework/ reimbursement structure
7.5.5.3. Competitive scenario
7.5.5.4. South Korea market estimates and forecasts 2018 to 2030 (USD Million)
7.5.6. Thailand
7.5.6.1. Key country dynamics
7.5.6.2. Regulatory framework/ reimbursement structure
7.5.6.3. Competitive scenario
7.5.6.4. Thailand market estimates and forecasts 2018 to 2030 (USD Million)
7.6. Latin America
7.6.1. Brazil
7.6.1.1. Key country dynamics
7.6.1.2. Regulatory framework/ reimbursement structure
7.6.1.3. Competitive scenario
7.6.1.4. Brazil market estimates and forecasts 2018 to 2030 (USD Million)
7.6.2. Argentina
7.6.2.1. Key country dynamics
7.6.2.2. Regulatory framework/ reimbursement structure
7.6.2.3. Competitive scenario
7.6.2.4. Argentina market estimates and forecasts 2018 to 2030 (USD Million)
7.7. MEA
7.7.1. South Africa
7.7.1.1. Key country dynamics
7.7.1.2. Regulatory framework/ reimbursement structure
7.7.1.3. Competitive scenario
7.7.1.4. South Africa market estimates and forecasts 2018 to 2030 (USD Million)
7.7.2. Saudi Arabia
7.7.2.1. Key country dynamics
7.7.2.2. Regulatory framework/ reimbursement structure
7.7.2.3. Competitive scenario
7.7.2.4. Saudi Arabia market estimates and forecasts 2018 to 2030 (USD Million)
7.7.3. UAE
7.7.3.1. Key country dynamics
7.7.3.2. Regulatory framework/ reimbursement structure
7.7.3.3. Competitive scenario
7.7.3.4. UAE market estimates and forecasts 2018 to 2030 (USD Million)
7.7.4. Kuwait
7.7.4.1. Key country dynamics
7.7.4.2. Regulatory framework/ reimbursement structure
7.7.4.3. Competitive scenario
7.7.4.4. Kuwait market estimates and forecasts 2018 to 2030 (USD Million)
Chapter 8. Competitive Landscape
8.1. Recent Developments & Impact Analysis, By Key Market Participants
8.2. Company/Competition Categorization
8.3. Vendor Landscape
8.3.1. List of key distributors and channel partners
8.3.2. Key customers
8.3.3. Key company market share analysis, 2023
8.3.4. GE Healthcare.
8.3.4.1. Company overview
8.3.4.2. Financial performance
8.3.4.3. Product benchmarking
8.3.4.4. Strategic initiatives
8.3.5. Jubilant Life Sciences Ltd
8.3.5.1. Company overview
8.3.5.2. Financial performance
8.3.5.3. Product benchmarking
8.3.5.4. Strategic initiatives
8.3.6. Nordion (Canada), Inc.
8.3.6.1. Company overview
8.3.6.2. Financial performance
8.3.6.3. Product benchmarking
8.3.6.4. Strategic initiatives
8.3.7. Bracco Imaging S.P.A
8.3.7.1. Company overview
8.3.7.2. Financial performance
8.3.7.3. Product benchmarking
8.3.7.4. Strategic initiatives
8.3.8. The Institute for Radioelements (IRE)
8.3.8.1. Company overview
8.3.8.2. Financial performance
8.3.8.3. Product benchmarking
8.3.8.4. Strategic initiatives
8.3.9. NTP Radioisotopes SOC Ltd.
8.3.9.1. Company overview
8.3.9.2. Financial performance
8.3.9.3. Product benchmarking
8.3.9.4. Strategic initiatives
8.3.10. The Australian Nuclear Science and Technology Organization
8.3.10.1. Company overview
8.3.10.2. Financial performance
8.3.10.3. Product benchmarking
8.3.10.4. Strategic initiatives
8.3.11. Eczacıbaşı-Monrol
8.3.11.1. Company overview
8.3.11.2. Financial performance
8.3.11.3. Product benchmarking
8.3.11.4. Strategic initiatives
8.3.12. Lantheus Medical Imaging, Inc.
8.3.12.1. Company overview
8.3.12.2. Financial performance
8.3.12.3. Product benchmarking
8.3.12.4. Strategic initiatives
8.3.13. Eckert & Ziegler.
8.3.13.1. Company overview
8.3.13.2. Financial performance
8.3.13.3. Product benchmarking
8.3.13.4. Strategic initiatives
8.3.14. Mallinckrodt.
8.3.14.1. Company overview
8.3.14.2. Financial performance
8.3.14.3. Product benchmarking
8.3.15. Cardinal Health.
8.3.15.1. Company overview
8.3.15.2. Financial performance
8.3.15.3. Product benchmarking
8.3.15.4. Strategic initiatives
List of Tables
Table 1 List of abbreviation
Table 2 North America nuclear medicine market, by region, 2018 - 2030 (USD Million)
Table 3 North America nuclear medicine market, by product, 2018 - 2030 (USD Million)
Table 4 North America nuclear medicine market, by application, 2018 - 2030 (USD Million)
Table 5 North America nuclear medicine market, by end use, 2018 - 2030 (USD Million)
Table 6 U.S. nuclear medicine market, by product, 2018 - 2030 (USD Million)
Table 7 U.S. nuclear medicine market, by application, 2018 - 2030 (USD Million)
Table 8 U.S. nuclear medicine market, by end use, 2018 - 2030 (USD Million)
Table 9 Canada nuclear medicine market, by product, 2018 - 2030 (USD Million)
Table 10 Canada nuclear medicine market, by application, 2018 - 2030 (USD Million)
Table 11 Canada nuclear medicine market, by end use, 2018 - 2030 (USD Million)
Table 12 Europe nuclear medicine market, by region, 2018 - 2030 (USD Million)
Table 13 Europe nuclear medicine market, by product, 2018 - 2030 (USD Million)
Table 14 Europe nuclear medicine market, by application, 2018 - 2030 (USD Million)
Table 15 Europe nuclear medicine market, by end use, 2018 - 2030 (USD Million)
Table 16 Germany nuclear medicine market, by product, 2018 - 2030 (USD Million)
Table 17 Germany nuclear medicine market, by application, 2018 - 2030 (USD Million)
Table 18 Germany nuclear medicine market, by end use, 2018 - 2030 (USD Million)
Table 19 UK nuclear medicine market, by product, 2018 - 2030 (USD Million)
Table 20 UK nuclear medicine market, by application, 2018 - 2030 (USD Million)
Table 21 UK nuclear medicine market, by end use, 2018 - 2030 (USD Million)
Table 22 France nuclear medicine market, by product, 2018 - 2030 (USD Million)
Table 23 France nuclear medicine market, by application, 2018 - 2030 (USD Million)
Table 24 France nuclear medicine market, by end use, 2018 - 2030 (USD Million)
Table 25 Italy nuclear medicine market, by product, 2018 - 2030 (USD Million)
Table 26 Italy nuclear medicine market, by application, 2018 - 2030 (USD Million)
Table 27 Italy nuclear medicine market, by end use, 2018 - 2030 (USD Million)
Table 28 Spain nuclear medicine market, by product, 2018 - 2030 (USD Million)
Table 29 Spain nuclear medicine market, by application, 2018 - 2030 (USD Million)
Table 30 Spain nuclear medicine market, by end use, 2018 - 2030 (USD Million)
Table 31 Denmark nuclear medicine market, by product, 2018 - 2030 (USD Million)
Table 32 Denmark nuclear medicine market, by application, 2018 - 2030 (USD Million)
Table 33 Denmark nuclear medicine market, by end use, 2018 - 2030 (USD Million)
Table 34 Sweden nuclear medicine market, by product, 2018 - 2030 (USD Million)
Table 35 Sweden nuclear medicine market, by application, 2018 - 2030 (USD Million)
Table 36 Sweden nuclear medicine market, by end use, 2018 - 2030 (USD Million)
Table 37 Norway nuclear medicine market, by product, 2018 - 2030 (USD Million)
Table 38 Norway nuclear medicine market, by application, 2018 - 2030 (USD Million)
Table 39 Norway nuclear medicine market, by end use, 2018 - 2030 (USD Million)
Table 40 Asia Pacific nuclear medicine market, by region, 2018 - 2030 (USD Million)
Table 41 Asia Pacific nuclear medicine market, by product, 2018 - 2030 (USD Million)
Table 42 Asia Pacific nuclear medicine market, by application, 2018 - 2030 (USD Million)
Table 43 Aisa Pacific nuclear medicine market, by end use, 2018 - 2030 (USD Million)
Table 44 China nuclear medicine market, by product, 2018 - 2030 (USD Million)
Table 45 China nuclear medicine market, by application, 2018 - 2030 (USD Million)
Table 46 China nuclear medicine market, by end use, 2018 - 2030 (USD Million)
Table 47 Japan nuclear medicine market, by product, 2018 - 2030 (USD Million)
Table 48 Japan nuclear medicine market, by application, 2018 - 2030 (USD Million)
Table 49 Japan nuclear medicine market, by end use, 2018 - 2030 (USD Million)
Table 50 India nuclear medicine market, by product, 2018 - 2030 (USD Million)
Table 51 India nuclear medicine market, by application, 2018 - 2030 (USD Million)
Table 52 India nuclear medicine market, by end use, 2018 - 2030 (USD Million)
Table 53 South Korea nuclear medicine market, by product, 2018 - 2030 (USD Million)
Table 54 South Korea nuclear medicine market, by application, 2018 - 2030 (USD Million)
Table 55 South Korea nuclear medicine market, by end use, 2018 - 2030 (USD Million)
Table 56 Australia nuclear medicine market, by product, 2018 - 2030 (USD Million)
Table 57 Australia nuclear medicine market, by application, 2018 - 2030 (USD Million)
Table 58 Australia nuclear medicine market, by end use, 2018 - 2030 (USD Million)
Table 59 Thailand nuclear medicine market, by product, 2018 - 2030 (USD Million)
Table 60 Thailand nuclear medicine market, by application, 2018 - 2030 (USD Million)
Table 61 Thailand nuclear medicine market, by end use, 2018 - 2030 (USD Million)
Table 62 Latin America nuclear medicine market, by region, 2018 - 2030 (USD Million)
Table 63 Latin America nuclear medicine market, by product, 2018 - 2030 (USD Million)
Table 64 Latin America nuclear medicine market, by application, 2018 - 2030 (USD Million)
Table 65 Latin America nuclear medicine market, by end use, 2018 - 2030 (USD Million)
Table 66 Brazil nuclear medicine market, by product, 2018 - 2030 (USD Million)
Table 67 Brazil nuclear medicine market, by application, 2018 - 2030 (USD Million)
Table 68 Brazil nuclear medicine market, by end use, 2018 - 2030 (USD Million)
Table 69 Mexico nuclear medicine market, by product, 2018 - 2030 (USD Million)
Table 70 Mexico nuclear medicine market, by application, 2018 - 2030 (USD Million)
Table 71 Mexico nuclear medicine market, by end use, 2018 - 2030 (USD Million)
Table 72 Argentina nuclear medicine market, by product, 2018 - 2030 (USD Million)
Table 73 Argentina nuclear medicine market, by application, 2018 - 2030 (USD Million)
Table 74 Argentina nuclear medicine market, by end use, 2018 - 2030 (USD Million)
Table 75 MEA nuclear medicine market, by region, 2018 - 2030 (USD Million)
Table 76 MEA nuclear medicine market, by product, 2018 - 2030 (USD Million)
Table 77 MEA nuclear medicine market, by application, 2018 - 2030 (USD Million)
Table 78 MEA nuclear medicine market, by end use, 2018 - 2030 (USD Million)
Table 79 South Africa nuclear medicine market, by product, 2018 - 2030 (USD Million)
Table 80 South Africa nuclear medicine market, by application, 2018 - 2030 (USD Million)
Table 81 South Africa nuclear medicine market, by end use, 2018 - 2030 (USD Million)
Table 82 Saudi Arabia nuclear medicine market, by product, 2018 - 2030 (USD Million)
Table 83 Saudi Arabia nuclear medicine market, by application, 2018 - 2030 (USD Million)
Table 84 Saudi Arabia nuclear medicine market, by end use, 2018 - 2030 (USD Million)
Table 85 UAE nuclear medicine market, by product, 2018 - 2030 (USD Million)
Table 86 UAE nuclear medicine market, by application, 2018 - 2030 (USD Million)
Table 87 UAE nuclear medicine market, by end use, 2018 - 2030 (USD Million)
Table 88 Kuwait nuclear medicine market, by product, 2018 - 2030 (USD Million)
Table 89 Kuwait nuclear medicine market, by application, 2018 - 2030 (USD Million)
Table 90 Kuwait nuclear medicine market, by end use, 2018 - 2030 (USD Million)
List of Figures
Fig. 1 Nuclear medicine market segmentation
Fig. 2 Market research process
Fig. 3 Information procurement
Fig. 4 Primary research pattern
Fig. 5 Market research approaches
Fig. 6 Value-chain-based sizing & forecasting
Fig. 7 QFD modeling for market share assessment
Fig. 8 Market formulation & validation
Fig. 9 Nuclear medicine market snapshot
Fig. 10 Nuclear medicine market driver impact
Fig. 11 Global cancer cases projections - 2030 (Number of new registered cases)
Fig. 12 Nuclear medicine market restraint impact
Fig. 13 SWOT analysis, by factor (political & legal, economic and technological)
Fig. 14 Porter’s five forces analysis
Fig. 15 Value chain analysis
Fig. 16 Nuclear medicine market: Production of Tc-99 (SPECT radioisotopes)
Fig. 17 Nuclear medicine market: Production of 18F-FDG (PET radioisotopes)
Fig. 18 Company market share analysis
Fig. 19 Company market position analysis
Fig. 20 Company market position analysis
Fig. 21 Competitive dashboard analysis
Fig. 22 Regional network map
Fig. 23 Nuclear medicine market: Product outlook and key takeaways
Fig. 24 Nuclear medicine market: Product movement analysis
Fig. 25 Diagnostic products market estimates and forecast, 2018 - 2030 (USD Million)
Fig. 26 SPECT products market estimates and forecast, 2018 - 2030 (USD Million)
Fig. 27 TC-99m market estimates and forecast, 2018 - 2030 (USD Million)
Fig. 28 TL-201 market estimates and forecast, 2018 - 2030 (USD Million)
Fig. 29 GA-67 market estimates and forecast, 2018 - 2030 (USD Million)
Fig. 30 I-123 market estimates and forecast, 2018 - 2030 (USD Million)
Fig. 31 Other SPECT products market estimates and forecast, 2018 - 2030 (USD Million)
Fig. 32 PET products market estimates and forecast, 2018 - 2030 (USD Million)
Fig. 33 F-18 market estimates and forecast, 2018 - 2030 (USD Million)
Fig. 34 SR-82/RB-82 market estimates and forecast, 2018 - 2030 (USD Million)
Fig. 35 PYLARIFY (piflufolastat F 18) market estimates and forecast, 2018 - 2030 (USD Million)
Fig. 36 Illuccix (gallium Ga 68 gozetotide) market estimates and forecast, 2018 - 2030 (USD Million)
Fig. 37 Others market estimates and forecast, 2018 - 2030 (USD Million)
Fig. 38 Therapeutic products market estimates and forecast, 2018 - 2030 (USD Million)
Fig. 39 Alpha emitters market estimates and forecast, 2018 - 2030 (USD Million)
Fig. 40 RA-223 market estimates and forecast, 2018 - 2030 (USD Million)
Fig. 41 Others market estimates and forecast, 2018 - 2030 (USD Million)
Fig. 42 Beta emitters market estimates and forecast, 2018 - 2030 (USD Million)
Fig. 43 I-131 market estimates and forecast, 2018 - 2030 (USD Million)
Fig. 44 Y-90 market estimates and forecast, 2018 - 2030 (USD Million)
Fig. 45 SM-153 market estimates and forecast, 2018 - 2030 (USD Million)
Fig. 46 Re-186 market estimates and forecast, 2018 - 2030 (USD Million)
Fig. 47 Lu-177 market estimates and forecast, 2018 - 2030 (USD Million)
Fig. 48 Others market estimates and forecast, 2018 - 2030 (USD Million)
Fig. 49 Brachytherapy market estimates and forecast, 2018 - 2030 (USD Million)
Fig. 50 Cesium-131 market estimates and forecast, 2018 - 2030 (USD Million)
Fig. 51 Iodine-125 market estimates and forecast, 2018 - 2030 (USD Million)
Fig. 52 Palladium-103 market estimates and forecast, 2018 - 2030 (USD Million)
Fig. 53 Iridium-192 market estimates and forecast, 2018 - 2030 (USD Million)
Fig. 54 Others market estimates and forecast, 2018 - 2030 (USD Million)
Fig. 55 Nuclear medicine market: Application outlook and key takeaways
Fig. 56 Nuclear medicine market: Application movement analysis
Fig. 57 Cardiology market estimates and forecast, 2018 - 2030 (USD Million)
Fig. 58 Neurology market estimates and forecast, 2018 - 2030 (USD Million)
Fig. 59 Oncology market estimates and forecast, 2018 - 2030 (USD Million)
Fig. 60 Thyroid market estimates and forecast, 2018 - 2030 (USD Million)
Fig. 61 Lymphoma market estimates and forecast, 2018 - 2030 (USD Million)
Fig. 62 Bone metastasis market estimates and forecast, 2018 - 2030 (USD Million)
Fig. 63 Endocrine tumor market estimates and forecast, 2018 - 2030 (USD Million)
Fig. 64 Pulmonary scans market estimates and forecast, 2018 - 2030 (USD Million)
Fig. 65 Urology market estimates and forecast, 2018 - 2030 (USD Million)
Fig. 66 Other market estimates and forecast, 2018 - 2030 (USD Million)
Fig. 67 Nuclear medicine market: End-use outlook and key takeaways
Fig. 68 Nuclear medicine market: End-use movement analysis
Fig. 69 Hospitals & clinics market estimates and forecast, 2018 - 2030 (USD Million)
Fig. 70 Diagnostic centers market estimates and forecast, 2018 - 2030 (USD Million)
Fig. 71 Others market estimates and forecast, 2018 - 2030 (USD Million)
Fig. 72 Global nuclear medicine market: Regional movement analysis
Fig. 73 Global nuclear medicine market: Regional outlook and key takeaways
Fig. 74 Global nuclear medicine market share and leading players
Fig. 75 North America, by country
Fig. 76 North America market estimates and forecasts, 2018 - 2030 (USD Million)
Fig. 77 U.S. key country dynamics
Fig. 78 U.S. market estimates and forecasts, 2018 - 2030 (USD Million)
Fig. 79 Canada key country dynamics
Fig. 80 Canada market estimates and forecasts, 2018 - 2030 (USD Million)
Fig. 81 Mexico key country dynamics
Fig. 82 Mexico market estimates and forecasts, 2018 - 2030 (USD Million)
Fig. 83 Europe market estimates and forecasts, 2018 - 2030 (USD Million)
Fig. 84 UK key country dynamics
Fig. 85 UK market estimates and forecasts, 2018 - 2030 (USD Million)
Fig. 86 Germany key country dynamics
Fig. 87 Germany market estimates and forecasts, 2018 - 2030 (USD Million)
Fig. 88 France key country dynamics
Fig. 89 France market estimates and forecasts, 2018 - 2030 (USD Million)
Fig. 90 Italy key country dynamics
Fig. 91 Italy market estimates and forecasts, 2018 - 2030 (USD Million)
Fig. 92 Spain key country dynamics
Fig. 93 Spain market estimates and forecasts, 2018 - 2030 (USD Million)
Fig. 94 Denmark key country dynamics
Fig. 95 Denmark market estimates and forecasts, 2018 - 2030 (USD Million)
Fig. 96 Sweden key country dynamics
Fig. 97 Sweden market estimates and forecasts, 2018 - 2030 (USD Million)
Fig. 98 Norway key country dynamics
Fig. 99 Norway market estimates and forecasts, 2018 - 2030 (USD Million)
Fig. 100 Asia Pacific market estimates and forecasts, 2018 - 2030 (USD Million)
Fig. 101 China key country dynamics
Fig. 102 China market estimates and forecasts, 2018 - 2030 (USD Million)
Fig. 103 Japan key country dynamics
Fig. 104 Japan market estimates and forecasts, 2018 - 2030 (USD Million)
Fig. 105 India key country dynamics
Fig. 106 India market estimates and forecasts, 2018 - 2030 (USD Million)
Fig. 107 Thailand key country dynamics
Fig. 108 Thailand market estimates and forecasts, 2018 - 2030 (USD Million)
Fig. 109 South Korea key country dynamics
Fig. 110 South Korea market estimates and forecasts, 2018 - 2030 (USD Million)
Fig. 111 Australia key country dynamics
Fig. 112 Australia market estimates and forecasts, 2018 - 2030 (USD Million)
Fig. 113 Latin America market estimates and forecasts, 2018 - 2030 (USD Million)
Fig. 114 Brazil key country dynamics
Fig. 115 Brazil market estimates and forecasts, 2018 - 2030 (USD Million)
Fig. 116 Argentina key country dynamics
Fig. 117 Argentina market estimates and forecasts, 2018 - 2030 (USD Million)
Fig. 118 Middle East and Africa market estimates and forecasts, 2018 - 2030 (USD Million)
Fig. 119 South Africa key country dynamics
Fig. 120 South Africa market estimates and forecasts, 2018 - 2030 (USD Million)
Fig. 121 Saudi Arabia key country dynamics
Fig. 122 Saudi Arabia market estimates and forecasts, 2018 - 2030 (USD Million)
Fig. 123 UAE key country dynamics
Fig. 124 UAE market estimates and forecasts, 2018 - 2030 (USD Million)
Fig. 125 Kuwait key country dynamics
Fig. 126 Kuwait market estimates and forecasts, 2018 - 2030 (USD Million)
Fig. 127 Market share of key market players- nuclear medicine market
Market Segmentation
Report content
Qualitative Analysis
Quantitative Analysis
Research Methodology
Grand View Research employs comprehensive and iterative research methodology focused on minimizing deviance in order to provide the most accurate estimates and forecast possible. The company utilizes a combination of bottom-up and top-down approaches for segmenting and estimating quantitative aspects of the market. In Addition, a recurring theme prevalent across all our research reports is data triangulation that looks market from three different perspectives. Critical elements of methodology employed for all our studies include:
Preliminary data mining
Raw market data is obtained and collated on a broad front. Data is continuously filtered to ensure that only validated and authenticated sources are considered. In addition, data is also mined from a host of reports in our repository, as well as a number of reputed paid databases. For comprehensive understanding of the market, it is essential to understand the complete value chain and in order to facilitate this; we collect data from raw material suppliers, distributors as well as buyers.
Technical issues and trends are obtained from surveys, technical symposia and trade journals. Technical data is also gathered from intellectual property perspective, focusing on white space and freedom of movement. Industry dynamics with respect to drivers, restraints, pricing trends are also gathered. As a result, the material developed contains a wide range of original data that is then further cross-validated and authenticated with published sources.
Statistical model
Our market estimates and forecasts are derived through simulation models. A unique model is created customized for each study. Gathered information for market dynamics, technology landscape, application development and pricing trends is fed into the model and analyzed simultaneously. These factors are studied on a comparative basis, and their impact over the forecast period is quantified with the help of correlation, regression and time series analysis. Market forecasting is performed via a combination of economic tools, technological analysis, and industry experience and domain expertise.
Econometric models are generally used for short-term forecasting, while technological market models are used for long-term forecasting. These are based on an amalgamation of technology landscape, regulatory frameworks, economic outlook and business principles. A bottom-up approach to market estimation is preferred, with key regional markets analyzed as separate entities and integration of data to obtain global estimates. This is critical for a deep understanding of the industry as well as ensuring minimal errors. Some of the parameters considered for forecasting include:
• Market drivers and restrains, along with their current and expected impact
• Raw material scenario and supply v/s price trends
• Regulatory scenario and expected developments
• Current capacity and expected capacity additions up to 2030
We assign weights to these parameters and quantify their market impact using weighted average analysis, to derive an expected market growth rate.
Primary validation
This is the final step in estimating and forecasting for our reports. Exhaustive primary interviews are conducted, on face to face as well as over the phone to validate our findings and assumptions used to obtain them. Interviewees are approached from leading companies across the value chain including suppliers, technology providers, domain experts and buyers so as to ensure a holistic and unbiased picture of the market. These interviews are conducted across the globe, with language barriers overcome with the aid of local staff and interpreters. Primary interviews not only help in data validation, but also provide critical insights into the market, current business scenario and future expectations and enhance the quality of our reports. All our estimates and forecast are verified through exhaustive primary research with Key Industry Participants (KIPs) which typically include:
• Market leading companies
• Raw material suppliers
• Product distributors
• Buyers
The key objectives of primary research are as follows:
• To validate our data in terms of accuracy and acceptability
• To gain an insight in to the current market and future expectations
Data Collection Matrix
Perspective |
Primary research |
Secondary research |
Supply side |
|
|
Demand side |
|
|
Industry Analysis Matrix
Qualitative analysis |
Quantitative analysis |
|
|
NEED A CUSTOM REPORT?
We can customize every report - free of charge - including purchasing stand-alone sections or country-level reports, as well as offer affordable discounts for start-ups & universities. Contact us now
We are GDPR and CCPA compliant! Your transaction & personal information is safe and secure. For more details, please read our privacy policy.
"The quality of research they have done for us has been excellent."