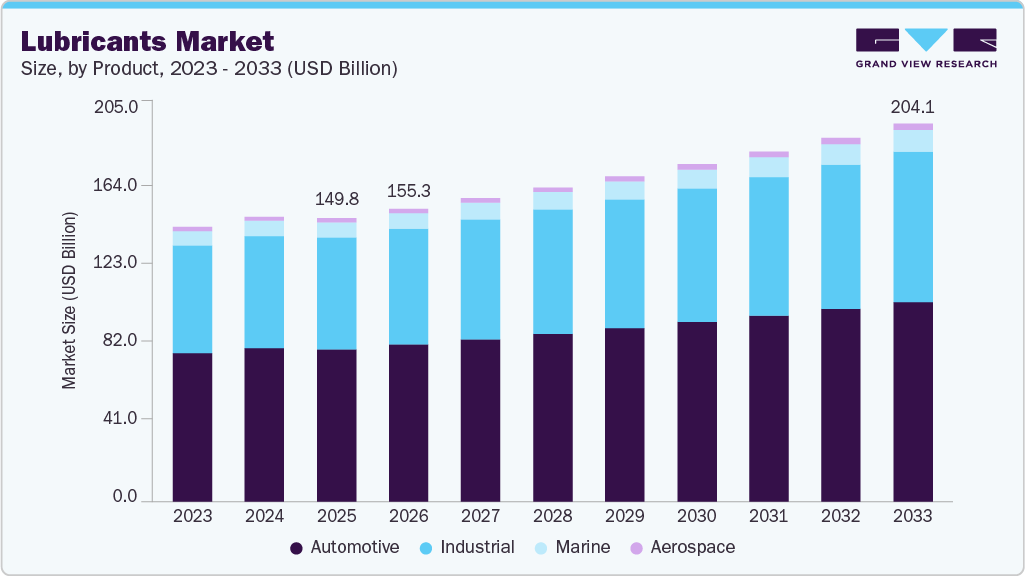
The global lubricants market size was estimated at USD 139.44 billion in 2023 and is projected to grow at a compound annual growth rate (CAGR) of 3.8% from 2024 to 2030. This is attributed to the growing demand for automotive oils and greases due to the growing trade of vehicles and spare parts. Lubricants are an essential part of rapidly expanding industries. They are used between two relatively moving machinery parts to reduce friction and wear & tear. They can be either petroleum-based or water-based and are essential for proper machinery functioning. Lubricants also decrease operational downtime and eventually increase overall productivity. Lubricants are extensively used in processing industries and automobile parts, especially brakes and engines, which need lubrication for continuous smooth functioning.
The increasing imports and exports of piston engine lubricants are contributing to market growth. The product demand is driven by the rising focus of consumers on enhancing vehicle performance coupled with the introduction of innovative & premium product offerings. Future growth will be highly dependent on motor vehicle production and the miles covered by each vehicle. Furthermore, consumers are looking for standard and specialized lubricants for their regular vehicles to ensure the smooth functioning of their vehicles and reduce long-term maintenance costs.
Lubricant manufacturing requires crude oil, tight oil, and other additives to formulate all lubricant types. There are multiple additives incorporated in lubricants to enhance their functionality and properties. These include antioxidants, extreme pressure additives, rust- & corrosion-prevention additives, detergents, viscosity index improvers, anti-wear agents, and dispersants. Lubricants are 90% base oil and 10% additives, wherein base oils include petrochemical fractions, such as fluorocarbons, esters, polyolefin, and silicones. Base oils increase the viscosity of the lubricants and reduce wear & tear. Paraffinic and naphthenic are the two essential base oils used in lubricant formulations.
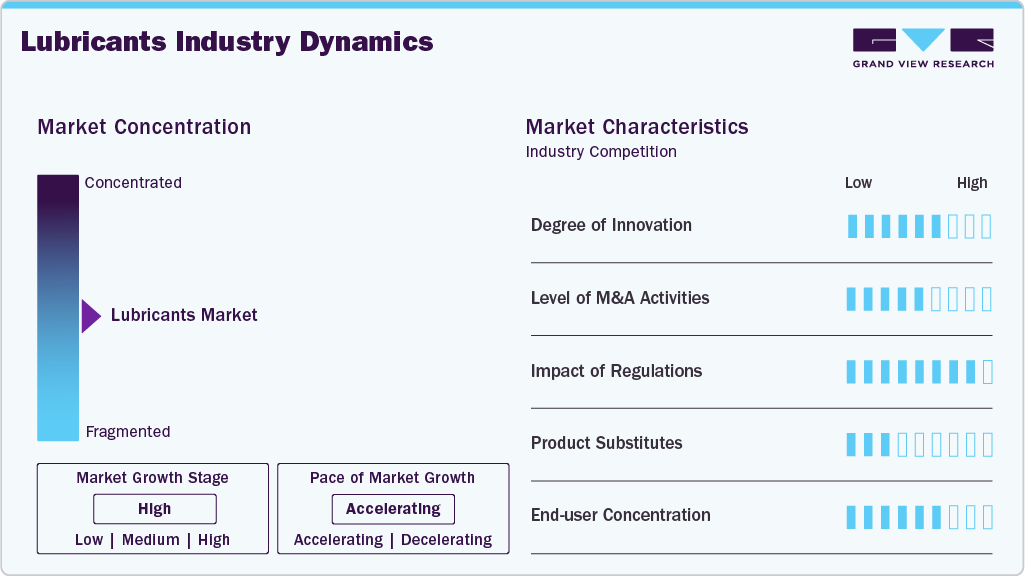
Market growth stage is medium, and pace of the market growth is accelerating. Joint ventures, mergers and acquisitions in the industry has increased significantly over the past decade. Companies constantly seek to establish long-term contract agreements with trusted partners for sustainable business operations globally.
Further, the global lubricants industry is scrutinized by stringent regulations ranging from their production to use and disposal. The additives used in lubricant manufacturing are checked for their toxicity and potential to harm the environment. Some of the regulatory bodies influencing market dynamics include Occupational Safety & Health Administration (OSHA), Environmental Protection Agency (EPA), Registration, Evaluation, Authorization and Restriction of Chemicals (REACH), EU Council Directive & European Registration, Evaluation, Authorization & Restriction of Chemicals (REACH) standards.
The lubricants market structure is highly fragmented with a large number of small, medium, and large players. The major differentiating factor is the depth of the product mix. Major companies are investing in upstream facilities to support their high margin downstream operations. The tie-ups with distribution companies and increasing territorial expanse are expected to influence market penetration over the forecast period.
The automotive segment dominated the global industry in 2023 with the largest revenue share of 53.4%. This is attributed to the increased sales of consumer automobiles, such as buses, trucks, and other forms of passenger transport. Economic growth in emerging markets, such as China, India, and Brazil, has led to the betterment of public transportation in these regions. This trend is expected to strengthen the demand for commercial automotive lubricants further. Increasing sales of commercial vehicles, such as heavy-duty trucks, and construction automotive, such as cranes, bulldozers, and concrete mixers, is expected to complement the Middle East & Africa region’s growth over the forecast period. The industrial segment held the second-largest share in 2023 due to the high industrial production in emerging markets.
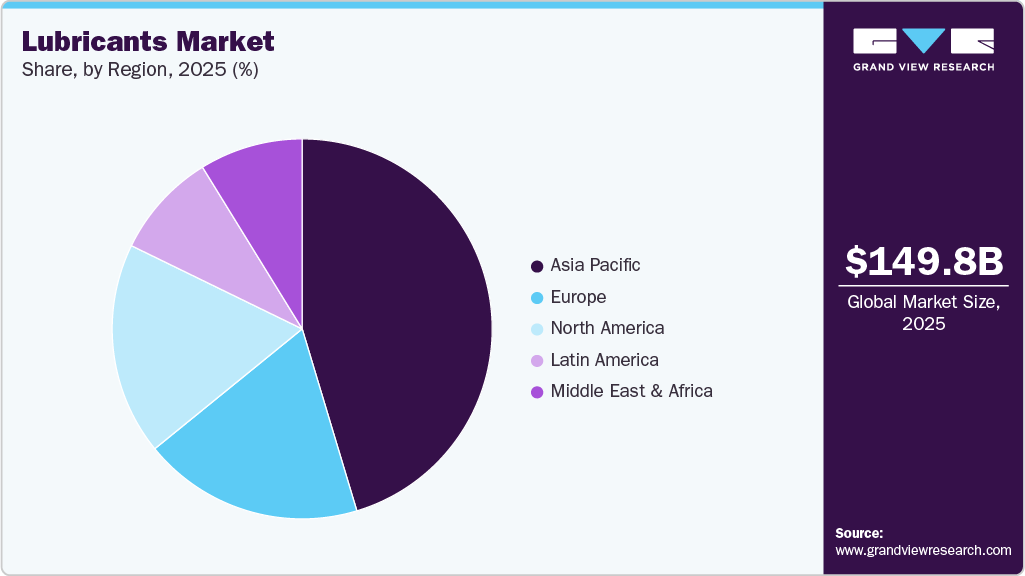
Asia Pacific dominated the industry with a revenue share of 44.6% in 2023. The growth is attributed to the rapid growth of the automotive industry along with industrial development and the presence of automotive manufacturing industries in countries, such as Japan, India, and China. The most extensively used lubricants in the Asian market include automotive engine oils, greases, and hydraulic fluids. Asia Pacific has started mirroring the American and European regulatory systems, and countries like Japan and South Korea are thus emphasizing eco-labeled lubricants. Moreover, Asia Pacific also holds the dominant position in the global marine industry, owing to a large number of ports and increasing trade activities with the U.S. and other developed economies.
Lubricants market in India is anticipated to register a growth rate of 5.2% across the forecast period. The marine industries in India, China, and Singapore are anticipated to emerge as international port operators over the forecast period. These factors are anticipated to boost lubricant consumption in various marine applications. China is the largest and most mature market in Asia Pacific, with over 55,000 participating businesses. According to the Society of Tribologists and Lubrication Engineers, around 65% of the global newly added chemical material capacity in 2020 was in China. Thus, rapid industrialization in the country is anticipated to increase product demand over the forecast period. Also, in 2023, China witnessed an 11.6% increase in the production of vehicles to meet the increasing demand.
Europe accounted for a significant revenue share in 2023 and is predicted to register a considerable CAGR over the forecast period. The automotive industry in the European Union (EU) is one of the largest industries across the globe, forming a crucial part of its economy. In first three quarters of 2023, the EU produced more than 9 million cars, which is 14% higher than the previous year (Q1-Q3).
According to the European Commission, this industry employs approximately 2.6 million people who are directly involved in the manufacturing of vehicles, representing approximately 8.5% of the total manufacturing employment of the European Union. The region is also one of the world's leading producers of motor vehicles due to support provided by governments of different countries in the form of funds and technological harmonization for carrying out R&D activities in automation. This is likely to have a positive impact on the industry's growth.
The global lubricants market is competitive with a large number of well diversified regional, and independent small scale and large scale manufacturers and suppliers. The small-scale companies majorly compete on the basis of price, after sales service and delivery timelines. Whereas the large scale companies focus on product development and innovations as well as marketing strategies
Some of the key players operating in the market include Exxon Mobil Corp, Shell, and TotalEnergies.
ExxonMobil Corp. is a global manufacturer & supplier of synthetic lubricants. The company mainly deals in three business segments that include upstream (oil & gas, E&P, shipping and wholesale operations), downstream (refining, marketing and retail operations) and chemicals. ExxonMobil owns 37 oil refineries in 21 countries with refining capacity of 6.3 million barrels per day.
Shell is a global leader as a group of petrochemical and energy companies, with presence across 70 countries and over 90,000 employees. The group provides fuels, car services, oils, and is also engaged in production, exploration, and refining of petroleum products. The group offers lubricants for industrial and transport businesses along with lubrication process and services.
Total Energies. is oil & gas integrated company. The company has its business segments in upstream, refining & specialty chemicals, and marketing & services. Total Oil India Private Ltd. is an entirely owned subsidiary of TOTAL. It has exploration and production activities in more than 50 countries. The company has a broad catalogue of lubricants for various markets such as agriculture, vehicles, aviation, energy, and chemicals, among others.
Some emerging market players include:
The following are the leading companies in the lubricants market. These companies collectively hold the largest market share and dictate industry trends. Financials, strategy maps & products of these lubricants companies are analyzed to map the supply network.
In January 2024, Shell U.K. Limited acquired MIDEL and MIVOLT from M&I Materials Ltd. The products of the latter two will be produced and distributed as part of Shell’s Lubricants portfolio. The acquisition will help Shell to strengthen its position in Transformer Oils, which finds use in offshore wind parks, utility companies, and power distribution.
From September 2023, TotalEnergies Lubrifiants accelerated the inclusion of recycled plastics (50% PCR high-density polyethylene) in its lubricants bottles, following a pilot project launched in 2021 called Quartz Xtra bottles. This aims at contributing to a circular economy and in decline of usage of virgin plastic.
In March 2023, ExxonMobil announced investing around INR 900 crore (~USD 110 million) for constructing a lubricants production plant in Raigad, Maharashtra, India. Upon completion, plant’s annual production capacity is expected to be 159,000 kl of finished lubricants. This plant will cater to growing demand from industries such as mining, construction, power, steel, and manufacturing, among others.
Report Attribute |
Details |
Market size value in 2024 |
USD 144.38 billion |
Revenue forecast in 2030 |
USD 180.21 billion |
Growth rate |
CAGR of 3.8% from 2024 to 2030 |
Historical data |
2018 - 2022 |
Forecast period |
2024 - 2030 |
Quantitative units |
Revenue in USD million, volume in kilotons, and CAGR from 2024 to 2030 |
Report coverage |
Revenue forecast, company ranking, competitive landscape, growth factors, and trends |
Segments covered |
Application, base oil, region |
Regional scope |
North America, Europe, Asia Pacific, South America, Middle East & Africa |
Country scope |
U.S., Canada, Mexico, UK, Germany, Switzerland, Russia, France, Italy, Spain, Netherlands, China, India, Japan, South Korea, Malaysia, Indonesia, Vietnam, Australia, New Zealand, Kyrgyzstan, Brazil, Argentina, Colombia, Chile, Iran, Oman, UAE, Qatar, Kuwait, Saudi Arabia, South Africa, Angola, Nigeria |
Key companies profiled |
ExxonMobil Corp.; Royal Dutch Shell Co.; BP PLC; Total Energies; Chevron Corp.; Fuchs; Castrol India Ltd.; Amsoil Inc.; JX Nippon Oil & Gas Exploration Corp.; Philips 66 Company; Valvoline LLC; PetroChina Company Ltd.; China Petrochemical Corp.; Idemitsu Kosan Co. Ltd.; Lukoil; Petrobras; Petronas Lubricant International; Quaker Chemical Corp.; PetroFer Chemie; Buhmwoo Chemical Co. Ltd.; Zeller Gmelin Gmbh & Co. KG; Blaser Swisslube Inc. |
Customization scope |
Free report customization (equivalent up to 8 analysts working days) with purchase. Addition or alteration to country, regional & segment scope. |
Pricing and purchase options |
Avail customized purchase options to meet your exact research needs. Explore purchase options |
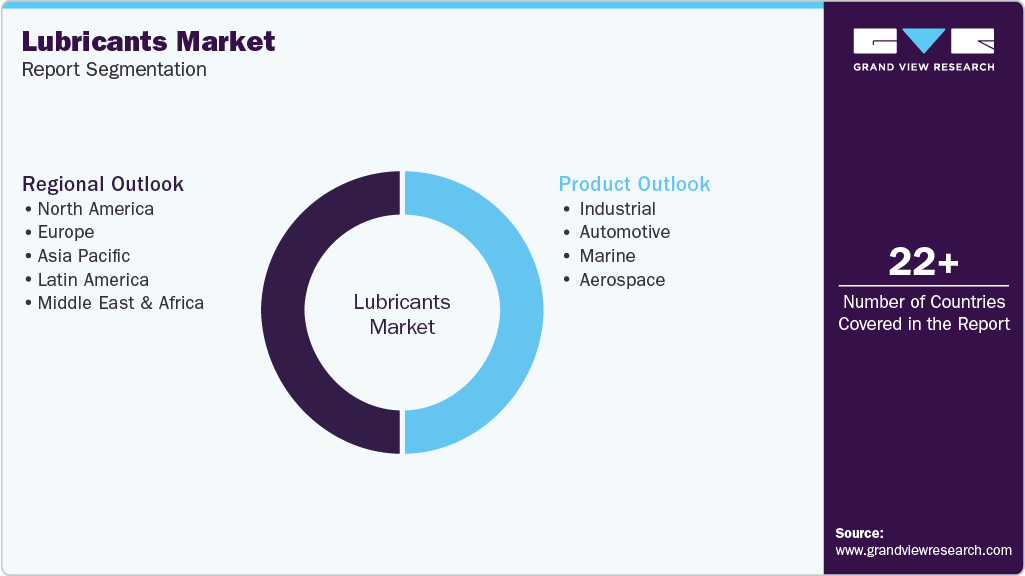
This report forecasts revenue growth at global, regional, and country levels and provides an analysis on the latest industry trends in each of the sub-segments from 2018 to 2030. For the purpose of this study, Grand View Research has segmented the global lubricants market report on the basis of application, base oil, and region:
Application Outlook (Revenue, USD Million; Volume, Kilotons, 2018 - 2030)
Industrial
Process Oils
General Industrial Oils
Metalworking Oils
Industrial Engine Oils
Greases
Others
Automotive
Engine oil
0W-20
0W-30
0W-40
5W-20
5W-30
5W-40
10W-60
10W-40
15W-40
Others
Gear oil
Transmission fluids
Brake fluids
Coolants
Greases
Marine
Engine oil
Hydraulic oil
Gear oil
Turbine oil
Greases
Others
Aerospace
Gas turbine oil
Piston engine oil
Hydraulic fluids
Others
Base Oil Outlook (Revenue, USD Million; Volume, Kilotons, 2018 - 2030)
Mineral Oil
Synthetic Oil
Bio-based Oil
Regional Outlook (Revenue, USD Million; Volume, Kilotons, 2018 - 2030)
North America
U.S.
Canada
Mexico
Europe
Germany
U.K.
Switzerland
France
Russia
Italy
Spain
Netherlands
Asia Pacific
China
India
Japan
South Korea
South East Asia
Malaysia
Indonesia
Vietnam
Oceania
Australia
New Zealand
Kyrgyzstan
Central & South America
Brazil
Argentina
Chile
Colombia
Middle East & Africa
Middle East
Iran
Oman
UAE
Qatar
Kuwait
Saudi Arabia
Africa
South Africa
Angola
Nigeria
b. The global lubricants market size was estimated at USD 139.44 billion in 2023 and is expected to reach USD 144.38 billion in 2024.
b. The global lubricants market is expected to grow at a compound annual growth rate of 3.7% from 2024 to 2030 to reach USD 180.21 billion by 2030.
b. The automotive segment dominated the global lubricants market with a revenue share of 53.4% in 2023. This is attributed to the increased sales of consumer automobiles, such as buses, trucks, and other forms of passenger transport.
b. Asia Pacific dominated the lubricants market with a volumetric share of 44.6% in 2023. The growth is attributed to the rapid growth of the automotive industry along with industrial development and the presence of automotive manufacturing industries in the countries such as Japan, India, and China. .
b. Some key players operating in the lubricants market include ExxonMobil Corp., Royal Dutch Shell Co., British Petroleum, Total S.A., Chevron Corporation, Fuchs Group, Pennzoil, Amsoil Inc., Philips 66 Company, Valvoline LLC, Castrol, PetroChina, Sinopec Corp, Idemitsu Kosan Co. Ltd, and Petronas Lubricant International.
b. Key factors that are driving the lubricants market growth include growing demand for automotive oils and greases due to the growing trade of vehicles and spare parts.
Table of Contents
Chapter 1. Methodology and Scope
1.1. Market Segmentation & Scope
1.2. Market Definition
1.3. Information Procurement
1.3.1. Information Analysis
1.3.2. Market Formulation & Data Visualization
1.3.3. Data Validation & Publishing
1.4. Research Scope and Assumptions
1.4.1. List of Data Sources
Chapter 2. Executive Summary
2.1. Market Snapshot
2.2. Segment Snapshot
2.3. Competitive Landscape Snapshot
Chapter 3. Lubricants Market Variables, Trends & Scope
3.1. Market Outlook
3.2. Industry Value Chain Analysis
3.2.1. Raw Material Trends
3.2.2. Manufacturing/Technology Trends
3.2.2.1. Sedimentation
3.2.2.2. Fractionating
3.2.2.3. Filtering & Solvent Extraction
3.2.2.4. Additives, Inspection, & Packing
3.2.3. Sales Channel Analysis
3.2.4. Operational Margin Analysis
3.3. Technology Overview
3.3.1. Technology adaptation by key industry participants
3.4. Regulatory & Policy Landscape
3.5. Price Trend Analysis, 2018 - 2030
3.6. Lubricants Trade Analysis (HS Code: 3403 Lubricant Preparation)
3.6.1. Trade balance
3.6.2. Imports, by Region & Key Countries, 2018 - 2022
3.6.3. Exports, by Region & Key Countries, 2018 - 2022
3.7. Market Dynamics
3.7.1. Market Drivers
3.7.2. Market Restraints
3.7.3. Market Opportunities
3.7.4. Market Challenges
3.8. Industry Analysis Tools
3.8.1. Porter’s Analysis
3.8.2. Macro-Economic Analysis
Chapter 4. Lubricants Market: Base Oil Estimates & Trend Analysis
4.1. Base Oil Movement Analysis & Market Share, 2023 & 2030
4.1.1. Market Estimates and Forecasts, For the Following, 2018 - 2030 (Kilotons) (USD Million)
4.1.1.1. Mineral Oil
4.1.1.2. Synthetic Oil
4.1.1.3. Bio-Based Oil
Chapter 5. Lubricants Market: Application Estimates & Trend Analysis
5.1. Application Movement Analysis & Market Share, 2023 & 2030
5.1.1. Market Estimates and Forecasts, for the Following, 2018 - 2030 (Kilotons) (USD Million)
5.1.1.1. Industrial
5.1.1.1.1. Process Oils
5.1.1.1.2. General Industrial Oils
5.1.1.1.3. Metalworking Fluids
5.1.1.1.4. Industrial Engine Oils
5.1.1.1.5. Greases
5.1.1.1.6. Others
5.1.1.2. Automotive
5.1.1.2.1. Engine Oil
5.1.1.2.2. Gear Oil
5.1.1.2.3. Transmission Fluids
5.1.1.2.4. Brake Fluids
5.1.1.2.5. Coolants
5.1.1.2.6. Greases
5.1.1.3. Marine
5.1.1.3.1. Engine Oil
5.1.1.3.2. Hydraulic Oil
5.1.1.3.3. Gear Oi
5.1.1.3.4. Turbine Oil
5.1.1.3.5. Greases
5.1.1.3.6. Others
5.1.1.4. Aerospace
5.1.1.4.1. Gas Turbine Oils
5.1.1.4.2. Piston Engine Oils
5.1.1.4.3. Hydraulic Fluids
5.1.1.4.4. Others
Chapter 6. Lubricants Market: Regional Estimates & Trend Analysis
6.1. Regional Movement Analysis & Market Share, 2023 & 2030
6.2. North America
6.2.1. Market Estimates and Forecasts, 2018 - 2030 (Kilotons) (USD Million)
6.2.2. Market Estimates and Forecasts, By Base Oil, 2018 - 2030 (Kilotons) (USD Million)
6.2.3. Market Estimates and Forecasts, By Application, 2018 - 2030 (Kilotons) (USD Million)
6.2.4. U.S.
6.2.4.1. Key country dynamics
6.2.4.2. Market Estimates & Forecasts, 2018 - 2030 (Kilotons) (USD Million)
6.2.4.3. Market Estimates & Forecasts, By Base Oil, 2018 - 2030 (Kilotons) (USD Million)
6.2.4.4. Market Estimates & Forecasts, By Application, 2018 - 2030 (Kilotons) (USD Million)
6.2.5. Canada
6.2.5.1. Key country dynamics
6.2.5.2. Market Estimates & Forecasts, 2018 - 2030 (Kilotons) (USD Million)
6.2.5.3. Market Estimates & Forecasts, By Base Oil, 2018 - 2030 (Kilotons) (USD Million)
6.2.5.4. Market Estimates & Forecasts, By Application, 2018 - 2030 (Kilotons) (USD Million)
6.2.6. Mexico
6.2.6.1. Key country dynamics
6.2.6.2. Market Estimates & Forecasts, 2018 - 2030 (Kilotons) (USD Million)
6.2.6.3. Market Estimates & Forecasts, By Base Oil, 2018 - 2030 (Kilotons) (USD Million)
6.2.6.4. Market Estimates & Forecasts, By Application, 2018 - 2030 (Kilotons) (USD Million)
6.3. Europe
6.3.1. Market Estimates and Forecasts, 2018 - 2030 (Kilotons) (USD Million)
6.3.2. Market Estimates and Forecasts, By Base Oil, 2018 - 2030 (Kilotons) (USD Million)
6.3.3. Market Estimates and Forecasts, By Application, 2018 - 2030 (Kilotons) (USD Million)
6.3.4. UK
6.3.4.1. Key country dynamics
6.3.4.2. Market Estimates & Forecasts, 2018 - 2030 (Kilotons) (USD Million)
6.3.4.3. Market Estimates & Forecasts, By Base Oil, 2018 - 2030 (Kilotons) (USD Million)
6.3.4.4. Market Estimates & Forecasts, By Application, 2018 - 2030 (Kilotons) (USD Million)
6.3.5. Switzerland
6.3.5.1. Key country dynamics
6.3.5.2. Market Estimates & Forecasts, 2018 - 2030 (Kilotons) (USD Million)
6.3.5.3. Market Estimates & Forecasts, By Base Oil, 2018 - 2030 (Kilotons) (USD Million)
6.3.5.4. Market Estimates & Forecasts, By Application, 2018 - 2030 (Kilotons) (USD Million)
6.3.6. Germany
6.3.6.1. Key country dynamics
6.3.6.2. Market Estimates & Forecasts, 2018 - 2030 (Kilotons) (USD Million)
6.3.6.3. Market Estimates & Forecasts, By Base Oil, 2018 - 2030 (Kilotons) (USD Million)
6.3.6.4. Market Estimates & Forecasts, By Application, 2018 - 2030 (Kilotons) (USD Million)
6.3.7. France
6.3.7.1. Key country dynamics
6.3.7.2. Market Estimates & Forecasts, 2018 - 2030 (Kilotons) (USD Million)
6.3.7.3. Market Estimates & Forecasts, By Base Oil, 2018 - 2030 (Kilotons) (USD Million)
6.3.7.4. Market Estimates & Forecasts, By Application, 2018 - 2030 (Kilotons) (USD Million)
6.3.8. Russia
6.3.8.1. Key country dynamics
6.3.8.2. Market Estimates & Forecasts, 2018 - 2030 (Kilotons) (USD Million)
6.3.8.3. Market Estimates & Forecasts, By Base Oil, 2018 - 2030 (Kilotons) (USD Million)
6.3.8.4. Market Estimates & Forecasts, By Application, 2018 - 2030 (Kilotons) (USD Million)
6.3.9. Italy
6.3.9.1. Key country dynamics
6.3.9.2. Market Estimates & Forecasts, 2018 - 2030 (Kilotons) (USD Million)
6.3.9.3. Market Estimates & Forecasts, By Base Oil, 2018 - 2030 (Kilotons) (USD Million)
6.3.9.4. Market Estimates & Forecasts, By Application, 2018 - 2030 (Kilotons) (USD Million)
6.3.10. Spain
6.3.10.1. Key country dynamics
6.3.10.2. Market Estimates & Forecasts, 2018 - 2030 (Kilotons) (USD Million)
6.3.10.3. Market Estimates & Forecasts, By Base Oil, 2018 - 2030 (Kilotons) (USD Million)
6.3.10.4. Market Estimates & Forecasts, By Application, 2018 - 2030 (Kilotons) (USD Million)
6.3.11. The Netherlands
6.3.11.1. Key country dynamics
6.3.11.2. Market Estimates & Forecasts, 2018 - 2030 (Kilotons) (USD Million)
6.3.11.3. Market Estimates & Forecasts, By Base Oil, 2018 - 2030 (Kilotons) (USD Million)
6.3.11.4. Market Estimates & Forecasts, By Application, 2018 - 2030 (Kilotons) (USD Million)
6.4. Asia Pacific
6.4.1. Market Estimates and Forecasts, 2018 - 2030 (Kilotons) (USD Million)
6.4.2. Market Estimates and Forecasts, By Base Oil, 2018 - 2030 (Kilotons) (USD Million)
6.4.3. Market Estimates and Forecasts, By Application, 2018 - 2030 (Kilotons) (USD Million)
6.4.4. China
6.4.4.1. Key country dynamics
6.4.4.2. Market Estimates & Forecasts, 2018 - 2030 (Kilotons) (USD Million)
6.4.4.3. Market Estimates & Forecasts, By Base Oil, 2018 - 2030 (Kilotons) (USD Million)
6.4.4.4. Market Estimates & Forecasts, By Application, 2018 - 2030 (Kilotons) (USD Million)
6.4.5. India
6.4.5.1. Key country dynamics
6.4.5.2. Market Estimates & Forecasts, 2018 - 2030 (Kilotons) (USD Million)
6.4.5.3. Market Estimates & Forecasts, By Base Oil, 2018 - 2030 (Kilotons) (USD Million)
6.4.5.4. Market Estimates & Forecasts, By Application, 2018 - 2030 (Kilotons) (USD Million)
6.4.6. Japan
6.4.6.1. Key country dynamics
6.4.6.2. Market Estimates & Forecasts, 2018 - 2030 (Kilotons) (USD Million)
6.4.6.3. Market Estimates & Forecasts, By Base Oil, 2018 - 2030 (Kilotons) (USD Million)
6.4.6.4. Market Estimates & Forecasts, By Application, 2018 - 2030 (Kilotons) (USD Million)
6.4.7. South Korea
6.4.7.1. Key country dynamics
6.4.7.2. Market Estimates & Forecasts, 2018 - 2030 (Kilotons) (USD Million)
6.4.7.3. Market Estimates & Forecasts, By Base Oil, 2018 - 2030 (Kilotons) (USD Million)
6.4.7.4. Market Estimates & Forecasts, By Application, 2018 - 2030 (Kilotons) (USD Million)
6.4.8. Malaysia
6.4.8.1. Key country dynamics
6.4.8.2. Market Estimates & Forecasts, 2018 - 2030 (Kilotons) (USD Million)
6.4.8.3. Market Estimates & Forecasts, By Base Oil, 2018 - 2030 (Kilotons) (USD Million)
6.4.8.4. Market Estimates & Forecasts, By Application, 2018 - 2030 (Kilotons) (USD Million)
6.4.9. Indonesia
6.4.9.1. Key country dynamics
6.4.9.2. Market Estimates & Forecasts, 2018 - 2030 (Kilotons) (USD Million)
6.4.9.3. Market Estimates & Forecasts, By Base Oil, 2018 - 2030 (Kilotons) (USD Million)
6.4.9.4. Market Estimates & Forecasts, By Application, 2018 - 2030 (Kilotons) (USD Million)
6.4.10. Vietnam
6.4.10.1. Key country dynamics
6.4.10.2. Market Estimates & Forecasts, 2018 - 2030 (Kilotons) (USD Million)
6.4.10.3. Market Estimates & Forecasts, By Base Oil, 2018 - 2030 (Kilotons) (USD Million)
6.4.10.4. Market Estimates & Forecasts, By Application, 2018 - 2030 (Kilotons) (USD Million)
6.4.11. Australia
6.4.11.1. Key country dynamics
6.4.11.2. Market Estimates & Forecasts, 2018 - 2030 (Kilotons) (USD Million)
6.4.11.3. Market Estimates & Forecasts, By Base Oil, 2018 - 2030 (Kilotons) (USD Million)
6.4.11.4. Market Estimates & Forecasts, By Application, 2018 - 2030 (Kilotons) (USD Million)
6.4.12. New Zealand
6.4.12.1. Key country dynamics
6.4.12.2. Market Estimates & Forecasts, 2018 - 2030 (Kilotons) (USD Million)
6.4.12.3. Market Estimates & Forecasts, By Base Oil, 2018 - 2030 (Kilotons) (USD Million)
6.4.12.4. Market Estimates & Forecasts, By Application, 2018 - 2030 (Kilotons) (USD Million)
6.4.13. Kyrgyzstan
6.4.13.1. Key country dynamics
6.4.13.2. Market Estimates & Forecasts, 2018 - 2030 (Kilotons) (USD Million)
6.4.13.3. Market Estimates & Forecasts, By Base Oil, 2018 - 2030 (Kilotons) (USD Million)
6.4.13.4. Market Estimates & Forecasts, By Application, 2018 - 2030 (Kilotons) (USD Million)
6.5. Central & South America
6.5.1. Market Estimates and Forecasts, 2018 - 2030 (Kilotons) (USD Million)
6.5.2. Market Estimates and Forecasts, By Base Oil, 2018 - 2030 (Kilotons) (USD Million)
6.5.3. Market Estimates and Forecasts, By Application, 2018 - 2030 (Kilotons) (USD Million)
6.5.4. Brazil
6.5.4.1. Key country dynamics
6.5.4.2. Market Estimates & Forecasts, 2018 - 2030 (Kilotons) (USD Million)
6.5.4.3. Market Estimates & Forecasts, By Base Oil, 2018 - 2030 (Kilotons) (USD Million)
6.5.4.4. Market Estimates & Forecasts, By Application, 2018 - 2030 (Kilotons) (USD Million)
6.5.5. Argentina
6.5.5.1. Key country dynamics
6.5.5.2. Market Estimates & Forecasts, 2018 - 2030 (Kilotons) (USD Million)
6.5.5.3. Market Estimates & Forecasts, By Base Oil, 2018 - 2030 (Kilotons) (USD Million)
6.5.5.4. Market Estimates & Forecasts, By Application, 2018 - 2030 (Kilotons) (USD Million)
6.5.6. Chile
6.5.6.1. Key country dynamics
6.5.6.2. Market Estimates & Forecasts, 2018 - 2030 (Kilotons) (USD Million)
6.5.6.3. Market Estimates & Forecasts, By Base Oil, 2018 - 2030 (Kilotons) (USD Million)
6.5.6.4. Market Estimates & Forecasts, By Application, 2018 - 2030 (Kilotons) (USD Million)
6.5.7. Colombia
6.5.7.1. Key country dynamics
6.5.7.2. Market Estimates & Forecasts, 2018 - 2030 (Kilotons) (USD Million)
6.5.7.3. Market Estimates & Forecasts, By Base Oil, 2018 - 2030 (Kilotons) (USD Million)
6.5.7.4. Market Estimates & Forecasts, By Application, 2018 - 2030 (Kilotons) (USD Million)
6.6. Middle East & Africa
6.6.1. Market Estimates and Forecasts, 2018 - 2030 (Kilotons) (USD Million)
6.6.2. Market Estimates and Forecasts, By Base Oil, 2018 - 2030 (Kilotons) (USD Million)
6.6.3. Market Estimates and Forecasts, By Application, 2018 - 2030 (Kilotons) (USD Million)
6.6.4. Iran
6.6.4.1. Key country dynamics
6.6.4.2. Market Estimates & Forecasts, 2018 - 2030 (Kilotons) (USD Million)
6.6.4.3. Market Estimates & Forecasts, By Base Oil, 2018 - 2030 (Kilotons) (USD Million)
6.6.4.4. Market Estimates & Forecasts, By Application, 2018 - 2030 (Kilotons) (USD Million)
6.6.5. Oman
6.6.5.1. Key country dynamics
6.6.5.2. Market Estimates & Forecasts, 2018 - 2030 (Kilotons) (USD Million)
6.6.5.3. Market Estimates & Forecasts, By Base Oil, 2018 - 2030 (Kilotons) (USD Million)
6.6.5.4. Market Estimates & Forecasts, By Application, 2018 - 2030 (Kilotons) (USD Million)
6.6.6. UAE
6.6.6.1. Key country dynamics
6.6.6.2. Market Estimates & Forecasts, 2018 - 2030 (Kilotons) (USD Million)
6.6.6.3. Market Estimates & Forecasts, By Base Oil, 2018 - 2030 (Kilotons) (USD Million)
6.6.6.4. Market Estimates & Forecasts, By Application, 2018 - 2030 (Kilotons) (USD Million)
6.6.7. Qatar
6.6.7.1. Key country dynamics
6.6.7.2. Market Estimates & Forecasts, 2018 - 2030 (Kilotons) (USD Million)
6.6.7.3. Market Estimates & Forecasts, By Base Oil, 2018 - 2030 (Kilotons) (USD Million)
6.6.7.4. Market Estimates & Forecasts, By Application, 2018 - 2030 (Kilotons) (USD Million)
6.6.8. Kuwait
6.6.8.1. Key country dynamics
6.6.8.2. Market Estimates & Forecasts, 2018 - 2030 (Kilotons) (USD Million)
6.6.8.3. Market Estimates & Forecasts, By Base Oil, 2018 - 2030 (Kilotons) (USD Million)
6.6.8.4. Market Estimates & Forecasts, By Application, 2018 - 2030 (Kilotons) (USD Million)
6.6.9. Saudi Arabia
6.6.9.1. Key country dynamics
6.6.9.2. Market Estimates & Forecasts, 2018 - 2030 (Kilotons) (USD Million)
6.6.9.3. Market Estimates & Forecasts, By Base Oil, 2018 - 2030 (Kilotons) (USD Million)
6.6.9.4. Market Estimates & Forecasts, By Application, 2018 - 2030 (Kilotons) (USD Million)
6.6.10. South Africa
6.6.10.1. Key country dynamics
6.6.10.2. Market Estimates & Forecasts, 2018 - 2030 (Kilotons) (USD Million)
6.6.10.3. Market Estimates & Forecasts, By Base Oil, 2018 - 2030 (Kilotons) (USD Million)
6.6.10.4. Market Estimates & Forecasts, By Application, 2018 - 2030 (Kilotons) (USD Million)
6.6.11. Angola
6.6.11.1. Key country dynamics
6.6.11.2. Market Estimates & Forecasts, 2018 - 2030 (Kilotons) (USD Million)
6.6.11.3. Market Estimates & Forecasts, By Base Oil, 2018 - 2030 (Kilotons) (USD Million)
6.6.11.4. Market Estimates & Forecasts, By Application, 2018 - 2030 (Kilotons) (USD Million)
6.6.12. Nigeria
6.6.12.1. Key country dynamics
6.6.12.2. Market Estimates & Forecasts, 2018 - 2030 (Kilotons) (USD Million)
6.6.12.3. Market Estimates & Forecasts, By Base Oil, 2018 - 2030 (Kilotons) (USD Million)
6.6.12.4. Market Estimates & Forecasts, By Application, 2018 - 2030 (Kilotons) (USD Million)
6.6.12.5.
Chapter 7. Lubricants Market - Competitive Landscape
7.1. Recent Developments & Impact Analysis, By Key Market Participants
7.2. Company Categorization
7.3. Company Market Share Analysis, 2023
7.4. Company Heat Map Analysis
7.5. Strategy Mapping
7.6. Company Profiles/Listings
7.6.1. ExxonMobil Corp
7.6.1.1. Participant’s overview
7.6.1.2. Financial performance
7.6.1.3. Product benchmarking
7.6.1.4. Recent developments
7.6.2. Royal Dutch Shell Co.
7.6.2.1. Participant’s overview
7.6.2.2. Financial performance
7.6.2.3. Product benchmarking
7.6.2.4. Recent developments
7.6.3. BP Plc
7.6.3.1. Participant’s overview
7.6.3.2. Financial performance
7.6.3.3. Product benchmarking
7.6.3.4. Recent developments
7.6.4. TotalEnergies
7.6.4.1. Participant’s overview
7.6.4.2. Financial performance
7.6.4.3. Product benchmarking
7.6.4.4. Recent developments
7.6.5. Chevron Corporation
7.6.5.1. Participant’s overview
7.6.5.2. Financial performance
7.6.5.3. Product benchmarking
7.6.5.4. Recent developments
7.6.6. Fuchs
7.6.6.1. Participant’s overview
7.6.6.2. Financial performance
7.6.6.3. Product benchmarking
7.6.6.4. Recent developments
7.6.7. Castrol India Ltd.
7.6.7.1. Participant’s overview
7.6.7.2. Financial performance
7.6.7.3. Product benchmarking
7.6.7.4. Recent developments
7.6.8. Amsoil Inc.
7.6.8.1. Participant’s overview
7.6.8.2. Financial performance
7.6.8.3. Product benchmarking
7.6.8.4. Recent developments
7.6.9. JX Nippon Oil & Gas Exploration Corporation
7.6.9.1. Participant’s overview
7.6.9.2. Financial performance
7.6.9.3. Product benchmarking
7.6.9.4. Recent developments
7.6.10. Philipps 66 Company
7.6.10.1. Participant’s overview
7.6.10.2. Financial performance
7.6.10.3. Product benchmarking
7.6.10.4. Recent developments
7.6.11. Valvoline LLC
7.6.11.1. Participant’s overview
7.6.11.2. Financial performance
7.6.11.3. Product benchmarking
7.6.11.4. Recent developments
7.6.12. PetroChina Company Limited
7.6.12.1. Participant’s overview
7.6.12.2. Financial performance
7.6.12.3. Product benchmarking
7.6.12.4. Recent developments
7.6.13. China Petrochemical Corporation
7.6.13.1. Participant’s overview
7.6.13.2. Financial performance
7.6.13.3. Product benchmarking
7.6.13.4. Recent developments
7.6.14. Idemitsu Kosan Co. Ltd
7.6.14.1. Participant’s overview
7.6.14.2. Financial performance
7.6.14.3. Product benchmarking
7.6.14.4. Recent developments
7.6.15. Lukoil
7.6.15.1. Participant’s overview
7.6.15.2. Financial performance
7.6.15.3. Product benchmarking
7.6.15.4. Recent developments
7.6.16. JX Nippon Oil & Energy Corporation
7.6.16.1. Participant’s overview
7.6.16.2. Financial performance
7.6.16.3. Product benchmarking
7.6.16.4. Recent developments
7.6.17. Petrobras
7.6.17.1. Participant’s overview
7.6.17.2. Financial performance
7.6.17.3. Product benchmarking
7.6.17.4. Recent developments
7.6.18. Petronas Lubricant International
7.6.18.1. Participant’s overview
7.6.18.2. Financial performance
7.6.18.3. Product benchmarking
7.6.18.4. Recent developments
7.6.19. Quaker Chemical Corp
7.6.19.1. Participant’s overview
7.6.19.2. Financial performance
7.6.19.3. Product benchmarking
7.6.19.4. Recent developments
7.6.20. PetroFer Chemie
7.6.20.1. Participant’s overview
7.6.20.2. Financial performance
7.6.20.3. Product benchmarking
7.6.20.4. Recent developments
7.6.21. Zeller Gmelin GmbH & Co. KG
7.6.21.1. Participant’s overview
7.6.21.2. Financial performance
7.6.21.3. Product benchmarking
7.6.21.4. Recent developments
7.6.22. Buhmwoo Chemical Co. Ltd.
7.6.22.1. Participant’s overview
7.6.22.2. Financial performance
7.6.22.3. Product benchmarking
7.6.22.4. Recent developments
7.6.23. Blaser Swisslube Inc
7.6.23.1. Participant’s overview
7.6.23.2. Financial performance
7.6.23.3. Product benchmarking
7.6.23.4. Recent developments
List of Tables
Table 1 Lubricants market estimates and forecasts, 2018 - 2030 (USD Million) (Kilotons)
Table 2 Operational/Profit Margin, Top 5 Companies (%)
Table 3 Lubricants Trade Balance, By Key Countries, 2018 - 2022 (Value, USD Thousand)
Table 4 Lubricants Import, By Key Countries, 2018 - 2022 (Volume, Kilotons)
Table 5 Lubricants Import, By Key Countries, 2018 - 2022 (Value; USD Thousand)
Table 6 Lubricants Export, By Key Countries, 2018 - 2022 (Volume; Kilotons)
Table 7 Lubricants Export, By Key Countries, 2018 - 2022 (Value; USD Thousand)
Table 8 Lubricants market estimates and forecasts, by region, 2018 - 2030 (USD Million)
Table 9 Lubricants market estimates and forecasts, by region, 2018 - 2030 (Kilotons)
Table 10 Lubricants market estimates and forecasts, by base oil, 2018 - 2030 (USD Million)
Table 11 Lubricants market estimates and forecasts, by base oil, 2018 - 2030 (Kilotons)
Table 12 Lubricants market estimates and forecasts, by application, 2018 - 2030 (USD Million)
Table 13 Lubricants market estimates and forecasts, by application, 2018 - 2030 (Kilotons)
Table 14 Industrial lubricants market estimates and forecasts, 2018 - 2030 (USD Million)
Table 15 Industrial lubricants market estimates and forecasts, 2018 - 2030 (Kilotons)
Table 16 Automotive lubricants market estimates and forecasts, 2018 - 2030 (USD Million)
Table 17 Automotive lubricants market estimates and forecasts, 2018 - 2030 (Kilotons)
Table 18 Automotive engine oil market estimates and forecasts, 2018 - 2030 (USD Million)
Table 19 Automotive engine oil market estimates and forecasts, 2018 - 2030 (Kilotons)
Table 20 Marine lubricants market estimates and forecasts, 2018 - 2030 (USD Million)
Table 21 Marine lubricants market estimates and forecasts, 2018 - 2030 (Kilotons)
Table 22 Aerospace lubricants market estimates and forecasts, 2018 - 2030 (USD Million)
Table 23 Aerospace lubricants market estimates and forecasts, 2018 - 2030 (Kilotons)
Table 24 North America lubricants market estimates and forecasts, by base oil, 2018 - 2030 (USD Million)
Table 25 North America lubricants market estimates and forecasts, by base oil, 2018 - 2030 (Kilotons)
Table 26 North America lubricants market estimates and forecasts, by application, 2018 - 2030 (USD Million)
Table 27 North America lubricants market estimates and forecasts, by application, 2018 - 2030 (Kilotons)
Table 28 North America industrial lubricants market estimates and forecasts, 2018 - 2030 (USD Million)
Table 29 North America industrial lubricants market estimates and forecasts, 2018 - 2030 (Kilotons)
Table 30 North America automotive lubricants market estimates and forecasts, 2018 - 2030 (USD Million)
Table 31 North America automotive lubricants market estimates and forecasts, 2018 - 2030 (Kilotons)
Table 32 North America automotive engine oil market estimates and forecasts, 2018 - 2030 (USD Million)
Table 33 North America automotive engine oil market estimates and forecasts, 2018 - 2030 (Kilotons)
Table 34 North America marine lubricants market estimates and forecasts, 2018 - 2030 (USD Million)
Table 35 North America marine lubricants market estimates and forecasts, 2018 - 2030 (Kilotons)
Table 36 North America aerospace lubricants market estimates and forecasts, 2018 - 2030 (USD Million)
Table 37 North America aerospace lubricants market estimates and forecasts, 2018 - 2030 (Kilotons)
Table 38 U.S. lubricants market estimates and forecasts, by base oil, 2018 - 2030 (USD Million)
Table 39 U.S. lubricants market estimates and forecasts, by base oil, 2018 - 2030 (Kilotons)
Table 40 U.S. lubricants market estimates and forecasts, by application, 2018 - 2030 (USD Million)
Table 41 U.S. lubricants market estimates and forecasts, by application, 2018 - 2030 (Kilotons)
Table 42 U.S. industrial lubricants market estimates and forecasts, 2018 - 2030 (USD Million)
Table 43 U.S. industrial lubricants market estimates and forecasts, 2018 - 2030 (Kilotons)
Table 44 U.S. automotive lubricants market estimates and forecasts, 2018 - 2030 (USD Million)
Table 45 U.S. automotive lubricants market estimates and forecasts, 2018 - 2030 (Kilotons)
Table 46 U.S. automotive engine oil market estimates and forecasts, 2018 - 2030 (USD Million)
Table 47 U.S. automotive engine oil market estimates and forecasts, 2018 - 2030 (Kilotons)
Table 48 U.S. marine lubricants market estimates and forecasts, 2018 - 2030 (USD Million)
Table 49 U.S. marine lubricants market estimates and forecasts, 2018 - 2030 (Kilotons)
Table 50 U.S. aerospace lubricants market estimates and forecasts, 2018 - 2030 (USD Million)
Table 51 U.S. aerospace lubricants market estimates and forecasts, 2018 - 2030 (Kilotons)
Table 52 Canada lubricants market estimates and forecasts, by base oil, 2018 - 2030 (USD Million)
Table 53 Canada lubricants market estimates and forecasts, by base oil, 2018 - 2030 (Kilotons)
Table 54 Canada lubricants market estimates and forecasts, by application, 2018 - 2030 (USD Million)
Table 55 Canada lubricants market estimates and forecasts, by application, 2018 - 2030 (Kilotons)
Table 56 Canada industrial lubricants market estimates and forecasts, 2018 - 2030 (USD Million)
Table 57 Canada industrial lubricants market estimates and forecasts, 2018 - 2030 (Kilotons)
Table 58 Canada automotive lubricants market estimates and forecasts, 2018 - 2030 (USD Million)
Table 59 Canada automotive lubricants market estimates and forecasts, 2018 - 2030 (Kilotons)
Table 60 Canada automotive engine oil market estimates and forecasts, 2018 - 2030 (USD Million)
Table 61 Canada automotive engine oil market estimates and forecasts, 2018 - 2030 (Kilotons)
Table 62 Canada marine lubricants market estimates and forecasts, 2018 - 2030 (USD Million)
Table 63 Canada marine lubricants market estimates and forecasts, 2018 - 2030 (Kilotons)
Table 64 Canada aerospace lubricants market estimates and forecasts, 2018 - 2030 (USD Million)
Table 65 Canada aerospace lubricants market estimates and forecasts, 2018 - 2030 (Kilotons)
Table 66 Mexico lubricants market estimates and forecasts, by base oil, 2018 - 2030 (USD Million)
Table 67 Mexico lubricants market estimates and forecasts, by base oil, 2018 - 2030 (Kilotons)
Table 68 Mexico lubricants market estimates and forecasts, by application, 2018 - 2030 (USD Million)
Table 69 Mexico lubricants market estimates and forecasts, by application, 2018 - 2030 (Kilotons)
Table 70 Mexico industrial lubricants market estimates and forecasts, 2018 - 2030 (USD Million)
Table 71 Mexico industrial lubricants market estimates and forecasts, 2018 - 2030 (Kilotons)
Table 72 Mexico automotive lubricants market estimates and forecasts, 2018 - 2030 (USD Million)
Table 73 Mexico automotive lubricants market estimates and forecasts, 2018 - 2030 (Kilotons)
Table 74 Mexico automotive engine oil market estimates and forecasts, 2018 - 2030 (USD Million)
Table 75 Mexico automotive engine oil market estimates and forecasts, 2018 - 2030 (Kilotons)
Table 76 Mexico marine lubricants market estimates and forecasts, 2018 - 2030 (USD Million)
Table 77 Mexico marine lubricants market estimates and forecasts, 2018 - 2030 (Kilotons)
Table 78 Mexico aerospace lubricants market estimates and forecasts, 2018 - 2030 (USD Million)
Table 79 Mexico aerospace lubricants market estimates and forecasts, 2018 - 2030 (Kilotons)
Table 80 Europe lubricants market estimates and forecasts, by base oil, 2018 - 2030 (USD Million)
Table 81 Europe lubricants market estimates and forecasts, by base oil, 2018 - 2030 (Kilotons)
Table 82 Europe lubricants market estimates and forecasts, by application, 2018 - 2030 (USD Million)
Table 83 Europe lubricants market estimates and forecasts, by application, 2018 - 2030 (Kilotons)
Table 84 Europe industrial lubricants market estimates and forecasts, 2018 - 2030 (USD Million)
Table 85 Europe industrial lubricants market estimates and forecasts, 2018 - 2030 (Kilotons)
Table 86 Europe automotive lubricants market estimates and forecasts, 2018 - 2030 (USD Million)
Table 87 Europe automotive lubricants market estimates and forecasts, 2018 - 2030 (Kilotons)
Table 88 Europe automotive engine oil market estimates and forecasts, 2018 - 2030 (USD Million)
Table 89 Europe automotive engine oil market estimates and forecasts, 2018 - 2030 (Kilotons)
Table 90 Europe marine lubricants market estimates and forecasts, 2018 - 2030 (USD Million)
Table 91 Europe marine lubricants market estimates and forecasts, 2018 - 2030 (Kilotons)
Table 92 Europe aerospace lubricants market estimates and forecasts, 2018 - 2030 (USD Million)
Table 93 Europe aerospace lubricants market estimates and forecasts, 2018 - 2030 (Kilotons)
Table 94 Germany lubricants market estimates and forecasts, by base oil, 2018 - 2030 (USD Million)
Table 95 Germany lubricants market estimates and forecasts, by base oil, 2018 - 2030 (Kilotons)
Table 96 Germany lubricants market estimates and forecasts, by application, 2018 - 2030 (USD Million)
Table 97 Germany lubricants market estimates and forecasts, by application, 2018 - 2030 (Kilotons)
Table 98 Germany industrial lubricants market estimates and forecasts, 2018 - 2030 (USD Million)
Table 99 Germany industrial lubricants market estimates and forecasts, 2018 - 2030 (Kilotons)
Table 100 Germany automotive lubricants market estimates and forecasts, 2018 - 2030 (USD Million)
Table 101 Germany automotive lubricants market estimates and forecasts, 2018 - 2030 (Kilotons)
Table 102 Germany automotive engine oil market estimates and forecasts, 2018 - 2030 (USD Million)
Table 103 Germany automotive engine oil market estimates and forecasts, 2018 - 2030 (Kilotons)
Table 104 Germany marine lubricants market estimates and forecasts, 2018 - 2030 (USD Million)
Table 105 Germany marine lubricants market estimates and forecasts, 2018 - 2030 (Kilotons)
Table 106 Germany Europe aerospace lubricants market estimates and forecasts, 2018 - 2030 (Kilotons)
Table 107 UK lubricants market estimates and forecasts, by base oil, 2018 - 2030 (USD Million)
Table 108 UK lubricants market estimates and forecasts, by base oil, 2018 - 2030 (Kilotons)
Table 109 UK lubricants market estimates and forecasts, by application, 2018 - 2030 (USD Million)
Table 110 UK lubricants market estimates and forecasts, by application, 2018 - 2030 (Kilotons)
Table 111 UK Europe industrial lubricants market estimates and forecasts, 2018 - 2030 (Kilotons)
Table 112 UK automotive lubricants market estimates and forecasts, 2018 - 2030 (USD Million)
Table 113 UK automotive lubricants market estimates and forecasts, 2018 - 2030 (Kilotons)
Table 114 UK Europe automotive engine oil market estimates and forecasts, 2018 - 2030 (Kilotons)
Table 115 UK marine lubricants market estimates and forecasts, 2018 - 2030 (USD Million)
Table 116 UK marine lubricants market estimates and forecasts, 2018 - 2030 (Kilotons)
Table 117 UK aerospace lubricants market estimates and forecasts, 2018 - 2030 (USD Million)
Table 118 UK aerospace lubricants market estimates and forecasts, 2018 - 2030 (Kilotons)
Table 119 Switzerland lubricants market estimates and forecasts, by base oil, 2018 - 2030 (USD Million)
Table 120 Switzerland lubricants market estimates and forecasts, by base oil, 2018 - 2030 (Kilotons)
Table 121 Switzerland lubricants market estimates and forecasts, by application, 2018 - 2030 (USD Million)
Table 122 Switzerland lubricants market estimates and forecasts, by application, 2018 - 2030 (Kilotons)
Table 123 Switzerland industrial lubricants market estimates and forecasts, 2018 - 2030 (USD Million)
Table 124 Switzerland industrial lubricants market estimates and forecasts, 2018 - 2030 (Kilotons)
Table 125 Switzerland automotive lubricants market estimates and forecasts, 2018 - 2030 (USD Million)
Table 126 Switzerland automotive lubricants market estimates and forecasts, 2018 - 2030 (Kilotons)
Table 127 Switzerland automotive engine oil market estimates and forecasts, 2018 - 2030 (USD Million)
Table 128 Switzerland automotive engine oil market estimates and forecasts, 2018 - 2030 (Kilotons)
Table 129 Switzerland marine lubricants market estimates and forecasts, 2018 - 2030 (USD Million)
Table 130 Switzerland marine lubricants market estimates and forecasts, 2018 - 2030 (Kilotons)
Table 131 Switzerland aerospace lubricants market estimates and forecasts, 2018 - 2030 (USD Million)
Table 132 Switzerland aerospace lubricants market estimates and forecasts, 2018 - 2030 (Kilotons)
Table 133 France lubricants market estimates and forecasts, by base oil, 2018 - 2030 (USD Million)
Table 134 France lubricants market estimates and forecasts, by base oil, 2018 - 2030 (Kilotons)
Table 135 France lubricants market estimates and forecasts, by application, 2018 - 2030 (USD Million)
Table 136 France lubricants market estimates and forecasts, by application, 2018 - 2030 (Kilotons)
Table 137 E France urope industrial lubricants market estimates and forecasts, 2018 - 2030 (USD Million)
Table 138 France industrial lubricants market estimates and forecasts, 2018 - 2030 (Kilotons)
Table 139 France automotive lubricants market estimates and forecasts, 2018 - 2030 (USD Million)
Table 140 France automotive lubricants market estimates and forecasts, 2018 - 2030 (Kilotons)
Table 141 France automotive engine oil market estimates and forecasts, 2018 - 2030 (USD Million)
Table 142 France automotive engine oil market estimates and forecasts, 2018 - 2030 (Kilotons)
Table 143 France marine lubricants market estimates and forecasts, 2018 - 2030 (USD Million)
Table 144 France marine lubricants market estimates and forecasts, 2018 - 2030 (Kilotons)
Table 145 France aerospace lubricants market estimates and forecasts, 2018 - 2030 (USD Million)
Table 146 France aerospace lubricants market estimates and forecasts, 2018 - 2030 (Kilotons)
Table 147 Russia lubricants market estimates and forecasts, by base oil, 2018 - 2030 (USD Million)
Table 148 Russia lubricants market estimates and forecasts, by base oil, 2018 - 2030 (Kilotons)
Table 149 Russia lubricants market estimates and forecasts, by application, 2018 - 2030 (USD Million)
Table 150 Russia lubricants market estimates and forecasts, by application, 2018 - 2030 (Kilotons)
Table 151 Russia industrial lubricants market estimates and forecasts, 2018 - 2030 (USD Million)
Table 152 Russia industrial lubricants market estimates and forecasts, 2018 - 2030 (Kilotons)
Table 153 Russia automotive lubricants market estimates and forecasts, 2018 - 2030 (USD Million)
Table 154 Russia automotive lubricants market estimates and forecasts, 2018 - 2030 (Kilotons)
Table 155 Russia automotive engine oil market estimates and forecasts, 2018 - 2030 (USD Million)
Table 156 Russia automotive engine oil market estimates and forecasts, 2018 - 2030 (Kilotons)
Table 157 Russia marine lubricants market estimates and forecasts, 2018 - 2030 (USD Million)
Table 158 Russia marine lubricants market estimates and forecasts, 2018 - 2030 (Kilotons)
Table 159 Russia aerospace lubricants market estimates and forecasts, 2018 - 2030 (USD Million)
Table 160 Russia aerospace lubricants market estimates and forecasts, 2018 - 2030 (Kilotons)
Table 161 Italy lubricants market estimates and forecasts, by base oil, 2018 - 2030 (USD Million)
Table 162 Italy lubricants market estimates and forecasts, by base oil, 2018 - 2030 (Kilotons)
Table 163 Italy lubricants market estimates and forecasts, by application, 2018 - 2030 (USD Million)
Table 164 Italy lubricants market estimates and forecasts, by application, 2018 - 2030 (Kilotons)
Table 165 Italy industrial lubricants market estimates and forecasts, 2018 - 2030 (USD Million)
Table 166 Italy industrial lubricants market estimates and forecasts, 2018 - 2030 (Kilotons)
Table 167 Italy automotive lubricants market estimates and forecasts, 2018 - 2030 (USD Million)
Table 168 Italy automotive lubricants market estimates and forecasts, 2018 - 2030 (Kilotons)
Table 169 Italy automotive engine oil market estimates and forecasts, 2018 - 2030 (USD Million)
Table 170 Italy automotive engine oil market estimates and forecasts, 2018 - 2030 (Kilotons)
Table 171 Italy marine lubricants market estimates and forecasts, 2018 - 2030 (USD Million)
Table 172 Italy marine lubricants market estimates and forecasts, 2018 - 2030 (Kilotons)
Table 173 Italy aerospace lubricants market estimates and forecasts, 2018 - 2030 (USD Million)
Table 174 Italy aerospace lubricants market estimates and forecasts, 2018 - 2030 (Kilotons)
Table 175 Spain lubricants market estimates and forecasts, by base oil, 2018 - 2030 (USD Million)
Table 176 Spain lubricants market estimates and forecasts, by base oil, 2018 - 2030 (Kilotons)
Table 177 Spain lubricants market estimates and forecasts, by application, 2018 - 2030 (USD Million)
Table 178 Spain lubricants market estimates and forecasts, by application, 2018 - 2030 (Kilotons)
Table 179 Spain industrial lubricants market estimates and forecasts, 2018 - 2030 (USD Million)
Table 180 Spain industrial lubricants market estimates and forecasts, 2018 - 2030 (Kilotons)
Table 181 Spain automotive lubricants market estimates and forecasts, 2018 - 2030 (USD Million)
Table 182 Spain automotive lubricants market estimates and forecasts, 2018 - 2030 (Kilotons)
Table 183 Spain automotive engine oil market estimates and forecasts, 2018 - 2030 (USD Million)
Table 184 Spain automotive engine oil market estimates and forecasts, 2018 - 2030 (Kilotons)
Table 185 Spain marine lubricants market estimates and forecasts, 2018 - 2030 (USD Million)
Table 186 Spain marine lubricants market estimates and forecasts, 2018 - 2030 (Kilotons)
Table 187 Spain aerospace lubricants market estimates and forecasts, 2018 - 2030 (USD Million)
Table 188 Spain aerospace lubricants market estimates and forecasts, 2018 - 2030 (Kilotons)
Table 189 The Netherlands lubricants market estimates and forecasts, by base oil, 2018 - 2030 (USD Million)
Table 190 The Netherlands lubricants market estimates and forecasts, by base oil, 2018 - 2030 (Kilotons)
Table 191 The Netherlands lubricants market estimates and forecasts, by application, 2018 - 2030 (USD Million)
Table 192 The Netherlands lubricants market estimates and forecasts, by application, 2018 - 2030 (Kilotons)
Table 193 The Netherlands industrial lubricants market estimates and forecasts, 2018 - 2030 (USD Million)
Table 194 The Netherlands industrial lubricants market estimates and forecasts, 2018 - 2030 (Kilotons)
Table 195 The Netherlands automotive lubricants market estimates and forecasts, 2018 - 2030 (USD Million)
Table 196 The Netherlands automotive lubricants market estimates and forecasts, 2018 - 2030 (Kilotons)
Table 197 The Netherlands automotive engine oil market estimates and forecasts, 2018 - 2030 (USD Million)
Table 198 The Netherlands automotive engine oil market estimates and forecasts, 2018 - 2030 (Kilotons)
Table 199 The Netherlands Europe marine lubricants market estimates and forecasts, 2018 - 2030 (Kilotons)
Table 200 The Netherlands aerospace lubricants market estimates and forecasts, 2018 - 2030 (USD Million)
Table 201 The Netherlands aerospace lubricants market estimates and forecasts, 2018 - 2030 (Kilotons)
Table 202 Asia Pacific lubricants market estimates and forecasts, by base oil, 2018 - 2030 (USD Million)
Table 203 Asia Pacific lubricants market estimates and forecasts, by base oil, 2018 - 2030 (Kilotons)
Table 204 Asia Pacific lubricants market estimates and forecasts, by application, 2018 - 2030 (USD Million)
Table 205 Asia Pacific lubricants market estimates and forecasts, by application, 2018 - 2030 (Kilotons)
Table 206 Asia Pacific lubricants market estimates and forecasts, by industrial, 2018 - 2030 (USD Million)
Table 207 Asia Pacific industrial lubricants market estimates and forecasts, 2018 - 2030 (USD Million)
Table 208 Asia Pacific industrial lubricants market estimates and forecasts, 2018 - 2030 (Kilotons)
Table 209 Asia Pacific automotive lubricants market estimates and forecasts, 2018 - 2030 (USD Million)
Table 210 Asia Pacific automotive lubricants market estimates and forecasts, 2018 - 2030 (Kilotons)
Table 211 Asia Pacific automotive engine oil market estimates and forecasts, 2018 - 2030 (USD Million)
Table 212 Asia Pacific automotive engine oil market estimates and forecasts, 2018 - 2030 (Kilotons)
Table 213 Asia Pacific marine lubricants market estimates and forecasts, 2018 - 2030 (USD Million)
Table 214 Asia Pacific marine lubricants market estimates and forecasts, 2018 - 2030 (Kilotons)
Table 215 Asia Pacific aerospace lubricants market estimates and forecasts, 2018 - 2030 (USD Million)
Table 216 Asia Pacific aerospace lubricants market estimates and forecasts, 2018 - 2030 (Kilotons)
Table 217 China lubricants market estimates and forecasts, by base oil, 2018 - 2030 (USD Million)
Table 218 China lubricants market estimates and forecasts, by base oil, 2018 - 2030 (Kilotons)
Table 219 China lubricants market estimates and forecasts, by application, 2018 - 2030 (USD Million)
Table 220 China lubricants market estimates and forecasts, by application, 2018 - 2030 (Kilotons)
Table 221 China industrial lubricants market estimates and forecasts, 2018 - 2030 (USD Million)
Table 222 China industrial lubricants market estimates and forecasts, 2018 - 2030 (Kilotons)
Table 223 China automotive lubricants market estimates and forecasts, 2018 - 2030 (USD Million)
Table 224 China automotive lubricants market estimates and forecasts, 2018 - 2030 (Kilotons)
Table 225 China automotive engine oil market estimates and forecasts, 2018 - 2030 (USD Million)
Table 226 China automotive engine oil market estimates and forecasts, 2018 - 2030 (Kilotons)
Table 227 China marine lubricants market estimates and forecasts, 2018 - 2030 (USD Million)
Table 228 China marine lubricants market estimates and forecasts, 2018 - 2030 (Kilotons)
Table 229 China aerospace lubricants market estimates and forecasts, 2018 - 2030 (USD Million)
Table 230 China aerospace lubricants market estimates and forecasts, 2018 - 2030 (Kilotons)
Table 231 India lubricants market estimates and forecasts, by base oil, 2018 - 2030 (USD Million)
Table 232 India lubricants market estimates and forecasts, by base oil, 2018 - 2030 (Kilotons)
Table 233 India lubricants market estimates and forecasts, by application, 2018 - 2030 (USD Million)
Table 234 India lubricants market estimates and forecasts, by application, 2018 - 2030 (Kilotons)
Table 235 India industrial lubricants market estimates and forecasts, 2018 - 2030 (USD Million)
Table 236 India industrial lubricants market estimates and forecasts, 2018 - 2030 (Kilotons)
Table 237 India automotive lubricants market estimates and forecasts, 2018 - 2030 (USD Million)
Table 238 India automotive lubricants market estimates and forecasts, 2018 - 2030 (Kilotons)
Table 239 India automotive engine oil market estimates and forecasts, 2018 - 2030 (USD Million)
Table 240 India automotive engine oil market estimates and forecasts, 2018 - 2030 (Kilotons)
Table 241 India marine lubricants market estimates and forecasts, 2018 - 2030 (USD Million)
Table 242 India marine lubricants market estimates and forecasts, 2018 - 2030 (Kilotons)
Table 243 India aerospace lubricants market estimates and forecasts, 2018 - 2030 (USD Million)
Table 244 India aerospace lubricants market estimates and forecasts, 2018 - 2030 (Kilotons)
Table 245 Japan lubricants market estimates and forecasts, by base oil, 2018 - 2030 (USD Million)
Table 246 Japan lubricants market estimates and forecasts, by base oil, 2018 - 2030 (Kilotons)
Table 247 Japan lubricants market estimates and forecasts, by application, 2018 - 2030 (USD Million)
Table 248 Japan lubricants market estimates and forecasts, by application, 2018 - 2030 (Kilotons)
Table 249 Japan industrial lubricants market estimates and forecasts, 2018 - 2030 (USD Million)
Table 250 Japan industrial lubricants market estimates and forecasts, 2018 - 2030 (Kilotons)
Table 251 Japan automotive lubricants market estimates and forecasts, 2018 - 2030 (USD Million)
Table 252 Japan automotive lubricants market estimates and forecasts, 2018 - 2030 (Kilotons)
Table 253 Japan automotive engine oil market estimates and forecasts, 2018 - 2030 (USD Million)
Table 254 Japan automotive engine oil market estimates and forecasts, 2018 - 2030 (Kilotons)
Table 255 Japan marine lubricants market estimates and forecasts, 2018 - 2030 (USD Million)
Table 256 Japan marine lubricants market estimates and forecasts, 2018 - 2030 (Kilotons)
Table 257 Japan aerospace lubricants market estimates and forecasts, 2018 - 2030 (USD Million)
Table 258 Japan aerospace lubricants market estimates and forecasts, 2018 - 2030 (Kilotons)
Table 259 South Korea lubricants market estimates and forecasts, by base oil, 2018 - 2030 (USD Million)
Table 260 South Korea lubricants market estimates and forecasts, by base oil, 2018 - 2030 (Kilotons)
Table 261 South Korea lubricants market estimates and forecasts, by application, 2018 - 2030 (USD Million)
Table 262 South Korea lubricants market estimates and forecasts, by application, 2018 - 2030 (Kilotons)
Table 263 South Korea industrial lubricants market estimates and forecasts, 2018 - 2030 (USD Million)
Table 264 South Korea industrial lubricants market estimates and forecasts, 2018 - 2030 (Kilotons)
Table 265 South Korea automotive lubricants market estimates and forecasts, 2018 - 2030 (USD Million)
Table 266 South Korea automotive lubricants market estimates and forecasts, 2018 - 2030 (Kilotons)
Table 267 South Korea automotive engine oil market estimates and forecasts, 2018 - 2030 (USD Million)
Table 268 South Korea automotive engine oil market estimates and forecasts, 2018 - 2030 (Kilotons)
Table 269 South Korea marine lubricants market estimates and forecasts, 2018 - 2030 (USD Million)
Table 270 South Korea marine lubricants market estimates and forecasts, 2018 - 2030 (Kilotons)
Table 271 South Korea aerospace lubricants market estimates and forecasts, 2018 - 2030 (USD Million)
Table 272 South Korea aerospace lubricants market estimates and forecasts, 2018 - 2030 (Kilotons)
Table 273 Malaysia lubricants market estimates and forecasts, by base oil, 2018 - 2030 (USD Million)
Table 274 Malaysia lubricants market estimates and forecasts, by base oil, 2018 - 2030 (Kilotons)
Table 275 Malaysia lubricants market estimates and forecasts, by application, 2018 - 2030 (USD Million)
Table 276 Malaysia lubricants market estimates and forecasts, by application, 2018 - 2030 (Kilotons)
Table 277 Malaysia industrial lubricants market estimates and forecasts, 2018 - 2030 (USD Million)
Table 278 Malaysia industrial lubricants market estimates and forecasts, 2018 - 2030 (Kilotons)
Table 279 Malaysia automotive lubricants market estimates and forecasts, 2018 - 2030 (USD Million)
Table 280 Malaysia automotive lubricants market estimates and forecasts, 2018 - 2030 (Kilotons)
Table 281 Malaysia automotive engine oil market estimates and forecasts, 2018 - 2030 (USD Million)
Table 282 Malaysia automotive engine oil market estimates and forecasts, 2018 - 2030 (Kilotons)
Table 283 Malaysia marine lubricants market estimates and forecasts, 2018 - 2030 (USD Million)
Table 284 Malaysia marine lubricants market estimates and forecasts, 2018 - 2030 (Kilotons)
Table 285 Malaysia aerospace lubricants market estimates and forecasts, 2018 - 2030 (USD Million)
Table 286 Malaysia aerospace lubricants market estimates and forecasts, 2018 - 2030 (Kilotons)
Table 287 Indonesia lubricants market estimates and forecasts, by base oil, 2018 - 2030 (USD Million)
Table 288 Indonesia lubricants market estimates and forecasts, by base oil, 2018 - 2030 (Kilotons)
Table 289 Indonesia lubricants market estimates and forecasts, by application, 2018 - 2030 (USD Million)
Table 290 Indonesia lubricants market estimates and forecasts, by application, 2018 - 2030 (Kilotons)
Table 291 Indonesia industrial lubricants market estimates and forecasts, 2018 - 2030 (USD Million)
Table 292 Indonesia industrial lubricants market estimates and forecasts, 2018 - 2030 (Kilotons)
Table 293 Indonesia automotive lubricants market estimates and forecasts, 2018 - 2030 (USD Million)
Table 294 Indonesia automotive lubricants market estimates and forecasts, 2018 - 2030 (Kilotons)
Table 295 Indonesia automotive engine oil market estimates and forecasts, 2018 - 2030 (USD Million)
Table 296 Indonesia automotive engine oil market estimates and forecasts, 2018 - 2030 (Kilotons)
Table 297 Indonesia marine lubricants market estimates and forecasts, 2018 - 2030 (USD Million)
Table 298 Indonesia marine lubricants market estimates and forecasts, 2018 - 2030 (Kilotons)
Table 299 Indonesia aerospace lubricants market estimates and forecasts, 2018 - 2030 (USD Million)
Table 300 Indonesia aerospace lubricants market estimates and forecasts, 2018 - 2030 (Kilotons)
Table 301 Vietnam lubricants market estimates and forecasts, by base oil, 2018 - 2030 (USD Million)
Table 302 Vietnam lubricants market estimates and forecasts, by base oil, 2018 - 2030 (Kilotons)
Table 303 Vietnam lubricants market estimates and forecasts, by application, 2018 - 2030 (USD Million)
Table 304 Vietnam lubricants market estimates and forecasts, by application, 2018 - 2030 (Kilotons)
Table 305 Vietnam industrial lubricants market estimates and forecasts, 2018 - 2030 (USD Million)
Table 306 Vietnam industrial lubricants market estimates and forecasts, 2018 - 2030 (Kilotons)
Table 307 Vietnam automotive lubricants market estimates and forecasts, 2018 - 2030 (USD Million)
Table 308 Vietnam automotive lubricants market estimates and forecasts, 2018 - 2030 (Kilotons)
Table 309 Vietnam automotive engine oil market estimates and forecasts, 2018 - 2030 (USD Million)
Table 310 Europe automotive engine oil market estimates and forecasts, 2018 - 2030 (Kilotons)
Table 311 Vietnam marine lubricants market estimates and forecasts, 2018 - 2030 (USD Million)
Table 312 Vietnam marine lubricants market estimates and forecasts, 2018 - 2030 (Kilotons)
Table 313 Vietnam aerospace lubricants market estimates and forecasts, 2018 - 2030 (USD Million)
Table 314 Vietnam aerospace lubricants market estimates and forecasts, 2018 - 2030 (Kilotons)
Table 315 Australia lubricants market estimates and forecasts, by base oil, 2018 - 2030 (USD Million)
Table 316 Australia lubricants market estimates and forecasts, by base oil, 2018 - 2030 (Kilotons)
Table 317 Australia lubricants market estimates and forecasts, by application, 2018 - 2030 (USD Million)
Table 318 Australia lubricants market estimates and forecasts, by application, 2018 - 2030 (Kilotons)
Table 319 Australia industrial lubricants market estimates and forecasts, 2018 - 2030 (USD Million)
Table 320 Australia industrial lubricants market estimates and forecasts, 2018 - 2030 (Kilotons)
Table 321 Australia automotive lubricants market estimates and forecasts, 2018 - 2030 (USD Million)
Table 322 Australia automotive lubricants market estimates and forecasts, 2018 - 2030 (Kilotons)
Table 323 Australia automotive engine oil market estimates and forecasts, 2018 - 2030 (USD Million)
Table 324 Australia automotive engine oil market estimates and forecasts, 2018 - 2030 (Kilotons)
Table 325 Australia marine lubricants market estimates and forecasts, 2018 - 2030 (USD Million)
Table 326 Australia marine lubricants market estimates and forecasts, 2018 - 2030 (Kilotons)
Table 327 Australia aerospace lubricants market estimates and forecasts, 2018 - 2030 (USD Million)
Table 328 Australia aerospace lubricants market estimates and forecasts, 2018 - 2030 (Kilotons)
Table 329 New Zealand lubricants market estimates and forecasts, by base oil, 2018 - 2030 (USD Million)
Table 330 New Zealand lubricants market estimates and forecasts, by base oil, 2018 - 2030 (Kilotons)
Table 331 New Zealand lubricants market estimates and forecasts, by application, 2018 - 2030 (USD Million)
Table 332 New Zealand lubricants market estimates and forecasts, by application, 2018 - 2030 (Kilotons)
Table 333 New Zealand industrial lubricants market estimates and forecasts, 2018 - 2030 (USD Million)
Table 334 New Zealand industrial lubricants market estimates and forecasts, 2018 - 2030 (Kilotons)
Table 335 New Zealand automotive lubricants market estimates and forecasts, 2018 - 2030 (USD Million)
Table 336 New Zealand automotive lubricants market estimates and forecasts, 2018 - 2030 (Kilotons)
Table 337 New Zealand automotive engine oil market estimates and forecasts, 2018 - 2030 (USD Million)
Table 338 New Zealand automotive engine oil market estimates and forecasts, 2018 - 2030 (Kilotons)
Table 339 New Zealand marine lubricants market estimates and forecasts, 2018 - 2030 (USD Million)
Table 340 New Zealand marine lubricants market estimates and forecasts, 2018 - 2030 (Kilotons)
Table 341 New Zealand aerospace lubricants market estimates and forecasts, 2018 - 2030 (USD Million)
Table 342 New Zealand aerospace lubricants market estimates and forecasts, 2018 - 2030 (Kilotons)
Table 343 Kyrgyztan lubricants market estimates and forecasts, by base oil, 2018 - 2030 (USD Million)
Table 344 Kyrgyztan lubricants market estimates and forecasts, by base oil, 2018 - 2030 (Kilotons)
Table 345 Kyrgyztan lubricants market estimates and forecasts, by application, 2018 - 2030 (USD Million)
Table 346 Kyrgyztan lubricants market estimates and forecasts, by application, 2018 - 2030 (Kilotons)
Table 347 Kyrgyztan industrial lubricants market estimates and forecasts, 2018 - 2030 (USD Million)
Table 348 Kyrgyztan industrial lubricants market estimates and forecasts, 2018 - 2030 (Kilotons)
Table 349 Kyrgyztan automotive lubricants market estimates and forecasts, 2018 - 2030 (USD Million)
Table 350 Kyrgyztan automotive lubricants market estimates and forecasts, 2018 - 2030 (Kilotons)
Table 351 Kyrgyztan automotive engine oil market estimates and forecasts, 2018 - 2030 (USD Million)
Table 352 Kyrgyztan automotive engine oil market estimates and forecasts, 2018 - 2030 (Kilotons)
Table 353 Kyrgyztan marine lubricants market estimates and forecasts, 2018 - 2030 (USD Million)
Table 354 Kyrgyztan marine lubricants market estimates and forecasts, 2018 - 2030 (Kilotons)
Table 355 Kyrgyztan aerospace lubricants market estimates and forecasts, 2018 - 2030 (USD Million)
Table 356 Kyrgyztan aerospace lubricants market estimates and forecasts, 2018 - 2030 (Kilotons)
Table 357 Central & South America lubricants market estimates and forecasts, by base oil, 2018 - 2030 (USD Million)
Table 358 Central & South America lubricants market estimates and forecasts, by base oil, 2018 - 2030 (Kilotons)
Table 359 Central & South America lubricants market estimates and forecasts, by application, 2018 - 2030 (USD Million)
Table 360 Central & South America lubricants market estimates and forecasts, by application, 2018 - 2030 (Kilotons)
Table 361 Central & South America industrial lubricants market estimates and forecasts, 2018 - 2030 (USD Million)
Table 362 Central & South America industrial lubricants market estimates and forecasts, 2018 - 2030 (Kilotons)
Table 363 Central & South America automotive lubricants market estimates and forecasts, 2018 - 2030 (USD Million)
Table 364 Central & South America automotive lubricants market estimates and forecasts, 2018 - 2030 (Kilotons)
Table 365 Central & South America automotive engine oil market estimates and forecasts, 2018 - 2030 (USD Million)
Table 366 Central & South America automotive engine oil market estimates and forecasts, 2018 - 2030 (Kilotons)
Table 367 Central & South America marine lubricants market estimates and forecasts, 2018 - 2030 (USD Million)
Table 368 Central & South America marine lubricants market estimates and forecasts, 2018 - 2030 (Kilotons)
Table 369 Central & South America aerospace lubricants market estimates and forecasts, 2018 - 2030 (USD Million)
Table 370 Central & South America aerospace lubricants market estimates and forecasts, 2018 - 2030 (Kilotons)
Table 371 Brazil lubricants market estimates and forecasts, by base oil, 2018 - 2030 (USD Million)
Table 372 Brazil lubricants market estimates and forecasts, by base oil, 2018 - 2030 (Kilotons)
Table 373 Brazil lubricants market estimates and forecasts, by application, 2018 - 2030 (USD Million)
Table 374 Brazil lubricants market estimates and forecasts, by application, 2018 - 2030 (Kilotons)
Table 375 Brazil industrial lubricants market estimates and forecasts, 2018 - 2030 (USD Million)
Table 376 Brazil industrial lubricants market estimates and forecasts, 2018 - 2030 (Kilotons)
Table 377 Brazil automotive lubricants market estimates and forecasts, 2018 - 2030 (USD Million)
Table 378 Brazil automotive lubricants market estimates and forecasts, 2018 - 2030 (Kilotons)
Table 379 Brazil automotive engine oil market estimates and forecasts, 2018 - 2030 (USD Million)
Table 380 Brazil automotive engine oil market estimates and forecasts, 2018 - 2030 (Kilotons)
Table 381 Brazil marine lubricants market estimates and forecasts, 2018 - 2030 (USD Million)
Table 382 Brazil marine lubricants market estimates and forecasts, 2018 - 2030 (Kilotons)
Table 383 Brazil aerospace lubricants market estimates and forecasts, 2018 - 2030 (USD Million)
Table 384 Brazil aerospace lubricants market estimates and forecasts, 2018 - 2030 (Kilotons)
Table 385 Argentina lubricants market estimates and forecasts, by base oil, 2018 - 2030 (USD Million)
Table 386 Argentina lubricants market estimates and forecasts, by base oil, 2018 - 2030 (Kilotons)
Table 387 Argentina lubricants market estimates and forecasts, by application, 2018 - 2030 (USD Million)
Table 388 Argentina lubricants market estimates and forecasts, by application, 2018 - 2030 (Kilotons)
Table 389 Argentina industrial lubricants market estimates and forecasts, 2018 - 2030 (USD Million)
Table 390 Argentina industrial lubricants market estimates and forecasts, 2018 - 2030 (Kilotons)
Table 391 Argentina automotive lubricants market estimates and forecasts, 2018 - 2030 (USD Million)
Table 392 Argentina automotive lubricants market estimates and forecasts, 2018 - 2030 (Kilotons)
Table 393 Argentina automotive engine oil market estimates and forecasts, 2018 - 2030 (USD Million)
Table 394 Argentina automotive engine oil market estimates and forecasts, 2018 - 2030 (Kilotons)
Table 395 Argentina marine lubricants market estimates and forecasts, 2018 - 2030 (USD Million)
Table 396 Argentina marine lubricants market estimates and forecasts, 2018 - 2030 (Kilotons)
Table 397 Argentina aerospace lubricants market estimates and forecasts, 2018 - 2030 (USD Million)
Table 398 Argentina aerospace lubricants market estimates and forecasts, 2018 - 2030 (Kilotons)
Table 399 Chile lubricants market estimates and forecasts, by base oil, 2018 - 2030 (USD Million)
Table 400 Chile lubricants market estimates and forecasts, by base oil, 2018 - 2030 (Kilotons)
Table 401 Chile lubricants market estimates and forecasts, by application, 2018 - 2030 (USD Million)
Table 402 Chile lubricants market estimates and forecasts, by application, 2018 - 2030 (Kilotons)
Table 403 Chile industrial lubricants market estimates and forecasts, 2018 - 2030 (USD Million)
Table 404 Chile industrial lubricants market estimates and forecasts, 2018 - 2030 (Kilotons)
Table 405 Chile automotive lubricants market estimates and forecasts, 2018 - 2030 (USD Million)
Table 406 Chile automotive lubricants market estimates and forecasts, 2018 - 2030 (Kilotons)
Table 407 Chile automotive engine oil market estimates and forecasts, 2018 - 2030 (USD Million)
Table 408 Chile automotive engine oil market estimates and forecasts, 2018 - 2030 (Kilotons)
Table 409 Chile marine lubricants market estimates and forecasts, 2018 - 2030 (USD Million)
Table 410 Chile marine lubricants market estimates and forecasts, 2018 - 2030 (Kilotons)
Table 411 Chile aerospace lubricants market estimates and forecasts, 2018 - 2030 (USD Million)
Table 412 Chile aerospace lubricants market estimates and forecasts, 2018 - 2030 (Kilotons)
Table 413 Colombia lubricants market estimates and forecasts, by base oil, 2018 - 2030 (USD Million)
Table 414 Colombia lubricants market estimates and forecasts, by base oil, 2018 - 2030 (Kilotons)
Table 415 Colombia lubricants market estimates and forecasts, by application, 2018 - 2030 (USD Million)
Table 416 Colombia lubricants market estimates and forecasts, by application, 2018 - 2030 (Kilotons)
Table 417 Colombia industrial lubricants market estimates and forecasts, 2018 - 2030 (USD Million)
Table 418 Colombia industrial lubricants market estimates and forecasts, 2018 - 2030 (Kilotons)
Table 419 Colombia automotive lubricants market estimates and forecasts, 2018 - 2030 (USD Million)
Table 420 Colombia automotive lubricants market estimates and forecasts, 2018 - 2030 (Kilotons)
Table 421 Colombia automotive engine oil market estimates and forecasts, 2018 - 2030 (USD Million)
Table 422 Colombia automotive engine oil market estimates and forecasts, 2018 - 2030 (Kilotons)
Table 423 Colombia marine lubricants market estimates and forecasts, 2018 - 2030 (USD Million)
Table 424 Colombia marine lubricants market estimates and forecasts, 2018 - 2030 (Kilotons)
Table 425 Colombia aerospace lubricants market estimates and forecasts, 2018 - 2030 (USD Million)
Table 426 Colombia aerospace lubricants market estimates and forecasts, 2018 - 2030 (Kilotons)
Table 427 Middle East & Africa lubricants market estimates and forecasts, by base oil, 2018 - 2030 (USD Million)
Table 428 Middle East & Africa lubricants market estimates and forecasts, by base oil, 2018 - 2030 (Kilotons)
Table 429 Middle East & Africa lubricants market estimates and forecasts, by application, 2018 - 2030 (USD Million)
Table 430 Middle East & Africa lubricants market estimates and forecasts, by application, 2018 - 2030 (Kilotons)
Table 431 Middle East & Africa industrial lubricants market estimates and forecasts, 2018 - 2030 (USD Million)
Table 432 Middle East & Africa industrial lubricants market estimates and forecasts, 2018 - 2030 (Kilotons)
Table 433 Middle East & Africa automotive lubricants market estimates and forecasts, 2018 - 2030 (USD Million)
Table 434 Middle East & Africa automotive lubricants market estimates and forecasts, 2018 - 2030 (Kilotons)
Table 435 Middle East & Africa automotive engine oil market estimates and forecasts, 2018 - 2030 (USD Million)
Table 436 Middle East & Africa automotive engine oil market estimates and forecasts, 2018 - 2030 (Kilotons)
Table 437 Middle East & Africa marine lubricants market estimates and forecasts, 2018 - 2030 (USD Million)
Table 438 Middle East & Africa marine lubricants market estimates and forecasts, 2018 - 2030 (Kilotons)
Table 439 Middle East & Africa aerospace lubricants market estimates and forecasts, 2018 - 2030 (USD Million)
Table 440 Middle East & Africa aerospace lubricants market estimates and forecasts, 2018 - 2030 (Kilotons)
Table 441 Iran lubricants market estimates and forecasts, by base oil, 2018 - 2030 (USD Million)
Table 442 Iran lubricants market estimates and forecasts, by base oil, 2018 - 2030 (Kilotons)
Table 443 Iran lubricants market estimates and forecasts, by application, 2018 - 2030 (USD Million)
Table 444 Iran lubricants market estimates and forecasts, by application, 2018 - 2030 (Kilotons)
Table 445 Iran industrial lubricants market estimates and forecasts, 2018 - 2030 (USD Million)
Table 446 Iran industrial lubricants market estimates and forecasts, 2018 - 2030 (Kilotons)
Table 447 Iran automotive lubricants market estimates and forecasts, 2018 - 2030 (USD Million)
Table 448 Iran automotive lubricants market estimates and forecasts, 2018 - 2030 (Kilotons)
Table 449 Iran automotive engine oil market estimates and forecasts, 2018 - 2030 (USD Million)
Table 450 Iran automotive engine oil market estimates and forecasts, 2018 - 2030 (Kilotons)
Table 451 Iran marine lubricants market estimates and forecasts, 2018 - 2030 (USD Million)
Table 452 Iran marine lubricants market estimates and forecasts, 2018 - 2030 (Kilotons)
Table 453 Iran aerospace lubricants market estimates and forecasts, 2018 - 2030 (USD Million)
Table 454 Iran aerospace lubricants market estimates and forecasts, 2018 - 2030 (Kilotons)
Table 455 Oman lubricants market estimates and forecasts, by base oil, 2018 - 2030 (USD Million)
Table 456 Oman lubricants market estimates and forecasts, by base oil, 2018 - 2030 (Kilotons)
Table 457 Oman lubricants market estimates and forecasts, by application, 2018 - 2030 (USD Million)
Table 458 Oman lubricants market estimates and forecasts, by application, 2018 - 2030 (Kilotons)
Table 459 Oman industrial lubricants market estimates and forecasts, 2018 - 2030 (USD Million)
Table 460 Oman industrial lubricants market estimates and forecasts, 2018 - 2030 (Kilotons)
Table 461 Oman automotive lubricants market estimates and forecasts, 2018 - 2030 (USD Million)
Table 462 Oman automotive lubricants market estimates and forecasts, 2018 - 2030 (Kilotons)
Table 463 Oman automotive engine oil market estimates and forecasts, 2018 - 2030 (USD Million)
Table 464 Oman automotive engine oil market estimates and forecasts, 2018 - 2030 (Kilotons)
Table 465 Oman marine lubricants market estimates and forecasts, 2018 - 2030 (USD Million)
Table 466 Oman marine lubricants market estimates and forecasts, 2018 - 2030 (Kilotons)
Table 467 Oman aerospace lubricants market estimates and forecasts, 2018 - 2030 (USD Million)
Table 468 Oman aerospace lubricants market estimates and forecasts, 2018 - 2030 (Kilotons)
Table 469 UAE lubricants market estimates and forecasts, by base oil, 2018 - 2030 (USD Million)
Table 470 UAE lubricants market estimates and forecasts, by base oil, 2018 - 2030 (Kilotons)
Table 471 UAE lubricants market estimates and forecasts, by application, 2018 - 2030 (USD Million)
Table 472 UAE lubricants market estimates and forecasts, by application, 2018 - 2030 (Kilotons)
Table 473 UAE industrial lubricants market estimates and forecasts, 2018 - 2030 (USD Million)
Table 474 UAE industrial lubricants market estimates and forecasts, 2018 - 2030 (Kilotons)
Table 475 UAE automotive lubricants market estimates and forecasts, 2018 - 2030 (USD Million)
Table 476 UAE automotive lubricants market estimates and forecasts, 2018 - 2030 (Kilotons)
Table 477 UAE automotive engine oil market estimates and forecasts, 2018 - 2030 (USD Million)
Table 478 UAE automotive engine oil market estimates and forecasts, 2018 - 2030 (Kilotons)
Table 479 UAE marine lubricants market estimates and forecasts, 2018 - 2030 (USD Million)
Table 480 UAE marine lubricants market estimates and forecasts, 2018 - 2030 (Kilotons)
Table 481 UAE aerospace lubricants market estimates and forecasts, 2018 - 2030 (USD Million)
Table 482 UAE aerospace lubricants market estimates and forecasts, 2018 - 2030 (Kilotons)
Table 483 Qatar lubricants market estimates and forecasts, by base oil, 2018 - 2030 (USD Million)
Table 484 Qatar lubricants market estimates and forecasts, by base oil, 2018 - 2030 (Kilotons)
Table 485 Qatar lubricants market estimates and forecasts, by application, 2018 - 2030 (USD Million)
Table 486 Qatar lubricants market estimates and forecasts, by application, 2018 - 2030 (Kilotons)
Table 487 Qatar industrial lubricants market estimates and forecasts, 2018 - 2030 (USD Million)
Table 488 Qatar industrial lubricants market estimates and forecasts, 2018 - 2030 (Kilotons)
Table 489 Qatar automotive lubricants market estimates and forecasts, 2018 - 2030 (USD Million)
Table 490 Qatar automotive lubricants market estimates and forecasts, 2018 - 2030 (Kilotons)
Table 491 Qatar automotive engine oil market estimates and forecasts, 2018 - 2030 (USD Million)
Table 492 Qatar automotive engine oil market estimates and forecasts, 2018 - 2030 (Kilotons)
Table 493 Qatar marine lubricants market estimates and forecasts, 2018 - 2030 (USD Million)
Table 494 Qatar marine lubricants market estimates and forecasts, 2018 - 2030 (Kilotons)
Table 495 Qatar aerospace lubricants market estimates and forecasts, 2018 - 2030 (USD Million)
Table 496 Qatar aerospace lubricants market estimates and forecasts, 2018 - 2030 (Kilotons)
Table 497 Kuwait lubricants market estimates and forecasts, by base oil, 2018 - 2030 (USD Million)
Table 498 Kuwait lubricants market estimates and forecasts, by base oil, 2018 - 2030 (Kilotons)
Table 499 Kuwait lubricants market estimates and forecasts, by application, 2018 - 2030 (USD Million)
Table 500 Kuwait lubricants market estimates and forecasts, by application, 2018 - 2030 (Kilotons)
Table 501 Kuwait industrial lubricants market estimates and forecasts, 2018 - 2030 (USD Million)
Table 502 Kuwait industrial lubricants market estimates and forecasts, 2018 - 2030 (Kilotons)
Table 503 Kuwait automotive lubricants market estimates and forecasts, 2018 - 2030 (USD Million)
Table 504 Kuwait automotive lubricants market estimates and forecasts, 2018 - 2030 (Kilotons)
Table 505 Kuwait automotive engine oil market estimates and forecasts, 2018 - 2030 (USD Million)
Table 506 Kuwait automotive engine oil market estimates and forecasts, 2018 - 2030 (Kilotons)
Table 507 Kuwait marine lubricants market estimates and forecasts, 2018 - 2030 (USD Million)
Table 508 Kuwait marine lubricants market estimates and forecasts, 2018 - 2030 (Kilotons)
Table 509 Kuwait aerospace lubricants market estimates and forecasts, 2018 - 2030 (USD Million)
Table 510 Kuwait aerospace lubricants market estimates and forecasts, 2018 - 2030 (Kilotons)
Table 511 Saudi Arabia lubricants market estimates and forecasts, by base oil, 2018 - 2030 (USD Million)
Table 512 Saudi Arabia lubricants market estimates and forecasts, by base oil, 2018 - 2030 (Kilotons)
Table 513 Saudi Arabia lubricants market estimates and forecasts, by application, 2018 - 2030 (USD Million)
Table 514 Saudi Arabia lubricants market estimates and forecasts, by application, 2018 - 2030 (Kilotons)
Table 515 Saudi Arabia industrial lubricants market estimates and forecasts, 2018 - 2030 (USD Million)
Table 516 Saudi Arabia industrial lubricants market estimates and forecasts, 2018 - 2030 (Kilotons)
Table 517 Saudi Arabia automotive lubricants market estimates and forecasts, 2018 - 2030 (USD Million)
Table 518 Saudi Arabia automotive lubricants market estimates and forecasts, 2018 - 2030 (Kilotons)
Table 519 Saudi Arabia automotive engine oil market estimates and forecasts, 2018 - 2030 (USD Million)
Table 520 Saudi Arabia automotive engine oil market estimates and forecasts, 2018 - 2030 (Kilotons)
Table 521 Saudi Arabia marine lubricants market estimates and forecasts, 2018 - 2030 (USD Million)
Table 522 Saudi Arabia marine lubricants market estimates and forecasts, 2018 - 2030 (Kilotons)
Table 523 Saudi Arabia aerospace lubricants market estimates and forecasts, 2018 - 2030 (USD Million)
Table 524 Saudi Arabia aerospace lubricants market estimates and forecasts, 2018 - 2030 (Kilotons)
Table 525 South Africa lubricants market estimates and forecasts, by base oil, 2018 - 2030 (USD Million)
Table 526 South Africa lubricants market estimates and forecasts, by base oil, 2018 - 2030 (Kilotons)
Table 527 South Africa lubricants market estimates and forecasts, by application, 2018 - 2030 (USD Million)
Table 528 South Africa lubricants market estimates and forecasts, by application, 2018 - 2030 (Kilotons)
Table 529 South Africa industrial lubricants market estimates and forecasts, 2018 - 2030 (USD Million)
Table 530 South Africa industrial lubricants market estimates and forecasts, 2018 - 2030 (Kilotons)
Table 531 South Africa automotive lubricants market estimates and forecasts, 2018 - 2030 (USD Million)
Table 532 South Africa automotive lubricants market estimates and forecasts, 2018 - 2030 (Kilotons)
Table 533 South Africa automotive engine oil market estimates and forecasts, 2018 - 2030 (USD Million)
Table 534 South Africa automotive engine oil market estimates and forecasts, 2018 - 2030 (Kilotons)
Table 535 South Africa marine lubricants market estimates and forecasts, 2018 - 2030 (USD Million)
Table 536 South Africa marine lubricants market estimates and forecasts, 2018 - 2030 (Kilotons)
Table 537 South Africa aerospace lubricants market estimates and forecasts, 2018 - 2030 (USD Million)
Table 538 South Africa aerospace lubricants market estimates and forecasts, 2018 - 2030 (Kilotons)
Table 539 Angola lubricants market estimates and forecasts, by base oil, 2018 - 2030 (USD Million)
Table 540 Angola lubricants market estimates and forecasts, by base oil, 2018 - 2030 (Kilotons)
Table 541 Angola lubricants market estimates and forecasts, by application, 2018 - 2030 (USD Million)
Table 542 Angola lubricants market estimates and forecasts, by application, 2018 - 2030 (Kilotons)
Table 543 Angola industrial lubricants market estimates and forecasts, 2018 - 2030 (USD Million)
Table 544 Angola industrial lubricants market estimates and forecasts, 2018 - 2030 (Kilotons)
Table 545 Angola automotive lubricants market estimates and forecasts, 2018 - 2030 (USD Million)
Table 546 Angola automotive lubricants market estimates and forecasts, 2018 - 2030 (Kilotons)
Table 547 Angola automotive engine oil market estimates and forecasts, 2018 - 2030 (USD Million)
Table 548 Angola automotive engine oil market estimates and forecasts, 2018 - 2030 (Kilotons)
Table 549 Angola marine lubricants market estimates and forecasts, 2018 - 2030 (USD Million)
Table 550 Angola marine lubricants market estimates and forecasts, 2018 - 2030 (Kilotons)
Table 551 Angola aerospace lubricants market estimates and forecasts, 2018 - 2030 (USD Million)
Table 552 Angola aerospace lubricants market estimates and forecasts, 2018 - 2030 (Kilotons)
Table 553 Nigeria lubricants market estimates and forecasts, by base oil, 2018 - 2030 (USD Million)
Table 554 Nigeria lubricants market estimates and forecasts, by base oil, 2018 - 2030 (Kilotons)
Table 555 Nigeria lubricants market estimates and forecasts, by application, 2018 - 2030 (USD Million)
Table 556 Nigeria lubricants market estimates and forecasts, by application, 2018 - 2030 (Kilotons)
Table 557 Nigeria industrial lubricants market estimates and forecasts, 2018 - 2030 (USD Million)
Table 558 Nigeria industrial lubricants market estimates and forecasts, 2018 - 2030 (Kilotons)
Table 559 Nigeria automotive lubricants market estimates and forecasts, 2018 - 2030 (USD Million)
Table 560 Nigeria automotive lubricants market estimates and forecasts, 2018 - 2030 (Kilotons)
Table 561 Nigeria automotive engine oil market estimates and forecasts, 2018 - 2030 (USD Million)
Table 562 Nigeria automotive engine oil market estimates and forecasts, 2018 - 2030 (Kilotons)
Table 563 Nigeria marine lubricants market estimates and forecasts, 2018 - 2030 (USD Million)
Table 564 Nigeria marine lubricants market estimates and forecasts, 2018 - 2030 (Kilotons)
Table 565 Nigeria aerospace lubricants market estimates and forecasts, 2018 - 2030 (USD Million)
Table 566 Nigeria aerospace lubricants market estimates and forecasts, 2018 - 2030 (Kilotons)
List of Figures
Fig. 1 Market Segmentation
Fig. 2 Information Procurement
Fig. 3 Data Analysis Models
Fig. 4 Market Formulation And Validation
Fig. 5 Market Snapshot
Fig. 6 Segmental Outlook - Base Oils & Application
Fig. 7 Competitive Outlook
Fig. 8 Lubricants Market Outlook, 2018 - 2030 (USD Million) (Kilotons)
Fig. 9 Lubricants Market - Value Chain Analysis
Fig. 10 Crude Oil Prices, 2010-2022 (USD/Barrel)
Fig. 11 Price Trend Analysis, 2018 - 2030 (USD per Kg)
Fig. 12 Lubricants Market - Market Dynamics
Fig. 13 Lubricants Market - PORTER’s Analysis
Fig. 14 Lubricants Market - PESTEL Analysis
Fig. 15 Lubricants Market Estimates & Forecasts, By Base Oils: Key Takeaways
Fig. 16 Lubricants Market Share, By Base Oils, 2023 & 2030
Fig. 17 Lubricants Market Estimates & Forecasts, By Mineral Oil, 2018 - 2030 (Kilotons) (USD Million)
Fig. 18 Lubricants Market Estimates & Forecasts, By Synthetic Oil, 2018 - 2030 (Kilotons) (USD Million)
Fig. 19 Lubricants Market Estimates & Forecasts, By Bio-based Oil, 2018 - 2030 (Kilotons) (USD Million)
Fig. 20 Lubricants Market Estimates & Forecasts, By Application: Key Takeaways
Fig. 21 Lubricants Market Share, By Application, 2023 & 2030
Fig. 22 Industrial Lubricants Market Estimates & Forecasts, 2018 - 2030 (Kilotons) (USD Million)
Fig. 23 Industrial Lubricants Market Estimates & Forecasts, By Process Oils, 2018 - 2030 (Kilotons) (USD Million)
Fig. 24 Industrial Lubricants Market Estimates & Forecasts, By General Industrial Oils, 2018 - 2030 (Kilotons) (USD Million)
Fig. 25 Industrial Lubricants Market Estimates & Forecasts, By Metalworking Fluids, 2018 - 2030 (Kilotons) (USD Million)
Fig. 26 Industrial Lubricants Market Estimates & Forecasts, By Industrial Engine Oils, 2018 - 2030 (Kilotons) (USD Million)
Fig. 27 Industrial Lubricants Market Estimates & Forecasts, By Greases, 2018 - 2030 (Kilotons) (USD Million)
Fig. 28 Industrial Lubricants Market Estimates & Forecasts, By Other Industrial Lubricants, 2018 - 2030 (Kilotons) (USD Million)
Fig. 29 Automotive Lubricants Market Estimates & Forecasts, 2018 - 2030 (Kilotons) (USD Million)
Fig. 30 Automotive Lubricants Market Estimates & Forecasts, By Engine Oil, 2018 - 2030 (Kilotons) (USD Million)
Fig. 31 Automotive Lubricants Market Estimates & Forecasts, By Gear Oil, 2018 - 2030 (Kilotons) (USD Million)
Fig. 32 Automotive Lubricants Market Estimates & Forecasts, By Transmission Fluids, 2018 - 2030 (Kilotons) (USD Million)
Fig. 33 Automotive Lubricants Market Estimates & Forecasts, By Brake Fluids, 2018 - 2030 (Kilotons) (USD Million)
Fig. 34 Automotive Lubricants Market Estimates & Forecasts, By Coolants, 2018 - 2030 (Kilotons) (USD Million)
Fig. 35 Automotive Lubricants Market Estimates & Forecasts, By Greases, 2018 - 2030 (Kilotons) (USD Million)
Fig. 36 Marine Lubricants Market Estimates & Forecasts, 2018 - 2030 (Kilotons) (USD Million)
Fig. 37 Marine Lubricants Market Estimates & Forecasts, By Engine Oil, 2018 - 2030 (Kilotons) (USD Million)
Fig. 38 Marine Lubricants Market Estimates & Forecasts, By Hydraulic Oil, 2018 - 2030 (Kilotons) (USD Million)
Fig. 39 Marine Lubricants Market Estimates & Forecasts, By Gear Oil, 2018 - 2030 (Kilotons) (USD Million)
Fig. 40 Marine Lubricants Market Estimates & Forecasts, By Turbine Oil, 2018 - 2030 (Kilotons) (USD Million)
Fig. 41 Marine Lubricants Market Estimates & Forecasts, By Greases, 2018 - 2030 (Kilotons) (USD Million)
Fig. 42 Marine Lubricants Market Estimates & Forecasts, By Others, 2018 - 2030 (Kilotons) (USD Million)
Fig. 43 Aerospace Lubricants Market Estimates & Forecasts, 2018 - 2030 (Kilotons) (USD Million)
Fig. 44 Aerospace Lubricants Market Estimates & Forecasts, By Gas Turbine Oils, 2018 - 2030 (Kilotons) (USD Million)
Fig. 45 Aerospace Lubricants Market Estimates & Forecasts, By Piston Engine Oils, 2018 - 2030 (Kilotons) (USD Million)
Fig. 46 Aerospace Lubricants Market Estimates & Forecasts, By Hydraulic Fluids, 2018 - 2030 (Kilotons) (USD Million)
Fig. 47 Aerospace Lubricants Market Estimates & Forecasts, By Others, 2018 - 2030 (Kilotons) (USD Million)
Fig. 48 Lubricants Market, By Region, 2023 & 2030 (USD Million)
Fig. 49 Lubricants Market, By Region, 2023 & 2030 (Kilotons)
Fig. 50 North America Lubricants Market Estimates & Forecasts, 2018 - 2030 (Kilotons) (USD Million)
Fig. 51 U.S. Lubricants Market Estimates & Forecasts, 2018 - 2030 (Kilotons) (USD Million)
Fig. 52 Canada Lubricants Market Estimates & Forecasts, 2018 - 2030 (Kilotons) (USD Million)
Fig. 53 Mexico Lubricants Market Estimates & Forecasts, 2018 - 2030 (Kilotons) (USD Million)
Fig. 54 Europe Lubricants Market Estimates & Forecasts, 2018 - 2030 (Kilotons) (USD Million)
Fig. 55 Germany Lubricants Market Estimates & Forecasts, 2018 - 2030 (Kilotons) (USD Million)
Fig. 56 UK Lubricants Market Estimates & Forecasts, 2018 - 2030 (Kilotons) (USD Million)
Fig. 57 France Lubricants Market Estimates & Forecasts, 2018 - 2030 (Kilotons) (USD Million)
Fig. 58 Switzerland Lubricants Market Estimates & Forecasts, 2018 - 2030 (Kilotons) (USD Million)
Fig. 59 Russia Lubricants Market Estimates & Forecasts, 2018 - 2030 (Kilotons) (USD Million)
Fig. 60 Italy Lubricants Market Estimates & Forecasts, 2018 - 2030 (Kilotons) (USD Million)
Fig. 61 Spain Lubricants Market Estimates & Forecasts, 2018 - 2030 (Kilotons) (USD Million)
Fig. 62 The Netherlands Lubricants Market Estimates & Forecasts, 2018 - 2030 (Kilotons) (USD Million)
Fig. 63 Asia Pacific Lubricants Market Estimates & Forecasts, 2018 - 2030 (Kilotons) (USD Million)
Fig. 64 China Lubricants Market Estimates & Forecasts, 2018 - 2030 (Kilotons) (USD Million)
Fig. 65 India Lubricants Market Estimates & Forecasts, 2018 - 2030 (Kilotons) (USD Million)
Fig. 66 Japan Lubricants Market Estimates & Forecasts, 2018 - 2030 (Kilotons) (USD Million)
Fig. 67 South Korea Lubricants Market Estimates & Forecasts, 2018 - 2030 (Kilotons) (USD Million)
Fig. 68 Malaysia Lubricants Market Estimates & Forecasts, 2018 - 2030 (Kilotons) (USD Million)
Fig. 69 Indonesia Lubricants Market Estimates & Forecasts, 2018 - 2030 (Kilotons) (USD Million)
Fig. 70 Vietnam Lubricants Market Estimates & Forecasts, 2018 - 2030 (Kilotons) (USD Million)
Fig. 71 Australia Lubricants Market Estimates & Forecasts, 2018 - 2030 (Kilotons) (USD Million)
Fig. 72 New Zealand Lubricants Market Estimates & Forecasts, 2018 - 2030 (Kilotons) (USD Million)
Fig. 73 Kyrgyzstan Lubricants Market Estimates & Forecasts, 2018 - 2030 (Kilotons) (USD Million)
Fig. 74 Central & South America Lubricants Market Estimates & Forecasts, 2018 - 2030 (Kilotons) (USD Million)
Fig. 75 Brazil Lubricants Market Estimates & Forecasts, 2018 - 2030 (Kilotons) (USD Million)
Fig. 76 Argentina Lubricants Market Estimates & Forecasts, 2018 - 2030 (Kilotons) (USD Million)
Fig. 77 Chile Lubricants Market Estimates & Forecasts, 2018 - 2030 (Kilotons) (USD Million)
Fig. 78 Colombia Lubricants Market Estimates & Forecasts, 2018 - 2030 (Kilotons) (USD Million)
Fig. 79 Middle East & Africa Lubricants Market Estimates & Forecasts, 2018 - 2030 (Kilotons) (USD Million)
Fig. 80 Saudi Arabia Lubricants Market Estimates & Forecasts, 2018 - 2030 (Kilotons) (USD Million)
Fig. 81 Iran Lubricants Market Estimates & Forecasts, 2018 - 2030 (Kilotons) (USD Million)
Fig. 82 Oman Lubricants Market Estimates & Forecasts, 2018 - 2030 (Kilotons) (USD Million)
Fig. 83 UAE Lubricants Market Estimates & Forecasts, 2018 - 2030 (Kilotons) (USD Million)
Fig. 84 Qatar Lubricants Market Estimates & Forecasts, 2018 - 2030 (Kilotons) (USD Million)
Fig. 85 Kuwait Lubricants Market Estimates & Forecasts, 2018 - 2030 (Kilotons) (USD Million)
Fig. 86 Angola Lubricants Market Estimates & Forecasts, 2018 - 2030 (Kilotons) (USD Million)
Fig. 87 Nigeria Lubricants Market Estimates & Forecasts, 2018 - 2030 (Kilotons) (USD Million)
Fig. 88 South Africa Lubricants Market Estimates & Forecasts, 2018 - 2030 (Kilotons) (USD Million)
Fig. 89 Key Company Categorization
Fig. 90 Company Market Positioning
Fig. 91 Strategy Mapping
Market Segmentation
Lubricants are majorly used as diesel engine oils, gearbox lubricants, and transmission oils in passenger cars, commercial vehicles, and motorcycles. Growing automobile adoption is expected to augment the global lubricants market growth in the coming years. As per OICA, global motor vehicle production reached 8,01,45,988 in 2021 Growing disposable income of consumers is also expected to result in an increased demand for lubricants for automotive maintenance. Moreover, normalization of the situation in the post-COVID-19 period increased worldwide car production, as it grew to around 66.7 million automobiles in 2021, up from around 63.8 million units in 2020.
Major automakers such as Volkswagen Group, Daimler, Subaru, Hyundai KIA, Honda Motors, Nissan Motor Company, Mitsubishi, Fiat Chrysler Automobiles, Toyota Motor Corporation, Ford Motor Company, and General Motors, have been involved in structuring the automotive industry. Companies such as Chevron Corporation have identified several technological upgrades that can boost the automotive sector. These technologies include gasoline direct injection (GDI) in vehicles over valve intakes, which is a popular choice in the country. Turbochargers are yet another notable technological upgrade in the high-performance sports car segment. Furthermore, downsizing liter engine segment vehicles to reduce vehicle weight and enhance fuel efficiency is yet another key factor boosting sales of passenger cars. With the growth in sales of the automotive industry, the projected consumption of lubricants in manufacturing and maintaining vehicles is expected to rise in the coming years.
Lubricants play an important part in enhancing the performance of vehicles in extreme environmental conditions. The lubricating oil not only protects the vehicle but also facilitates better hardware compatibility. They are formulated to support vehicle engines in the temperature range of 40-240°C. Furthermore, engine oils also handle pressure of up to 10^5 Pascal. Maintenance of vehicles is a top priority of consumers these days. Lubricants help to avoid wear and tear of vehicular components by significantly reducing friction between them.
Companies are focusing on the standardization of various grades of lubricants, which will subsequently help in the development of application-specific high-quality lubricants. For instance, engine oil lubricants need to meet standards such as Mack EO-M+, API CL-4, JASODH-1, and SAE 15 W40. Engine oil lubricants increase vehicle efficiency and also reduce greenhouse gas emissions. Rising awareness about vehicle maintenance and a rising need for high-efficiency vehicles globally is expected to fuel demand for lubricants during the projection period.
Electric vehicles are powered by packs of rechargeable batteries and run on electricity. These vehicles can convert over 60% of the electrical energy to power at wheels. On the contrary, conventional gasoline-powered engines convert only about 21% of the fuel to power. EVs provide high acceleration and are environment-friendly, which are key factors driving the electric vehicles market globally. Hybrid electric vehicles are slightly different as they have both an internal combustion engine and an electric motor. Compared to conventional vehicles powered only by combustion engines, hybrid-electric vehicles generate more torque, delivering more acceleration with reduced carbon emissions. Thus, hybrid-electric vehicles are an upcoming trend.
Consumers are increasingly adopting low-maintenance vehicles because a typical internal combustion engine-driven vehicle consumes a majority of the lubricant (engine oil), which has to be changed every 3,000 to 10,000 km (depending on the vehicle condition). Other substantial lubricant demands are generated from transmission fluids and gear oil, which are changed every 150,000 km and 50,000 km, respectively.
Electric vehicles use lubricants in multiple components such as ball bearings, wheel drive, automatic push windows, and under-the-hood components. A substantial amount of lubricant consumption is from engine operations. However, since an electric vehicle operates on batteries, it does not require any engine oil for vehicle function. The demand for greases and other lubricants may still exist but a substantial drop in lubricant consumption is showcased. Therefore, the growing number of hybrid electric vehicles is projected to slow down the consumption of lubricants.
This section will provide insights into the contents included in this lubricants market report and help gain clarity on the structure of the report to assist readers in navigating smoothly.
Industry overview
Industry trends
Market drivers and restraints
Market size
Growth prospects
Porter’s analysis
PESTEL analysis
Key market opportunities prioritized
Competitive landscape
Company overview
Financial performance
Product benchmarking
Latest strategic developments
Market size, estimates, and forecast from 2018 to 2030
Market estimates and forecast for product segments up to 2030
Regional market size and forecast for product segments up to 2030
Market estimates and forecast for application segments up to 2030
Regional market size and forecast for application segments up to 2030
Company financial performance
A three-pronged approach was followed for deducing the lubricants market estimates and forecasts. The process has three steps: information procurement, analysis, and validation. The whole process is cyclical, and steps repeat until the estimates are validated. The three steps are explained in detail below:
Information procurement: Information procurement is one of the most extensive and important stages in our research process, and quality data is critical for accurate analysis. We followed a multi-channel data collection process for lubricants market to gather the most reliable and current information possible.
Analysis: We mine the data collected to establish baselines for forecasting, identify trends and opportunities, gain insight into consumer demographics and drivers, and so much more. We utilized different methods of lubricants market data depending on the type of information we’re trying to uncover in our research.
Market Research Efforts: Bottom-up Approach for estimating and forecasting demand size and opportunity, top-down Approach for new product forecasting and penetration, and combined approach of both Bottom-up and Top-down for full coverage analysis.
Value-Chain-Based Sizing & Forecasting: Supply-side estimates for understanding potential revenue through competitive benchmarking, forecasting, and penetration modeling.
Demand-side estimates for identifying parent and ancillary markets, segment modeling, and heuristic forecasting.
Qualitative Functional Deployment (QFD) Modelling for market share assessment.
Market formulation and validation: We mine the data collected to establish baselines for forecasting, identify trends and opportunities, gain insight into consumer demographics and drivers, and so much more. We utilize different methods of data analysis depending on the type of information we’re trying to uncover in our research.
Market Formulation: This step involves the finalization of market numbers. This step on an internal level is designed to manage outputs from the Data Analysis step.
Data Normalization: The final market estimates and forecasts are then aligned and sent to industry experts, in-panel quality control managers for validation.
This step also entails the finalization of the report scope and data representation pattern.
Validation: The process entails multiple levels of validation. All these steps run in parallel, and the study is forwarded for publishing only if all three levels render validated results.
The lubricants market was categorized into two segments, namely application (Industrial, Automotive, Marine, Aerospace), and region (North America, Europe, Asia Pacific, Central & South America, Middle East & Africa).
The lubricants market was segmented into application, and regions. The demand at a segment level was deduced using a funnel method. Concepts like the TAM, SAM, SOM, etc., were put into practice to understand the demand. We at GVR deploy three methods to deduce market estimates and determine forecasts. These methods are explained below:
Demand estimation of each product across countries/regions summed up to from the total market.
Variable analysis for demand forecast.
Demand estimation via analyzing paid database, and company financials either via annual reports or paid database.
Primary interviews for data revalidation and insight collection.
Used extensively for new product forecasting or analyzing penetration levels.
Tool used invoice product flow and penetration models Use of regression multi-variant analysis for forecasting Involves extensive use of paid and public databases.
Primary interviews and vendor-based primary research for variable impact analysis.
The lubricants market was analyzed at a regional level. The global was divided into North America, Europe, Asia Pacific, Central & South America, and Middle East & Africa, keeping in focus variables like consumption patterns, export-import regulations, consumer expectations, etc. These regions were further divided into thirty-four countries, namely, the U.S.; Canada; Mexico; the UK; Germany; Switzerland; Russia; France; Italy; Spain; Netherlands; China; India; Japan; South Korea; Malaysia; Indonesia; Vietnam; Australia; New Zealand; Kyrgyzstan; Brazil; Argentina; Colombia; Chile; Iran; Oman; UAE; Qatar; Kuwait; Saudi Arabia; South Africa; Angola; Nigeria.
All three above-mentioned market research methodologies were applied to arrive at regional-level conclusions. The regions were then summed up to form the global market.
The lubricants market was analyzed via companies operating in the sector. Analyzing these companies and cross-referencing them to the demand equation helped us validate our assumptions and conclusions. Key market players analyzed include:
ExxonMobil Corp. is a global manufacturer & supplier of synthetic lubricants. The company mainly deals in three business segments that include upstream (oil & gas, E&P, shipping, and wholesale operations), downstream (refining, marketing, and retail operations), and chemicals. The product portfolio of the company includes consumer, commercial, industrial, aviation, marine lubricants, base stocks & specialty products. ExxonMobil owns 37 oil refineries in 21 countries with a refining capacity of 6.3 million barrels per day.
Royal Dutch Shell is an integrated oil & gas company engaged in business segments that include upstream, integrated gas and new energies, downstream, and projects & technology. The company operates internationally and explores & produces crude oil, natural gas & natural gas liquids (NGL), transport oil & gas, as well as other chemical intermediaries to different markets. The company’s petrochemical product portfolio includes acetone, ethylene oxide, ethylene glycols, phenol, polyols, propylene glycols, and propylene oxides. Downstream activities involve refining and marketing of oil products and chemicals, which are managed globally. Under projects & technology, the company provides technical services and technology to upstream and downstream activities. The company trades crude oil and natural gas by converting them into redefined products, including aviation fuel, gasoline, marine fuel diesel, LNG for transport of bitumen & sulfur, heating oil, and lubricants.
BP plc is an integrated oil & gas company that operates in the areas of upstream & downstream segments and alternative energy. The company’s upstream segment includes exploration & production of oil & gas, midstream transportation, processing, and storage. In addition, it also includes trading of natural gas, including liquefied natural gas (LNG) and power & natural gas liquids (NGL). The company’s downstream segment includes the manufacturing and distribution of products that include fuels, petrochemicals & lubricants and has 17,800 service stations worldwide. The company’s alternative energy segment concentrates on building sustainable energy based on biofuels, carbon solutions, and electrification. Some brands under which British Petroleum operates in the market include BP, Aral, Castrol, and Wild Bean Café. The company produces over 3.3 million barrels of oil equivalent per day. The company’s major products & services include BP gas/petrol stations, Castrol (lubricants), AMPM (U.S.), Aral (Europe), Air BP (Aviation Fuel), BP Solar Warranty, BP Acetyls (Europe), BP biofuels, and fuel card & credit cards.
Total Energies is a major oil & gas integrated company. The company has its business segments in upstream, refining & specialty chemicals, and marketing & services. Total Oil India Private Ltd. is an entirely owned subsidiary of TOTAL. It has exploration and production activities in more than 50 countries. It operates in the renewable energies and power generation sector. The Company’s ongoing activities are in United States, Canada / South America, Middle East Europe & CIS, Africa, Asia-Pacific and Australia/ Oceania. Its products have numerous applications in transportation, household appliances, food & industrial packaging, and other sectors. The company transports 131 million metric tons of crude oil and other refined products.
Chevron Corporation is a vertically integrated oil & gas company and through its subsidiaries is engaged in business operations that include upstream & downstream operations. Upstream segments include exploration & production of oil & natural gas. Downstream operations include manufacturing & distribution of chemicals, lubricants & additives. The lubricant product portfolio includes commercial transportation, industrial and off-highway equipment, passenger vehicles, and inland marine. Chevron lubricant brands operating in the market include Delo, Havoline, Supreme, Ursa TECHRON, ISOCLEAN & Clarity. It provides finished lubricants & premium base oils to commercial, consumer, industrial, and marine customers across the globe.
Fuchs operates as a subsidiary of Fuchs Petrolub SE, a German lubricants producer. The company produces lubricants for a variety of industries, including mining, energy, transportation, industrial manufacturing, construction, consumer goods, and agriculture. The product portfolio includes compressor oils, corrosion preventatives, engine oils, food grade, gear oils, glass lubricants, grease, hydraulic oils, metalworking & motorcycle. It has a total of 54 operating companies with 34 production plants across the globe.
Castrol India Ltd. specializes in manufacturing, marketing, and distribution of lubricant oils & greases for commercial, domestic, and industrial applications. The company operates as a subsidiary of British Petroleum PLC and has an operational presence in over 40 countries globally. Castrol India Ltd. manufactures and sells engine oil, transmission fluids, and other lubricants to the automotive industry under the Castrol brand. The company’s reportable business segment consists of a single segment of lubricants. The majority of all revenue comes from India. Castrol Limited was formerly known as CC Wakefield & Company Ltd. and changed its name to Castrol Limited in August 1960. Major OEMs such as Audi, BMW, Ford, MAN, Tata, and Volkswagen have approved their products. Castrol the lubricant brand acquired by BP.
Amsoil Inc. manufactures & distributes synthetic lubricants & oils for automotive, power sports, industrial, and racing applications. The company's product portfolio includes motor oils, grease, compressor oils, transmission fluids, hydraulic oils, fuel additives, filters, gear lubricants, clothing & merchandise, and garage accessories. The company has regional warehouses in North America and distribution centers across the globe. Amsoil has a wide network of independent dealers worldwide and markets its products online as well. The company caters its products to automotive & light trucks, motorcycles, motor homes, diesel motors, classic & vintage vehicles, dirt bikes, ATVs & UTVs, semi-trailer trucks, boats & personal watercraft, compact imports, tuners, and snowmobiles.
JX Nippon Oil & Gas Corporation is involved in oil refining & marketing, export & import of coal & gas, electricity supply & development, and manufacturing & marketing of conventional energy, including solar storage batteries & fuel cells. The company caters to several end-use industries such as optics, textiles, industrial, automotive, marine, and metals. The company’s petroleum & petrochemical products come under the Eneos brand. Nippon Oil’s major refineries include Sendai, Negishi, Mizushima, Marifu, Oita, Muroran, Kawasaki, Kashima, and Osaka refinery.
Phillips 66 is a wholly owned chemical & lubricant subsidiary of ConocoPhillips. The company has introduced several pioneer products within the lubricants industry such as oil for winters, pre-packed & factory-sealed one-quart oil can, and the first 2,000-mile motor oil. Its operations include refining & marketing of petroleum products such as gasoline, diesel, jet fuel, and lubricants. The company is also involved in gathering & processing natural gas & natural gas liquids (NGL) for powering businesses, heating homes, cooking, and electricity.
Supply Side Estimates
Company revenue estimation via referring to annual reports, investor presentations, and Hoover’s.
Segment revenue determination via variable analysis and penetration modeling.
Competitive benchmarking to identify market leaders and their collective revenue shares.
Forecasting via analyzing commercialization rates, pipelines, market initiatives, distribution networks, etc.
Demand side estimates
Identifying parent markets and ancillary markets
Segment penetration analysis to obtain pertinent
revenue/volume
Heuristic forecasting with the help of subject matter experts
Forecasting via variable analysis
Understanding market dynamics (in terms of drivers, restraints, & opportunities) in the countries.
Understanding trends & variables in the individual countries & their impact on growth and using analytical tools to provide high-level insights into the market dynamics and the associated growth pattern.
Understanding market estimates and forecasts (with the base year as 2023, historic information from 2018 to 2022, and forecast from 2024 to 2030). Regional estimates & forecasts for each category are available and are summed up to form the global market estimates.
The report provides market value for the base year 2023 and a yearly forecast till 2030 in terms of revenue/volume or both. The market for each of the segment outlooks has been provided on region & country basis for the above-mentioned forecast period.
The key industry dynamics, major technological trends, and application markets are evaluated to understand their impact on the demand for the forecast period. The growth rates were estimated using correlation, regression, and time-series analysis.
We have used the bottom-up approach for market sizing, analyzing key regional markets, dynamics, & trends for various products and end-users. The total market has been estimated by integrating the country markets.
All market estimates and forecasts have been validated through primary interviews with the key industry participants.
Inflation has not been accounted for to estimate and forecast the market.
Numbers may not add up due to rounding off.
Europe consists of EU-8, Central & Eastern Europe, along with the Commonwealth of Independent States (CIS).
Asia Pacific includes South Asia, East Asia, Southeast Asia, and Oceania (Australia & New Zealand).
Latin America includes Central American countries and the South American continent
Middle East includes Western Asia (as assigned by the UN Statistics Division) and the African continent.
GVR strives to procure the latest and unique information for reports directly from industry experts, which gives it a competitive edge. Quality is of utmost importance to us, therefore every year we focus on increasing our experts’ panel. Primary interviews are one of the critical steps in identifying recent market trends and scenarios. This process enables us to justify and validate our market estimates and forecasts to our clients. With more than 8,000 reports in our database, we have connected with some key opinion leaders across various domains, including healthcare, technology, consumer goods, and the chemical sector. Our process starts with identifying the right platform for a particular type of report, i.e., emails, LinkedIn, seminars, or telephonic conversation, as every report is unique and requires a differentiated approach.
We send out questionnaires to different experts from various regions/ countries, which is dependent on the following factors:
Report/Market scope: If the market study is global, we send questionnaires to industry experts across various regions, including North America, Europe, Asia Pacific, Latin America, and MEA.
Market Penetration: If the market is driven by technological advancements, population density, disease prevalence, or other factors, we identify experts and send out questionnaires based on region or country dominance.
The time to start receiving responses from industry experts varies based on how niche or well-penetrated the market is. Our reports include a detailed chapter on the KoL opinion section, which helps our clients understand the perspective of experts already in the market space.
"The quality of research they have done for us has been excellent."