GVR Report cover Heat Exchangers Market Size, Share & Trends Report

Heat Exchangers Market Size, Share & Trends Analysis Report By Product (Plate & Frame (Brazed, Gasketed, Welded), By End-use (Chemical & Petrochemical, Oil & Gas, Power Generation), By Material, By Region, And Segment Forecasts, 2024 - 2030

  • Report ID: GVR-4-68038-718-6
  • Number of Report Pages: 133
  • Format: PDF, Horizon Databook
  • Historical Range: 2018 - 2022
  • Forecast Period: 2024 - 2030 
  • Industry: Advanced Materials

Heat Exchangers Market Size & Trends

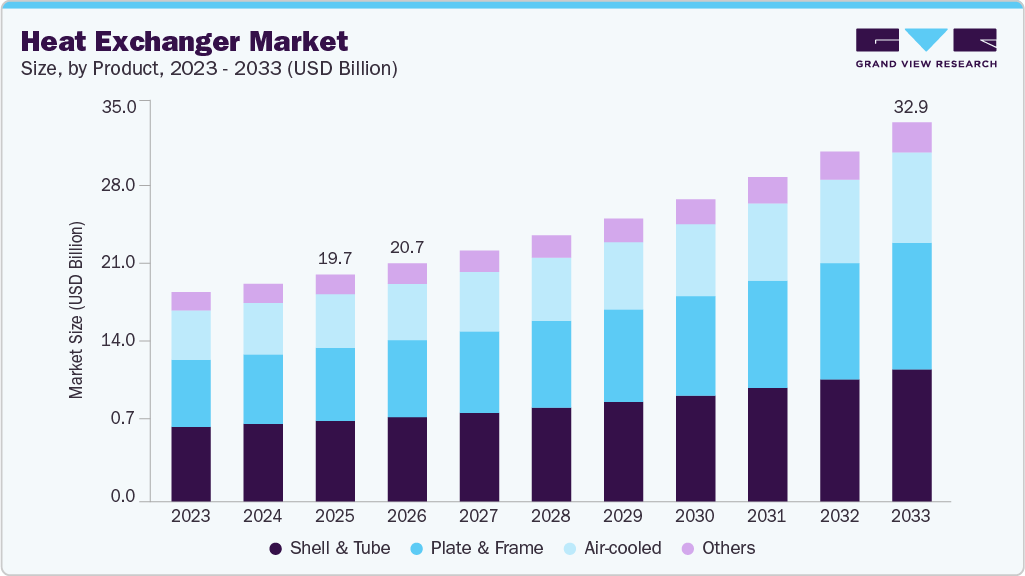
The global heat exchangers market size was estimated at USD 18.19 billion in 2023 and is expected to expand at a compounded annual growth rate (CAGR) of 5.4% from 2024 to 2030. Rising focus on efficient thermal management in various industries, including oil & gas, power generation, chemical & petrochemical, food & beverage, and HVAC & refrigeration, is expected to drive the demand for heat exchangers over the forecast period. Rising demand from chemical industry coupled with increasing technological advancements and a growing focus on improving efficiency standards is expected to drive heat exchangers market growth. Most processes in petrochemical facilities involve high pressure and temperature, thus, necessitating the optimization of heat transfer and enhancement of energy savings, which, in turn, is likely to boost the demand for energy-efficient heat exchangers.

U.S. Heat Exchangers market size and growth rate, 2024 - 2030

U.S. dominated the North America heat exchanger market in 2023, owing to high electricity demand, industrialization, and investments in renewable power generation. Rising investments by oil & gas companies in exploration & production activities in the U.S. are expected to boost the demand for these products in oil & gas industry.

Significant power markets such as China, U.S., India, Russia, and Japan are restructuring their operating models to adopt the structure of renewable energy and efficient utilization of energy by installing heat exchangers and shifting from traditional energy use. This is expected to drive the demand for heat exchangers.

Technological advancements such as tube inserts in heat exchangers are expected to complement the market growth. Furthermore, ongoing technological improvements to improve energy efficiency, total life cycle cost, durability, and compactness of heat exchangers are expected to drive industry growth.

Manufacturers of these products face a long list of difficult supply chain challenges, including increasing demand variability, intense global competition, more environmental compliance regulations, increasing human- and nature-based risks, and inventory proliferation. COVID-19 pandemic has created new challenges, which are compelling manufacturers to innovate their supply chains at a faster speed.

Market Concentration & Characteristics

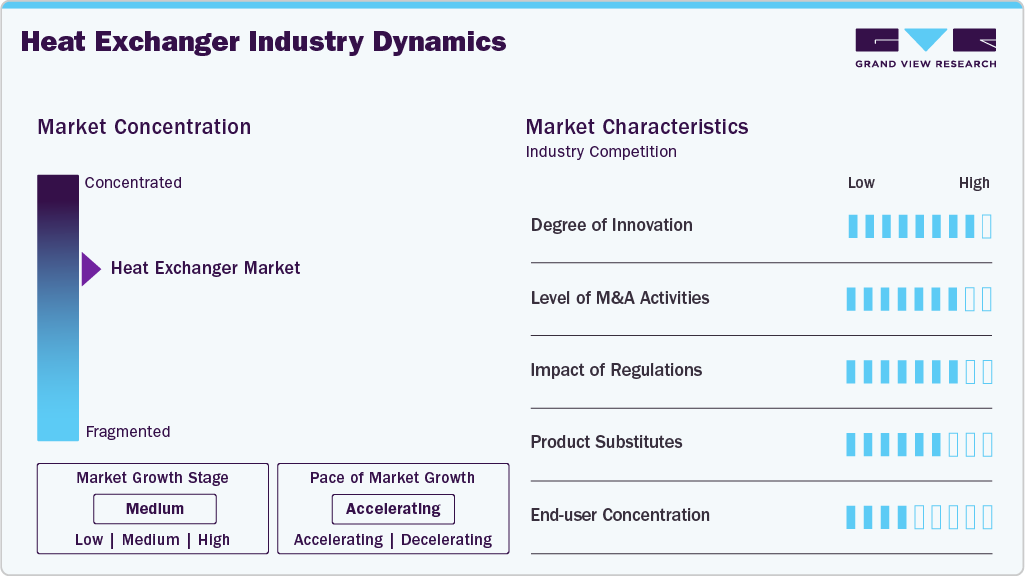
Market growth stage is medium, and pace of the market growth is accelerating. Heat exchangers market is characterized by a high degree of innovation owing to the rapid technological advancements. Moreover, the companies are further adopting various organic and inorganic growth strategies, such as product launches, geographical expansions, mergers & acquisitions, and collaborations, to strengthen their position in the global market.

Heat Exchangers Market Concentration & Characteristics

The heat exchangers market is also characterized by a high level of merger and acquisition (M&A) activity by the leading players. Notable mergers and acquisitions in the heat exchangers market have often focused on technological advancements, such as incorporating smart and sustainable solutions. This concentration is driven by the growing demand for energy-efficient systems and environmentally friendly technologies. As companies consolidate, they aim to capitalize on shared R&D capabilities, streamline operations, and meet the evolving needs of diverse industries relying on heat exchange solutions. The resulting landscape is marked by a strategic reshaping of the industry to address emerging challenges and opportunities in the field of thermal management.

The heat exchangers market is subject to a high concentration of regulations that significantly influence industry dynamics. Governmental standards related to energy efficiency, environmental impact, and safety standards have become pivotal in shaping the market landscape. The regulatory landscape often encourages technological advancements to meet stringent criteria, fostering a competitive environment among industry players. Companies are strategically aligning their operations with these regulations, leading to a concentration of efforts on compliance, innovation, and sustainable practices. This regulatory focus not only ensures product quality and safety but also shapes the market by promoting advancements that align with broader societal and environmental goals.

Market Dynamics

Rapid industrialization in the developing nations of Asia Pacific coupled with increasing investments in manufacturing, industrial, and commercial projects has contributed to the overall growth of the exchangers market in the region. Another factor driving the market is the increased product penetration in various end-use industries including power generation, chemical, HVAC & refrigeration, petrochemical, and food & beverage.

A significant shift in demand for plate & frame heat exchangers is being observed from mature markets including Europe and North America as well as developing nations of Asia Pacific including India and China. The success of plate & frame heat exchangers in chemical industries of China can be attributed to the high industry fragmentation, strong government influence, tightening of environmental regulations, and growing importance of specialty chemicals.

Product Insights

Shell & tube segment led the industry and accounted for 35.6% of the global revenue demand in 2023. Shell & tube products are built from a bundle of tubes placed in a cylindrical shell with the tube axis parallel to that of shell. Three most common types of shell & tube products are floating-head type, U-tube design, and fixed tube sheet design.

Shell & tube products are used in applications that require a wide temperature and pressure range as well as transfer between two liquids, between liquids & gases, or between two gases. These exchangers have a simple structure and are ideal for heat transfer from steam to water. However, they require large spaces, which is anticipated to hinder the segment’s growth over the forecast period.

Plate & frame product segment is expected to grow at a CAGR of 6.1% over the forecast period. Plate-type exchangers are built of plates either having some form of corrugation or smoothness. These products are classified as brazed, welded, or gasketed depending on the leak tightness required. Plate & frame products are typically used for liquid-liquid exchange at low to medium pressures.

Air-cooled products, also known as air coolers, comprise various components such as a tube bundle, an air-pumping device such as a blower or an axial flow fan, and a support structure. These products are used in petrochemical plants, refineries, compressor stations, gas-treating plants, power plants, and other facilities. Air-cooled products can be installed either vertically, horizontally, or at a sloped angle.

Material Insights

Metals material segment showed lucrative growth from 2024-2030. Metal materials are crucial in heat exchangers due to their inherent properties. High thermal conductivity, exemplified by copper and aluminum, ensures efficient heat transfer. Corrosion-resistant metals like stainless steel enhance durability, guarding against deterioration. Mechanical strength becomes paramount to withstand varying conditions. The judicious selection of these materials strikes a balance between thermal efficiency, resilience, and cost-effectiveness, underscoring their pivotal role in optimizing heat exchange systems.

Alloy materials play a pivotal role in heat exchangers due to their unique combination of properties. The importance lies in achieving a delicate balance between factors such as corrosion resistance, thermal conductivity, and mechanical strength. Alloys like stainless steel provide robust protection against corrosion, while still offering high thermal efficiency and durability, making them essential for optimizing heat transfer processes in a variety of applications.

End-use Insights

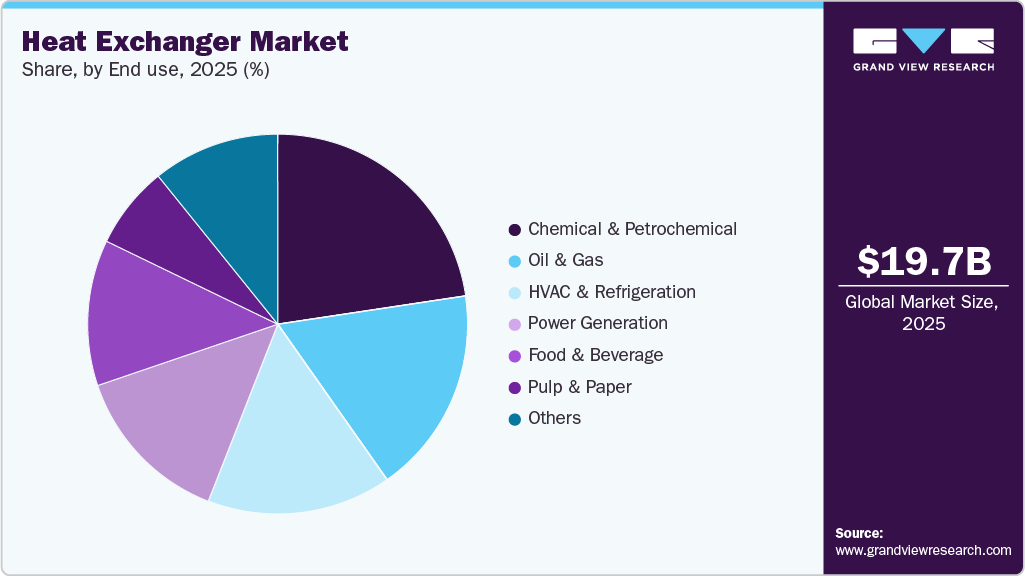
Chemical & petrochemical led the market and accounted for 22.6% of the global revenue demand in 2023. Heat exchangers are used in chemical processing industry (CPI) on account of their properties, such as design flexibility and high corrosion resistance. Their properties provide them with ability to handle fluids having varying levels of solids.

Rising demand for fertilizers, plastics, packaging, digital devices, medical equipment, and clothing is likely to boost petrochemical industry's growth. Furthermore, penetration of petrochemical products in modern energy systems, such as wind turbine blades, solar panels, and electric vehicle parts, is anticipated to drive the industry’s growth. Thus, the above factors are, in turn, likely to drive the demand for these products in chemical & petrochemical industry.

Global Heat Exchangers market share and size, 2022

Heat exchanger demand in oil & gas end-use industry is anticipated to witness growth at a CAGR of 5.0% over the forecast period. Increasing utilization of shale gas in energy and manufacturing industries, along with growing shale gas exploration activities due to technological advancements in exploration, is expected to boost the demand for heat exchangers. Furthermore, rising number of oil & gas projects across various economies is likely to drive industrial growth.

Heat exchangers form an essential part of HVAC systems. Increasing awareness regarding energy conservation and reducing energy bills is expected to augment the demand for heat exchangers in HVAC industry. The products are used in heat recovery process involving steam, water, air, and refrigerants. Surging demand for efficient heat recovery systems offering high corrosion resistance is anticipated to propel the product demand.

Regional Insights

Europe led the market and accounted for 31.7% of the global revenue share in 2023. Rising public and private infrastructure investments are anticipated to drive the demand for these products in HVAC & refrigeration industry. Moreover, increasing demand from several end-use industries for heat exchangers that offer greater durability, enhanced efficiency, and less fouling is expected to drive growth over the forecast period.

Heat Exchangers Trends, by Region, 2023 - 2030

Rising oil & gas exploration activities in the U.S. and Canada are expected to drive the demand for these products in North America. Moreover, increasing energy demand in various industrial and commercial sectors is likely to boost the power and energy sectors, thereby positively impacting the overall market for heat exchangers.

Asia Pacific heat exchanger demand is likely to grow at a CAGR of 6.8% over the forecast period. Rapid industrialization in the developing economies of Asia Pacific coupled with rising investments in manufacturing, commercial, and industrial projects has contributed to the overall growth of the regional market.

China Heat Exchangers Market

Heat exchangers market in China is anticipated to be driven by growing investments in chemical, petrochemical, and HVAC sectors. Factors such as burgeoning population and the government's efforts to enhance country's infrastructure are expected to favor the growth of power generation and HVAC & refrigeration sectors, thereby driving the demand for these products over the forecast period.

Key Companies & Market Share Insights

Global heat exchangers industry is characterized by presence of multinational as well as regional players that are engaged in designing, manufacturing, and distributing these products. Product manufacturers strive to obtain a competitive edge over their competitors by increasing application scope of their products.

Strategies adopted by manufacturers include new product development, diversification, mergers & acquisitions, and geographical expansion. These strategies aid the companies in expanding their market penetration and catering to changing technological demand across various end-use industries.

Key Heat Exchangers Companies:

  • Alfa Laval
  • Danfoss
  • Kelvion Holding GmbH
  • Güntner Group GmbH
  • Xylem Inc
  • API Heat Transfer
  • Mersen
  • Hisaka Works, Ltd.
  • Chart Industries, Inc
  • Johnson Controls International
  • HRS Heat Exchangers
  • SPX FLOW, Inc.
  • Funke Wärmeaustauscher Apparantebau GmbH
  • Koch Heat Transfer Company
  • Southern Heat Exchanger Corporation

Recent Developments:

  • For instance, in April 2023, Kelvion launched dedicated air cooler series for natural refrigerants. The CDF & CDH ranges are dual discharge air coolers highlighting a similar proficient tube system.

  • In May 2023, Alfa Laval is enhancing its brazed plate heat exchanger capacity to bolster the global energy transition. The establishment of new facilities in Italy, China, Sweden, and the U.S. signifies significant progress in their initiative to advance manufacturing intelligence and efficiency throughout the entire supply chain.

  • In January 2021, Alfa Laval, opened a new facility for the production of brazed heat exchangers in San Bonifacio, Italy. The new facility will have more capacity to fulfill the increasing customer demand.

Heat Exchangers Market Report Scope

Report Attribute

Details

Market size value in 2024

USD 18.90 billion

Revenue forecast in 2030

USD 26.26 billion

Growth Rate

CAGR of 5.4% from 2024 to 2030

Actual data

2018 - 2022

Forecast period

2024 - 2030

Quantitative units

Revenue in USD billion and CAGR from 2024 to 2030

Report coverage

Revenue forecast, company ranking, competitive landscape, growth factors, and trends

Segments covered

Product, end-use, material region

Regional scope

North America; Europe; Asia Pacific; Central & South America; Middle East & Africa

Country scope

U.S.; Canada; Mexico; Germany; France; Italy; Spain, UK, China; Japan; India; South Korea, Australia, Brazil; Argentina, Saudi Arabia; UAE, South Africa

Key companies profiled

Alfa Laval; Danfoss; Kelvion Holding GmbH; Güntner Group GmbH; Xylem Inc.; API Heat Transfer; Mersen; Hisaka Works, Ltd.; Chart Industries, Inc.; Johnson Controls International; HRS Heat Exchangers; SPX FLOW, Inc.; Funke Wärmeaustauscher Apparantebau GmbH; Koch Heat Transfer Company; Southern Heat Exchanger Corporation

Customization scope

Free report customization (equivalent up to 8 analysts working days) with purchase. Addition or alteration to country, regional & segment scope.

Pricing and purchase options

Avail customized purchase options to meet your exact research needs. Explore purchase options


Global Heat Exchangers Market Report Segmentation

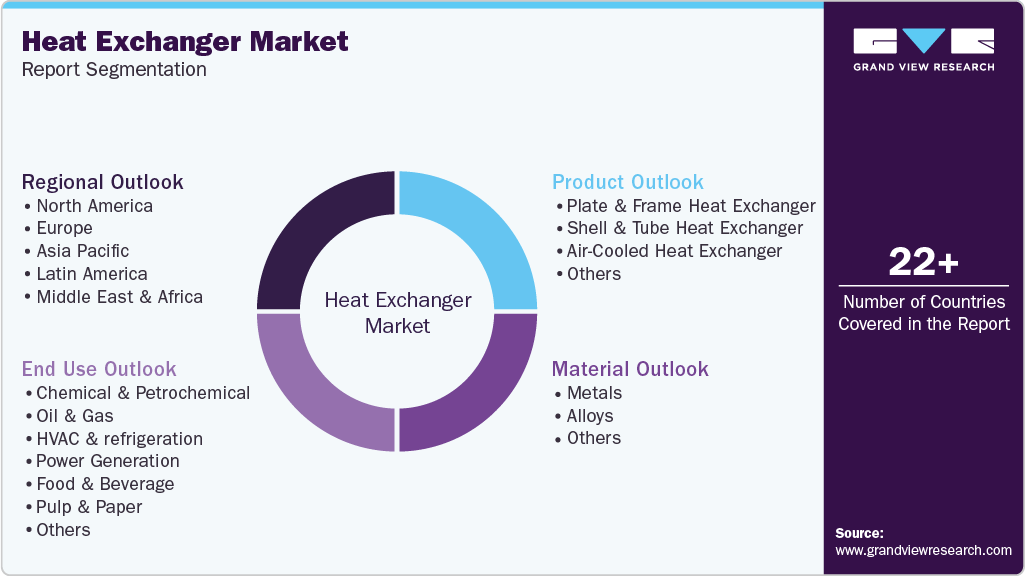
This report forecasts revenue growth at global, regional & country levels and provides an analysis of the latest industry trends in each of the sub-segments from 2018 to 2030. For this study, Grand View Research has segmented the global heat exchangers market report based on product, end-use, material and region:

Global Heat Exchangers Market Report Segmentation

  • Product Outlook (Revenue, USD Billion, 2018 - 2030)

    • Plate & Frame Heat Exchanger

      • Brazed Plate & Frame Heat Exchanger

      • Gasketed Plate & Frame Heat Exchanger

      • Welded Plate & Frame Heat Exchanger

      • Others

    • Shell & Tube Heat Exchanger

    • Air-Cooled Heat Exchanger

    • Others

  • End-use Outlook (Revenue, USD Billion, 2018 - 2030)

    • Chemical & Petrochemical

    • Oil & Gas

    • HVAC & Refrigeration

    • Power GenerationFood & Beverage

    • Pulp & Paper

    • Others

  • Material Outlook (Revenue, USD Billion, 2018 - 2030)

    • Metals

    • Alloys

    • Others

  • Regional Outlook (Revenue, USD Billion, 2018 - 2030)

    • North America

      • U.S.

      • Canada

      • Mexico

    • Europe

      • Germany

      • France

      • Italy

      • Spain

      • UK

    • Asia Pacific

      • China

      • Japan

      • India

      • South Korea

      • Australia

    • Central & South America

      • Brazil

      • Argentina

    • Middle East & Africa

      • Saudi Arabia

      • UAE

      • South Africa

Frequently Asked Questions About This Report

Table of Contents

Chapter 1. Heat Exchangers Market: Methodology and Scope
                   1.1. Research Methodology
                   1.2. Research Scope & Assumption
                   1.3. Information Procurement
                       1.3.1. Purchased Database
                       1.3.2. GVR’s Internal Database
                       1.3.3. Secondary Sources & Third-Party Perspectives
                       1.3.4. Primary Research
                   1.4. Information Analysis
                       1.4.1. Data Analysis Models
                   1.5. Market Formulation & Data Visualization
                   1.6. Data Validation & Publishing
Chapter 2. Heat Exchangers Market: Executive Summary
                   2.1. Market Outlook
                   2.2. Segmental Outlook
                   2.3. Competitive Insights
Chapter 3. Heat Exchanger Market: Variables, Trends & Scope
                   3.1. Market Lineage Outlook
                   3.2. Market Segmentation & Scope
                   3.3. Penetration & Growth Prospect Mapping
                   3.4. Industry Value Chain Analysis
                       3.4.1. Raw Material Outlook
                       3.4.2. Manufacturing Outlook
                       3.4.3. End-user Outlook
                   3.5. Regulatory Framework
                   3.6. Technology Framework
                   3.7. Impact of Free Trade Agreements
                   3.8. Market Dynamics
                       3.8.1. Market Driver Analysis
                       3.8.2. Market Restraint Analysis
                       3.8.3. Industry Challenges
                       3.8.4. Market Opportunity Analysis
                   3.9. Business Environment Analysis
                       3.9.1. Industry Analysis - Porter’s
                           3.9.1.1. Supplier Power
                           3.9.1.2. Buyer Power
                           3.9.1.3. Threat of Substitutes
                           3.9.1.4. Threat of New Entrant
                           3.9.1.5. Competitive Rivalry
                       3.9.2. PESTEL Analysis
                           3.9.2.1. Political Landscape
                           3.9.2.2. Environmental Landscape
                           3.9.2.3. Social Landscape
                           3.9.2.4. Technology Landscape
                           3.9.2.5. Economic Landscape
                           3.9.2.6. Legal Landscape
                   3.10. Economic Mega Trend Analysis
Chapter 4. Heat Exchanger Market - Product Estimates & Trend Analysis
                   4.1. Heat Exchanger Market: Product Movement Analysis & Market Share, 2023 & 2030
                   4.2. Plate & Frame Heat Exchanger
                       4.2.1. Market Estimates & Forecasts, 2018 - 2030 (USD Billion)
                       4.2.2. Brazed Plate & Frame Heat Exchanger
                           4.2.2.1. Market Estimates & Forecasts, 2018 - 2030 (USD Billion)
                       4.2.3. Gasketed Plate & Frame Heat Exchanger
                           4.2.3.1. Market Estimates & Forecasts, 2018 - 2030 (USD Billion)
                       4.2.4. Welded Plate & Frame Heat Exchanger
                           4.2.4.1. Market Estimates & Forecasts, 2018 - 2030 (USD Billion)
                       4.2.5. Others
                           4.2.5.1. Market Estimates & Forecasts, 2018 - 2030 (USD Billion)
                   4.3. Shell & Tube Heat Exchanger
                       4.3.1. Market Estimates & Forecasts, 2018 - 2030 (USD Billion)
                   4.4. Air-Cooled Heat Exchanger
                       4.4.1. Market Estimates & Forecasts, 2018 - 2030 (USD Billion)
                   4.5. Others
                       4.5.1. Market Estimates & Forecasts, 2018 - 2030 (USD Billion)
Chapter 5. Heat Exchanger Market - End-Use Estimates & Trend Analysis
                   5.1. Heat Exchanger Market: End-Use Movement Analysis & Market Share, 2023 & 2030
                   5.2. Chemical & Petrochemical
                       5.2.1. Market Estimates & Forecasts, 2018 - 2030 (USD Billion)
                   5.3. Oil & Gas
                       5.3.1. Market Estimates & Forecasts, 2018 - 2030 (USD Billion)
                   5.4. HVAC & Refrigeration
                       5.4.1. Market Estimates & Forecasts, 2018 - 2030 (USD Billion)
                   5.5. Power Generation
                       5.5.1. Market Estimates & Forecasts, 2018 - 2030 (USD Billion)
                   5.6. Food & Beverage
                       5.6.1. Market Estimates & Forecasts, 2018 - 2030 (USD Billion)
                   5.7. Pulp & Paper
                       5.7.1. Market Estimates & Forecasts, 2018 - 2030 (USD Billion)
                   5.8. Others
                       5.8.1. Market Estimates & Forecasts, 2018 - 2030 (USD Billion)
Chapter 6. Heat Exchanger Market - Material Estimates & Trend Analysis
                   6.1. Heat Exchanger Market: Material Movement Analysis & Market Share, 2023 & 2030
                   6.2. Metals
                       6.2.1. Market Estimates & Forecasts, 2018 - 2030 (USD Billion)
                   6.3. Alloys
                       6.3.1. Market Estimates & Forecasts, 2018 - 2030 (USD Billion)
                   6.4. Others
                       6.4.1. Market Estimates & Forecasts, 2018 - 2030 (USD Billion)
Chapter 7. Heat Exchanger Market - Regional Estimates & Trend Analysis
                   7.1. Heat Exchanger Market: Regional Movement Analysis, 2023 & 2030
                   7.2. North America
                       7.2.1. North America heat exchangers market estimates and forecasts, 2018 - 2030 (USD Billion)
                       7.2.2. North America heat exchangers market estimates and forecasts, by product, 2018 - 2030 (USD Billion)
                           7.2.2.1. North America plate & frame heat exchanger market estimates and forecasts, by product, 2018 - 2030 (USD Billion)
                               7.2.2.1.1. North America brazed plate & frame heat exchanger market estimates and forecasts, 2018 - 2030 (USD Billion)
                               7.2.2.1.2. North America gasketed plate & frame heat exchanger market estimates and forecasts, 2018 - 2030 (USD Billion)
                               7.2.2.1.3. North America welded plate & frame heat exchanger market estimates and forecasts, 2018 - 2030 (USD Billion)
                               7.2.2.1.4. North America others product type market estimates and forecasts, 2018 - 2030 (USD Billion)
                           7.2.2.2. North America shell & tube heat exchanger market estimates and forecasts, 2018 - 2030 (USD Billion)
                           7.2.2.3. North America air-cooled heat exchanger market estimates and forecasts, 2018 - 2030 (USD Billion)
                           7.2.2.4. North America other product heat exchanger market estimates and forecasts, 2018 - 2030 (USD Billion)
                       7.2.3. North America heat exchangers market estimates and forecasts, by end-use, 2018 - 2030 (USD Billion)
                       7.2.4. North America heat exchangers market estimates and forecasts, by material, 2018 - 2030 (USD Billion)
                       7.2.5. U.S.
                           7.2.5.1. U.S. heat exchangers Market estimates and forecasts, 2018 - 2030 (USD Billion)
                           7.2.5.2. U.S. heat exchangers Market estimates and forecasts, by product, 2018 - 2030 (USD Billion)
                               7.2.5.2.1. U.S. plate & frame heat exchanger market estimates and forecasts, by product, 2018 - 2030 (USD Billion)
                                   7.2.5.2.1.1. U.S. brazed plate & frame heat exchanger market estimates and forecasts, 2018 - 2030 (USD Billion)
                                   7.2.5.2.1.2. U.S. gasketed plate & frame heat exchanger market estimates and forecasts, 2018 - 2030 (USD Billion)
                                   7.2.5.2.1.3. U.S. welded plate & frame heat exchanger market estimates and forecasts, 2018 - 2030 (USD Billion)
                                   7.2.5.2.1.4. U.S. others product type market estimates and forecasts, by product, 2018 - 2030 (USD Billion)
                               7.2.5.2.2. U.S. shell & tube heat exchangers market estimates and forecasts, 2018 - 2030 (USD Billion)
                               7.2.5.2.3. U.S. air-cooled heat exchanger market estimates and forecasts, 2018 - 2030 (USD Billion)
                               7.2.5.2.4. U.S. other product heat exchanger market estimates and forecasts, 2018 - 2030 (USD Billion)
                           7.2.5.3. U.S. heat exchangers market estimates and forecasts, by end-use, 2018 - 2030 (USD Billion)
                           7.2.5.4. U.S. heat exchangers Market estimates and forecasts, by material, 2018 - 2030 (USD Billion)
                       7.2.6. Canada
                           7.2.6.1. Canada heat exchangers market estimates and forecasts, 2018 - 2030 (USD Billion)
                           7.2.6.2. Canada heat exchangers market estimates and forecasts, by product, 2018 - 2030 (USD Billion)
                               7.2.6.2.1. Canada plate & frame heat exchanger market estimates and forecasts, by product, 2018 - 2030 (USD Billion)
                                   7.2.6.2.1.1. Canada brazed plate & frame heat exchanger market estimates and forecasts, 2018 - 2030 (USD Billion)
                                   7.2.6.2.1.2. Canada gasketed plate & frame heat exchanger market estimates and forecasts, 2018 - 2030 (USD Billion)
                                   7.2.6.2.1.3. Canada welded plate & frame heat exchanger market estimates and forecasts, 2018 - 2030 (USD Billion)
                                   7.2.6.2.1.4. Canada others product type market estimates and forecasts, 2018 - 2030 (USD Billion)
                               7.2.6.2.2. Canada shell & tube heat exchangers market estimates and forecasts, 2018 - 2030 (USD Billion)
                               7.2.6.2.3. Canada air-cooled heat exchanger market estimates and forecasts, 2018 - 2030 (USD Billion)
                               7.2.6.2.4. Canada other product heat exchanger market estimates and forecasts, 2018 - 2030 (USD Billion)
                           7.2.6.3. Canada heat exchangers market estimates and forecasts, by end-use, 2018 - 2030 (USD Billion)
                           7.2.6.4. Canada heat exchangers market estimates and forecasts, by material, 2018 - 2030 (USD Billion)
                       7.2.7. Mexico
                           7.2.7.1. Mexico heat exchangers market estimates and forecasts, 2018 - 2030 (USD Billion)
                           7.2.7.2. Mexico heat exchangers market estimates and forecasts, by product, 2018 - 2030 (USD Billion)
                               7.2.7.2.1. Mexico plate & frame heat exchanger market estimates and forecasts, by product, 2018 - 2030 (USD Billion)
                                   7.2.7.2.1.1. Mexico brazed plate & frame heat exchanger market estimates and forecasts, 2018 - 2030 (USD Billion)
                                   7.2.7.2.1.2. Mexico gasketed plate & frame heat exchanger market estimates and forecasts, 2018 - 2030 (USD Billion)
                                   7.2.7.2.1.3. Mexico welded plate & frame heat exchanger market estimates and forecasts, 2018 - 2030 (USD Billion)
                                   7.2.7.2.1.4. Mexico others product type market estimates and forecasts, 2018 - 2030 (USD Billion)
                               7.2.7.2.2. Mexico shell & tube heat exchangers market estimates and forecasts, 2018 - 2030 (USD Billion)
                               7.2.7.2.3. Mexico air-cooled heat exchanger market estimates and forecasts, 2018 - 2030 (USD Billion)
                               7.2.7.2.4. Mexico other product heat exchanger market estimates and forecasts, 2018 - 2030 (USD Billion)
                           7.2.7.3. Mexico heat exchangers market estimates and forecasts, by end-use, 2018 - 2030 (USD Billion)
                           7.2.7.4. Mexico heat exchangers market estimates and forecasts, by material, 2018 - 2030 (USD Billion)
                   7.3. Europe
                       7.3.1. Europe heat exchangers market estimates and forecasts, 2018 - 2030 (USD Billion)
                       7.3.2. Europe heat exchangers market estimates and forecasts, by product, 2018 - 2030 (USD Billion)
                           7.3.2.1. Europe plate & frame heat exchanger market estimates and forecasts, by product, 2018 - 2030 (USD Billion)
                               7.3.2.1.1. Europe brazed plate & frame heat exchanger market estimates and forecasts, 2018 - 2030 (USD Billion)
                               7.3.2.1.2. Europe gasketed plate & frame heat exchanger market estimates and forecasts, 2018 - 2030 (USD Billion)
                               7.3.2.1.3. Europe welded plate & frame heat exchanger market estimates and forecasts, 2018 - 2030 (USD Billion)
                               7.3.2.1.4. Europe others product type market estimates and forecasts, 2018 - 2030 (USD Billion)
                           7.3.2.2. Europe shell & tube heat exchanger market estimates and forecasts, 2018 - 2030 (USD Billion)
                           7.3.2.3. Europe air-cooled heat exchanger market estimates and forecasts, 2018 - 2030 (USD Billion)
                           7.3.2.4. Europe a other product heat exchanger market estimates and forecasts, 2018 - 2030 (USD Billion)
                       7.3.3. Europe heat exchangers market estimates and forecasts, by end-use, 2018 - 2030 (USD Billion)
                       7.3.4. Europe heat exchangers market estimates and forecasts, by material, 2018 - 2030 (USD Billion)
                       7.3.5. Germany
                           7.3.5.1. Germany heat exchangers market estimates and forecasts, 2018 - 2030 (USD Billion)
                           7.3.5.2. Germany heat exchangers market estimates and forecasts, by product, 2018 - 2030 (USD Billion)
                               7.3.5.2.1. Germany plate & frame heat exchanger market estimates and forecasts, by product, 2018 - 2030 (USD Billion)
                                   7.3.5.2.1.1. Germany brazed plate & frame heat exchanger market estimates and forecasts, 2018 - 2030 (USD Billion)
                                   7.3.5.2.1.2. Germany gasketed plate & frame heat exchanger market estimates and forecasts, 2018 - 2030 (USD Billion)
                                   7.3.5.2.1.3. Germany welded plate & frame heat exchanger market estimates and forecasts, 2018 - 2030 (USD Billion)
                                   7.3.5.2.1.4. Germany others product type market estimates and forecasts, 2018 - 2030 (USD Billion)
                               7.3.5.2.2. Germany shell & tube heat exchangers market estimates and forecasts, 2018 - 2030 (USD Billion)
                               7.3.5.2.3. Germany air-cooled heat exchanger market estimates and forecasts, 2018 - 2030 (USD Billion)
                               7.3.5.2.4. Germany other product heat exchanger market estimates and forecasts, 2018 - 2030 (USD Billion)
                           7.3.5.3. Germany heat exchangers market estimates and forecasts, by end-use, 2018 - 2030 (USD Billion)
                           7.3.5.4. Germany heat exchangers market estimates and forecasts, by material, 2018 - 2030 (USD Billion)
                       7.3.6. France
                           7.3.6.1. France heat exchangers market estimates and forecasts, 2018 - 2030 (USD Billion)
                           7.3.6.2. France heat exchangers market estimates and forecasts, by product, 2018 - 2030 (USD Billion)
                               7.3.6.2.1. France plate & frame heat exchanger market estimates and forecasts, by product, 2018 - 2030 (USD Billion)
                                   7.3.6.2.1.1. France brazed plate & frame heat exchanger market estimates and forecasts, 2018 - 2030 (USD Billion)
                                   7.3.6.2.1.2. France gasketed plate & frame heat exchanger market estimates and forecasts, 2018 - 2030 (USD Billion)
                                   7.3.6.2.1.3. France welded plate & frame heat exchanger market estimates and forecasts, 2018 - 2030 (USD Billion)
                                   7.3.6.2.1.4. France others product type market estimates and forecasts2018 - 2030 (USD Billion)
                               7.3.6.2.2. France shell & tube heat exchangers market estimates and forecasts, 2018 - 2030 (USD Billion)
                               7.3.6.2.3. France air-cooled heat exchanger market estimates and forecasts, 2018 - 2030 (USD Billion)
                               7.3.6.2.4. France other product heat exchanger market estimates and forecasts, 2018 - 2030 (USD Billion)
                           7.3.6.3. France heat exchangers market estimates and forecasts, by end-use, 2018 - 2030 (USD Billion)
                           7.3.6.4. France heat exchangers market estimates and forecasts, by material, 2018 - 2030 (USD Billion)
                       7.3.7. Italy
                           7.3.7.1. Italy heat exchangers market estimates and forecasts, 2018 - 2030 (USD Billion)
                           7.3.7.2. Italy heat exchangers market estimates and forecasts, by product, 2018 - 2030 (USD Billion)
                               7.3.7.2.1. Italy plate & frame heat exchanger market estimates and forecasts, by product, 2018 - 2030 (USD Billion)
                                   7.3.7.2.1.1. Italy brazed plate & frame heat exchanger market estimates and forecasts, 2018 - 2030 (USD Billion)
                                   7.3.7.2.1.2. Italy gasketed plate & frame heat exchanger market estimates and forecasts, 2018 - 2030 (USD Billion)
                                   7.3.7.2.1.3. Italy welded plate & frame heat exchanger market estimates and forecasts, 2018 - 2030 (USD Billion)
                                   7.3.7.2.1.4. Italy others product type market estimates and forecasts, 2018 - 2030 (USD Billion)
                               7.3.7.2.2. Italy shell & tube heat exchangers market estimates and forecasts, 2018 - 2030 (USD Billion)
                               7.3.7.2.3. Italy air-cooled heat exchanger market estimates and forecasts, 2018 - 2030 (USD Billion)
                               7.3.7.2.4. Italy other product heat exchanger market estimates and forecasts, 2018 - 2030 (USD Billion)
                           7.3.7.3. Italy heat exchangers market estimates and forecasts, by end-use, 2018 - 2030 (USD Billion)
                           7.3.7.4. Italy heat exchangers market estimates and forecasts, by material, 2018 - 2030 (USD Billion)
                       7.3.8. Spain
                           7.3.8.1. Spain heat exchangers market estimates and forecasts, 2018 - 2030 (USD Billion)
                           7.3.8.2. Spain heat exchangers market estimates and forecasts, by product, 2018 - 2030 (USD Billion)
                               7.3.8.2.1. Spain plate & frame heat exchanger market estimates and forecasts, by product, 2018 - 2030 (USD Billion)
                                   7.3.8.2.1.1. Spain brazed plate & frame heat exchanger market estimates and forecasts, 2018 - 2030 (USD Billion)
                                   7.3.8.2.1.2. Spain gasketed plate & frame heat exchanger market estimates and forecasts, 2018 - 2030 (USD Billion)
                                   7.3.8.2.1.3. Spain welded plate & frame heat exchanger market estimates and forecasts, 2018 - 2030 (USD Billion)
                                   7.3.8.2.1.4. Spain others product type market estimates and forecasts, 2018 - 2030 (USD Billion)
                               7.3.8.2.2. Spain shell & tube heat exchangers market estimates and forecasts, 2018 - 2030 (USD Billion)
                               7.3.8.2.3. Spain air-cooled heat exchanger market estimates and forecasts, 2018 - 2030 (USD Billion)
                               7.3.8.2.4. Spain other product heat exchanger market estimates and forecasts, 2018 - 2030 (USD Billion)
                           7.3.8.3. Spain heat exchangers market estimates and forecasts, by end-use, 2018 - 2030 (USD Billion)
                           7.3.8.4. Spain heat exchangers market estimates and forecasts, by material, 2018 - 2030 (USD Billion)
                       7.3.9. UK
                           7.3.9.1. UK heat exchangers market estimates and forecasts, 2018 - 2030 (USD Billion)
                           7.3.9.2. UK heat exchangers market estimates and forecasts, by product, 2018 - 2030 (USD Billion)
                               7.3.9.2.1. UK plate & frame heat exchanger market estimates and forecasts, by product, 2018 - 2030 (USD Billion)
                                   7.3.9.2.1.1. UK brazed plate & frame heat exchanger market estimates and forecasts, 2018 - 2030 (USD Billion)
                                   7.3.9.2.1.2. UK gasketed plate & frame heat exchanger market estimates and forecasts, 2018 - 2030 (USD Billion)
                                   7.3.9.2.1.3. UK welded plate & frame heat exchanger market estimates and forecasts, 2018 - 2030 (USD Billion)
                                   7.3.9.2.1.4. UK others product type market estimates and forecasts, 2018 - 2030 (USD Billion)
                               7.3.9.2.2. UK shell & tube heat exchangers market estimates and forecasts, 2018 - 2030 (USD Billion)
                               7.3.9.2.3. UK air-cooled heat exchanger market estimates and forecasts, 2018 - 2030 (USD Billion)
                               7.3.9.2.4. UK other product heat exchanger market estimates and forecasts, 2018 - 2030 (USD Billion)
                           7.3.9.3. UK heat exchangers market estimates and forecasts, by end-use, 2018 - 2030 (USD Billion)
                           7.3.9.4. UK heat exchangers market estimates and forecasts, by material, 2018 - 2030 (USD Billion)
                   7.4. Asia Pacific
                       7.4.1. Asia Pacific heat exchangers market estimates and forecasts, 2018 - 2030 (USD Billion)
                       7.4.2. Asia Pacific heat exchangers market estimates and forecasts, by product, 2018 - 2030 (USD Billion)
                           7.4.2.1. Asia Pacific plate & frame heat exchanger market estimates and forecasts, by product, 2018 - 2030 (USD Billion)
                               7.4.2.1.1. Asia Pacific brazed plate & frame heat exchanger market estimates and forecasts, 2018 - 2030 (USD Billion)
                               7.4.2.1.2. Asia Pacific gasketed plate & frame heat exchanger market estimates and forecasts, 2018 - 2030 (USD Billion)
                               7.4.2.1.3. Asia Pacific welded plate & frame heat exchanger market estimates and forecasts, 2018 - 2030 (USD Billion)
                               7.4.2.1.4. Asia Pacific others product type market estimates and forecasts, 2018 - 2030 (USD Billion)
                           7.4.2.2. Asia Pacific shell & tube heat exchanger market estimates and forecasts, 2018 - 2030 (USD Billion)
                           7.4.2.3. Asia Pacific air-cooled heat exchanger market estimates and forecasts, 2018 - 2030 (USD Billion)
                           7.4.2.4. Asia Pacific other product heat exchanger market estimates and forecasts, 2018 - 2030 (USD Billion)
                       7.4.3. Asia Pacific heat exchangers market estimates and forecasts, by end-use, 2018 - 2030 (USD Billion)
                       7.4.4. Asia Pacific heat exchangers market estimates and forecasts, by material, 2018 - 2030 (USD Billion)
                       7.4.5. China
                           7.4.5.1. China heat exchangers market estimates and forecasts, 2018 - 2030 (USD Billion)
                           7.4.5.2. China heat exchangers market estimates and forecasts, by product, 2018 - 2030 (USD Billion)
                               7.4.5.2.1. China plate & frame heat exchanger market estimates and forecasts, by product, 2018 - 2030 (USD Billion)
                                   7.4.5.2.1.1. China brazed plate & frame heat exchanger market estimates and forecasts, 2018 - 2030 (USD Billion)
                                   7.4.5.2.1.2. China gasketed plate & frame heat exchanger market estimates and forecasts, 2018 - 2030 (USD Billion)
                                   7.4.5.2.1.3. China welded plate & frame heat exchanger market estimates and forecasts, 2018 - 2030 (USD Billion)
                                   7.4.5.2.1.4. China others product type market estimates and forecasts, 2018 - 2030 (USD Billion)
                               7.4.5.2.2. China shell & tube heat exchangers market estimates and forecasts, 2018 - 2030 (USD Billion)
                               7.4.5.2.3. China air-cooled heat exchanger market estimates and forecasts, 2018 - 2030 (USD Billion)
                               7.4.5.2.4. China other product heat exchanger market estimates and forecasts, 2018 - 2030 (USD Billion)
                           7.4.5.3. China heat exchangers market estimates and forecasts, by end-use, 2018 - 2030 (USD Billion)
                           7.4.5.4. China heat exchangers market estimates and forecasts, by material, 2018 - 2030 (USD Billion)
                       7.4.6. Japan
                           7.4.6.1. Japan heat exchangers market estimates and forecasts, 2018 - 2030 (USD Billion)
                           7.4.6.2. Japan heat exchangers market estimates and forecasts, by product, 2018 - 2030 (USD Billion)
                               7.4.6.2.1. Japan plate & frame heat exchanger market estimates and forecasts, by product, 2018 - 2030 (USD Billion)
                                   7.4.6.2.1.1. Japan brazed plate & frame heat exchanger market estimates and forecasts, 2018 - 2030 (USD Billion)
                                   7.4.6.2.1.2. Japan gasketed plate & frame heat exchanger market estimates and forecasts, 2018 - 2030 (USD Billion)
                                   7.4.6.2.1.3. Japan welded plate & frame heat exchanger market estimates and forecasts, 2018 - 2030 (USD Billion)
                                   7.4.6.2.1.4. Japan others product type market estimates and forecasts, 2018 - 2030 (USD Billion)
                               7.4.6.2.2. Japan shell & tube heat exchangers market estimates and forecasts, 2018 - 2030 (USD Billion)
                               7.4.6.2.3. Japan air-cooled heat exchanger market estimates and forecasts, 2018 - 2030 (USD Billion)
                               7.4.6.2.4. Japan other product heat exchanger market estimates and forecasts, 2018 - 2030 (USD Billion)
                           7.4.6.3. Japan heat exchangers market estimates and forecasts, by end-use, 2018 - 2030 (USD Billion)
                           7.4.6.4. Japan heat exchangers market estimates and forecasts, by material, 2018 - 2030 (USD Billion)
                       7.4.7. India
                           7.4.7.1. India heat exchangers market estimates and forecasts, 2018 - 2030 (USD Billion)
                           7.4.7.2. India heat exchangers market estimates and forecasts, by product, 2018 - 2030 (USD Billion)
                               7.4.7.2.1. India plate & frame heat exchanger market estimates and forecasts, by product, 2018 - 2030 (USD Billion)
                                   7.4.7.2.1.1. India brazed plate & frame heat exchanger market estimates and forecasts, 2018 - 2030 (USD Billion)
                                   7.4.7.2.1.2. India gasketed plate & frame heat exchanger market estimates and forecasts, 2018 - 2030 (USD Billion)
                                   7.4.7.2.1.3. India welded plate & frame heat exchanger market estimates and forecasts, 2018 - 2030 (USD Billion)
                                   7.4.7.2.1.4. India others product type market estimates and forecasts, 2018 - 2030 (USD Billion)
                               7.4.7.2.2. India shell & tube heat exchangers market estimates and forecasts, 2018 - 2030 (USD Billion)
                               7.4.7.2.3. India air-cooled heat exchanger market estimates and forecasts, 2018 - 2030 (USD Billion)
                               7.4.7.2.4. India other product heat exchanger market estimates and forecasts, 2018 - 2030 (USD Billion)
                           7.4.7.3. India heat exchangers market estimates and forecasts, by end-use, 2018 - 2030 (USD Billion)
                           7.4.7.4. India heat exchangers market estimates and forecasts, by material, 2018 - 2030 (USD Billion)
                       7.4.8. Australia
                           7.4.8.1. Market estimates and forecasts, 2018 - 2030 (USD Billion)
                           7.4.8.2. Market estimates and forecasts, by product, 2018 - 2030 (USD Billion)
                               7.4.8.2.1. Plate & frame heat exchanger market estimates and forecasts, by product, 2018 - 2030 (USD Billion)
                                   7.4.8.2.1.1. Brazed plate & frame heat exchanger market estimates and forecasts, by product, 2018 - 2030 (USD Billion)
                                   7.4.8.2.1.2. Gasketed plate & frame heat exchanger market estimates and forecasts, 2018 - 2030 (USD Billion)
                                   7.4.8.2.1.3. Welded plate & frame heat exchanger market estimates and forecasts, 2018 - 2030 (USD Billion)
                                   7.4.8.2.1.4. Others market estimates and forecasts, by product, 2018 - 2030 (USD Billion)
                           7.4.8.3. Market estimates and forecasts, by end-use, 2018 - 2030 (USD Billion)
                           7.4.8.4. Market estimates and forecasts, by material, 2018 - 2030 (USD Billion)
                       7.4.9. South Korea
                           7.4.9.1. South Korea heat exchangers market estimates and forecasts, 2018 - 2030 (USD Billion)
                           7.4.9.2. South Korea heat exchangers market estimates and forecasts, by product, 2018 - 2030 (USD Billion)
                               7.4.9.2.1. South Korea plate & frame heat exchanger market estimates and forecasts, by product, 2018 - 2030 (USD Billion)
                                   7.4.9.2.1.1. South Korea brazed plate & frame heat exchanger market estimates and forecasts, 2018 - 2030 (USD Billion)
                                   7.4.9.2.1.2. South Korea gasketed plate & frame heat exchanger market estimates and forecasts, 2018 - 2030 (USD Billion)
                                   7.4.9.2.1.3. South Korea welded plate & frame heat exchanger market estimates and forecasts, 2018 - 2030 (USD Billion)
                                   7.4.9.2.1.4. South Korea others product type market estimates and forecasts, 2018 - 2030 (USD Billion)
                               7.4.9.2.2. South Korea shell & tube heat exchangers market estimates and forecasts, 2018 - 2030 (USD Billion)
                               7.4.9.2.3. South Korea air-cooled heat exchanger market estimates and forecasts, 2018 - 2030 (USD Billion)
                               7.4.9.2.4. South Korea other product heat exchanger market estimates and forecasts, 2018 - 2030 (USD Billion)
                           7.4.9.3. South Korea heat exchangers market estimates and forecasts, by end-use, 2018 - 2030 (USD Billion)
                           7.4.9.4. South Korea heat exchangers market estimates and forecasts, by material, 2018 - 2030 (USD Billion)
                   7.5. Central & South America
                       7.5.1. Central & South America heat exchangers market estimates and forecasts, 2018 - 2030 (USD Billion)
                       7.5.2. Central & South America heat exchangers market estimates and forecasts, by product, 2018 - 2030 (USD Billion)
                           7.5.2.1. Central & South America plate & frame heat exchanger market estimates and forecasts, by product, 2018 - 2030 (USD Billion)
                               7.5.2.1.1. Central & South America brazed plate & frame heat exchanger market estimates and forecasts, 2018 - 2030 (USD Billion)
                               7.5.2.1.2. Central & South America gasketed plate & frame heat exchanger market estimates and forecasts, 2018 - 2030 (USD Billion)
                               7.5.2.1.3. Central & South America welded plate & frame heat exchanger market estimates and forecasts, 2018 - 2030 (USD Billion)
                               7.5.2.1.4. Central & South America others product type market estimates and forecasts, 2018 - 2030 (USD Billion)
                           7.5.2.2. Central & South America shell & tube heat exchanger market estimates and forecasts, 2018 - 2030 (USD Billion)
                           7.5.2.3. Central & South America air-cooled heat exchanger market estimates and forecasts, 2018 - 2030 (USD Billion)
                           7.5.2.4. Central & South America other product heat exchanger market estimates and forecasts, 2018 - 2030 (USD Billion)
                       7.5.3. Central & South America heat exchangers market estimates and forecasts, by end-use, 2018 - 2030 (USD Billion)
                       7.5.4. Central & South America heat exchangers market estimates and forecasts, by material, 2018 - 2030 (USD Billion)
                       7.5.5. Brazil
                           7.5.5.1. Brazil heat exchangers market estimates and forecasts, 2018 - 2030 (USD Billion)
                           7.5.5.2. Brazil heat exchangers market estimates and forecasts, by product, 2018 - 2030 (USD Billion)
                               7.5.5.2.1. Brazil plate & frame heat exchanger market estimates and forecasts, by product, 2018 - 2030 (USD Billion)
                                   7.5.5.2.1.1. Brazil brazed plate & frame heat exchanger market estimates and forecasts, 2018 - 2030 (USD Billion)
                                   7.5.5.2.1.2. Brazil gasketed plate & frame heat exchanger market estimates and forecasts, 2018 - 2030 (USD Billion)
                                   7.5.5.2.1.3. Brazil welded plate & frame heat exchanger market estimates and forecasts, 2018 - 2030 (USD Billion)
                                   7.5.5.2.1.4. Brazil others product type market estimates and forecasts, by product, 2018 - 2030 (USD Billion)
                               7.5.5.2.2. Brazil shell & tube heat exchangers market estimates and forecasts, 2018 - 2030 (USD Billion)
                               7.5.5.2.3. Brazil air-cooled heat exchanger market estimates and forecasts, 2018 - 2030 (USD Billion)
                               7.5.5.2.4. Brazil other product heat exchanger market estimates and forecasts, 2018 - 2030 (USD Billion)
                           7.5.5.3. Brazil heat exchangers market estimates and forecasts, by end-use, 2018 - 2030 (USD Billion)
                           7.5.5.4. Brazil heat exchangers market estimates and forecasts, by material, 2018 - 2030 (USD Billion)
                       7.5.6. Argentina
                           7.5.6.1. Argentina heat exchangers market estimates and forecasts, 2018 - 2030 (USD Billion)
                           7.5.6.2. Argentina heat exchangers market estimates and forecasts, by product, 2018 - 2030 (USD Billion)
                               7.5.6.2.1. Argentina plate & frame heat exchanger market estimates and forecasts, by product, 2018 - 2030 (USD Billion)
                                   7.5.6.2.1.1. Argentina brazed plate & frame heat exchanger market estimates and forecasts, 2018 - 2030 (USD Billion)
                                   7.5.6.2.1.2. Argentina gasketed plate & frame heat exchanger market estimates and forecasts, 2018 - 2030 (USD Billion)
                                   7.5.6.2.1.3. Argentina welded plate & frame heat exchanger market estimates and forecasts, 2018 - 2030 (USD Billion)
                                   7.5.6.2.1.4. Argentina others product type market estimates and forecasts, 2018 - 2030 (USD Billion)
                               7.5.6.2.2. Argentina shell & tube heat exchangers market estimates and forecasts, 2018 - 2030 (USD Billion)
                               7.5.6.2.3. Argentina air-cooled heat exchanger market estimates and forecasts, 2018 - 2030 (USD Billion)
                               7.5.6.2.4. Argentina other product heat exchanger market estimates and forecasts, 2018 - 2030 (USD Billion)
                           7.5.6.3. Argentina heat exchangers market estimates and forecasts, by end-use, 2018 - 2030 (USD Billion)
                           7.5.6.4. Argentina heat exchangers market estimates and forecasts, by material, 2018 - 2030 (USD Billion)
                   7.6. Middle East & Africa
                       7.6.1. Middle East & Africa heat exchangers market estimates and forecasts, 2018 - 2030 (USD Billion)
                       7.6.2. Middle East & Africa heat exchangers market estimates and forecasts, by product, 2018 - 2030 (USD Billion)
                           7.6.2.1. Middle East & Africa plate & frame heat exchanger market estimates and forecasts, by product, 2018 - 2030 (USD Billion)
                               7.6.2.1.1. Middle East & Africa brazed plate & frame heat exchanger market estimates and forecasts, 2018 - 2030 (USD Billion)
                               7.6.2.1.2. Middle East & Africa gasketed plate & frame heat exchanger market estimates and forecasts, 2018 - 2030 (USD Billion)
                               7.6.2.1.3. Middle East & Africa welded plate & frame heat exchanger market estimates and forecasts, 2018 - 2030 (USD Billion)
                               7.6.2.1.4. Middle East & Africa others product type market estimates and forecasts, 2018 - 2030 (USD Billion)
                           7.6.2.2. Middle East & Africa shell & tube heat exchanger market estimates and forecasts, 2018 - 2030 (USD Billion)
                           7.6.2.3. Middle East & Africa air-cooled heat exchanger market estimates and forecasts, 2018 - 2030 (USD Billion)
                           7.6.2.4. Middle East & Africa other product heat exchanger market estimates and forecasts, 2018 - 2030 (USD Billion)
                       7.6.3. Middle East & Africa heat exchangers market estimates and forecasts, by end-use, 2018 - 2030 (USD Billion)
                       7.6.4. Middle East & Africa heat exchangers market estimates and forecasts, by material, 2018 - 2030 (USD Billion)
                       7.6.5. Saudi Arabia
                           7.6.5.1. Saudi Arabia heat exchangers market estimates and forecasts, 2018 - 2030 (USD Billion)
                           7.6.5.2. Saudi Arabia heat exchangers market estimates and forecasts, by product, 2018 - 2030 (USD Billion)
                               7.6.5.2.1. Saudi Arabia plate & frame heat exchanger market estimates and forecasts, by product, 2018 - 2030 (USD Billion)
                                   7.6.5.2.1.1. Saudi Arabia brazed plate & frame heat exchanger market estimates and forecasts, 2018 - 2030 (USD Billion)
                                   7.6.5.2.1.2. Saudi Arabia gasketed plate & frame heat exchanger market estimates and forecasts, 2018 - 2030 (USD Billion)
                                   7.6.5.2.1.3. Saudi Arabia welded plate & frame heat exchanger market estimates and forecasts, 2018 - 2030 (USD Billion)
                                   7.6.5.2.1.4. Saudi Arabia others product type market estimates and forecasts, 2018 - 2030 (USD Billion)
                               7.6.5.2.2. Saudi Arabia shell & tube heat exchangers market estimates and forecasts, 2018 - 2030 (USD Billion)
                               7.6.5.2.3. Saudi Arabia air-cooled heat exchanger market estimates and forecasts, 2018 - 2030 (USD Billion)
                               7.6.5.2.4. Saudi Arabia other product heat exchanger market estimates and forecasts, 2018 - 2030 (USD Billion)
                           7.6.5.3. Saudi Arabia heat exchangers market estimates and forecasts, by end-use, 2018 - 2030 (USD Billion)
                           7.6.5.4. Saudi Arabia heat exchangers market estimates and forecasts, by material, 2018 - 2030 (USD Billion)
                       7.6.6. UAE
                           7.6.6.1. UAE heat exchangers market estimates and forecasts, 2018 - 2030 (USD Billion)
                           7.6.6.2. UAE heat exchangers market estimates and forecasts, by product, 2018 - 2030 (USD Billion)
                               7.6.6.2.1. UAE plate & frame heat exchanger market estimates and forecasts, by product, 2018 - 2030 (USD Billion)
                                   7.6.6.2.1.1. UAE brazed plate & frame heat exchanger market estimates and forecasts, 2018 - 2030 (USD Billion)
                                   7.6.6.2.1.2. UAE gasketed plate & frame heat exchanger market estimates and forecasts, 2018 - 2030 (USD Billion)
                                   7.6.6.2.1.3. UAE welded plate & frame heat exchanger market estimates and forecasts, 2018 - 2030 (USD Billion)
                                   7.6.6.2.1.4. UAE others product type market estimates and forecasts, 2018 - 2030 (USD Billion)
                               7.6.6.2.2. UAE shell & tube heat exchangers market estimates and forecasts, 2018 - 2030 (USD Billion)
                               7.6.6.2.3. UAE air-cooled heat exchanger market estimates and forecasts, 2018 - 2030 (USD Billion)
                               7.6.6.2.4. UAE other product heat exchanger market estimates and forecasts, 2018 - 2030 (USD Billion)
                           7.6.6.3. UAE heat exchangers market estimates and forecasts, by end-use, 2018 - 2030 (USD Billion)
                           7.6.6.4. UAE heat exchangers market estimates and forecasts, by material, 2018 - 2030 (USD Billion)
                       7.6.7. South Africa
                           7.6.7.1. South Africa heat exchangers market estimates and forecasts, 2018 - 2030 (USD Billion)
                           7.6.7.2. South Africa heat exchangers market estimates and forecasts, by product, 2018 - 2030 (USD Billion)
                               7.6.7.2.1. South Africa plate & frame heat exchanger market estimates and forecasts, by product, 2018 - 2030 (USD Billion)
                                   7.6.7.2.1.1. South Africa brazed plate & frame heat exchanger market estimates and forecasts, 2018 - 2030 (USD Billion)
                                   7.6.7.2.1.2. South Africa gasketed plate & frame heat exchanger market estimates and forecasts, 2018 - 2030 (USD Billion)
                                   7.6.7.2.1.3. South Africa welded plate & frame heat exchanger market estimates and forecasts, 2018 - 2030 (USD Billion)
                                   7.6.7.2.1.4. South Africa others product type market estimates and forecasts, 2018 - 2030 (USD Billion)
                               7.6.7.2.2. South Africa shell & tube heat exchangers market estimates and forecasts, 2018 - 2030 (USD Billion)
                               7.6.7.2.3. South Africa air-cooled heat exchanger market estimates and forecasts, 2018 - 2030 (USD Billion)
                               7.6.7.2.4. South Africa other product heat exchanger market estimates and forecasts, 2018 - 2030 (USD Billion)
                           7.6.7.3. South Africa heat exchangers market estimates and forecasts, by end-use, 2018 - 2030 (USD Billion)
                           7.6.7.4. South Africa heat exchangers market estimates and forecasts, by material, 2018 - 2030 (USD Billion)
Chapter 8. Competitive Analysis
                   8.1. Recent Developments & Impact Analysis, By Key Market Participants
                   8.2. Company Categorization
                   8.3. Company Market Share Analysis, 2023
                   8.4. Company Market Positioning
                   8.5. Competitive Dashboard Analysis
                   8.6. Company Heat Map Analysis, 2023
                   8.7. Strategy Mapping
                   8.8. Expansion
                       8.8.1. Mergers & Acquisition
                       8.8.2. Partnerships & Collaborations
                       8.8.3. New Product Launches
                       8.8.4. Research And Development
                   8.9. Company Profiles
                       8.9.1. Alfa Laval
                           8.9.1.1. Company Overview
                           8.9.1.2. Financial Performance
                           8.9.1.3. Product Benchmarking
                           8.9.1.4. Strategic Initiatives
                       8.9.2. Danfoss
                            8.9.2.1. Company Overview
                            8.9.2.2. Financial Performance
                            8.9.2.3. Product Benchmarking
                            8.9.2.4. Strategic Initiatives
                       8.9.3. Kelvion Holding GmbH
                           8.9.3.1. Company Overview
                           8.9.3.2. Financial Performance
                           8.9.3.3. Product Benchmarking
                           8.9.3.4. Strategic Initiatives
                       8.9.4. Güntner Group GmbH
                           8.9.4.1. Company Overview
                           8.9.4.2. Financial Performance
                           8.9.4.3. Product Benchmarking
                           8.9.4.4. Strategic Initiatives
                       8.9.5. Xylem Inc.
                           8.9.5.1. Company Overview
                           8.9.5.2. Financial Performance
                           8.9.5.3. Product Benchmarking
                           8.9.5.4. Strategic Initiatives
                       8.9.6. API Heat Transfer
                           8.9.6.1. Company Overview
                           8.9.6.2. Financial Performance
                           8.9.6.3. Product Benchmarking
                           8.9.6.4. Strategic Initiatives
                       8.9.7. Mersen
                           8.9.7.1. Company Overview
                           8.9.7.2. Financial Performance
                           8.9.7.3. Product Benchmarking
                           8.9.7.4. Strategic Initiatives
                       8.9.8. Hisaka Works, Ltd.
                           8.9.8.1. Company Overview
                           8.9.8.2. Financial Performance
                           8.9.8.3. Product Benchmarking
                           8.9.8.4. Strategic Initiatives
                       8.9.9. Chart Industries, Inc.
                           8.9.9.1. Company Overview
                           8.9.9.2. Financial Performance
                           8.9.9.3. Product Benchmarking
                           8.9.9.4. Strategic Initiatives
                       8.9.10. Johnson Controls International
                           8.9.10.1. Company Overview
                           8.9.10.2. Financial Performance
                           8.9.10.3. Product Benchmarking
                           8.9.10.4. Strategic Initiatives
                       8.9.11. HRS Heat Exchangers
                           8.9.11.1. Company Overview
                           8.9.11.2. Financial Performance
                           8.9.11.3. Product Benchmarking
                           8.9.11.4. Strategic Initiatives
                       8.9.12. SPX FLOW, Inc.
                           8.9.12.1. Company Overview
                           8.9.12.2. Financial Performance
                           8.9.12.3. Product Benchmarking
                           8.9.12.4. Strategic Initiatives
                       8.9.13. Funke Wärmeaustauscher Apparantebau GmbH
                           8.9.13.1. Company Overview
                           8.9.13.2. Financial Performance
                           8.9.13.3. Product Benchmarking
                           8.9.13.4. Strategic Initiatives
                       8.9.14. Koch Heat Transfer Company
                           8.9.14.1. Company Overview
                           8.9.14.2. Financial Performance
                           8.9.14.3. Product Benchmarking
                           8.9.14.4. Strategic Initiatives
                       8.9.15. Southern Heat Exchanger Corporation
                           8.9.15.1. Company Overview
                           8.9.15.2. Financial Performance
                           8.9.15.3. Product Benchmarking
                           8.9.15.4. Strategic Initiatives


List of Tables

Table 1 Heat exchangers market 2018 - 2030 (USD Billion)
Table 2 Global heat exchangers market estimates and forecasts, 2018 - 2030 (USD Billion)
Table 3 Global heat exchangers market estimates and forecasts, by product, 2018 - 2030 (USD Billion)
Table 4 Global plate & frame heat exchangers market estimates and forecasts, by type, 2018 - 2030 (USD Billion)
Table 5 Global shell & tube heat exchangers market estimates and forecasts, by type, 2018 - 2030 (USD Billion)
Table 6 Global heat exchangers market estimates and forecasts, by end-use, 2018 - 2030 (USD Billion)
Table 7 Global heat exchangers market estimates and forecasts, by material, 2018 - 2030 (USD Billion)
Table 8 Global heat exchangers market estimates and forecasts, by region, 2018 - 2030 (USD Billion)
Table 9 North America heat exchangers market estimates and forecasts, 2018 - 2030 (USD Billion)
Table 10 North America heat exchangers market estimates and forecasts, by product, 2018 - 2030 (USD Billion)
Table 11 North America plate & frame heat exchangers market estimates and forecasts, by type, 2018 - 2030 (USD Billion)
Table 12 North America shell & tube heat exchangers market estimates and forecasts, by type, 2018 - 2030 (USD Billion)
Table 13 North America heat exchangers market estimates and forecasts, by end-use, 2018 - 2030 (USD Billion)
Table 14 North America heat exchangers market estimates and forecasts, by material, 2018 - 2030 (USD Billion)
Table 15 U.S. heat exchangers market estimates and forecasts, 2018 - 2030 (USD Billion)
Table 16 U.S. heat exchangers market estimates and forecasts, by product, 2018 - 2030 (USD Billion)
Table 17 U.S. plate & frame heat exchangers market estimates and forecasts, by type, 2018 - 2030 (USD Billion)
Table 18 U.S. shell & tube heat exchangers market estimates and forecasts, by type, 2018 - 2030 (USD Billion)
Table 19 U.S. heat exchangers market estimates and forecasts, by end-use, 2018 - 2030 (USD Billion)
Table 20 U.S. heat exchangers market estimates and forecasts, by material, 2018 - 2030 (USD Billion)
Table 21 Canada heat exchangers market estimates and forecasts, 2018 - 2030 (USD Billion)
Table 22 Canada heat exchangers market estimates and forecasts, by product, 2018 - 2030 (USD Billion)
Table 23 Canada plate & frame heat exchangers market estimates and forecasts, by type, 2018 - 2030 (USD Billion)
Table 24 Canada shell & tube heat exchangers market estimates and forecasts, by type, 2018 - 2030 (USD Billion)
Table 25 Canada heat exchangers market estimates and forecasts, by end-use, 2018 - 2030 (USD Billion)
Table 26 Canada heat exchangers market estimates and forecasts, by material, 2018 - 2030 (USD Billion)
Table 27 Mexico heat exchangers market estimates and forecasts, 2018 - 2030 (USD Billion)
Table 28 Mexico heat exchangers market estimates and forecasts, by product, 2018 - 2030 (USD Billion)
Table 29 Mexico plate & frame heat exchangers market estimates and forecasts, by type, 2018 - 2030 (USD Billion)
Table 30 Mexico shell & tube heat exchangers market estimates and forecasts, by type, 2018 - 2030 (USD Billion)
Table 31 Mexico heat exchangers market estimates and forecasts, by end-use, 2018 - 2030 (USD Billion)
Table 32 Mexico heat exchangers market estimates and forecasts, by material, 2018 - 2030 (USD Billion)
Table 33 Europe heat exchangers market estimates and forecasts, 2018 - 2030 (USD Billion)
Table 34 Europe heat exchangers market estimates and forecasts, by product, 2018 - 2030 (USD Billion)
Table 35 Europe plate & frame heat exchangers market estimates and forecasts, by type, 2018 - 2030 (USD Billion)
Table 36 Europe shell & tube heat exchangers market estimates and forecasts, by type, 2018 - 2030 (USD Billion)
Table 37 Europe heat exchangers market estimates and forecasts, by end-use, 2018 - 2030 (USD Billion)
Table 38 Europe heat exchangers market estimates and forecasts, by material, 2018 - 2030 (USD Billion)
Table 39 Germany heat exchangers market estimates and forecasts, 2018 - 2030 (USD Billion)
Table 40 Germany heat exchangers market estimates and forecasts, by product, 2018 - 2030 (USD Billion)
Table 41 Germany plate & frame heat exchangers market estimates and forecasts, by type, 2018 - 2030 (USD Billion)
Table 42 Germany shell & tube heat exchangers market estimates and forecasts, by type, 2018 - 2030 (USD Billion)
Table 43 Germany heat exchangers market estimates and forecasts, by end-use, 2018 - 2030 (USD Billion)
Table 44 Germany heat exchangers market estimates and forecasts, by material, 2018 - 2030 (USD Billion)
Table 45 France heat exchangers market estimates and forecasts, 2018 - 2030 (USD Billion)
Table 46 France heat exchangers market estimates and forecasts, by product, 2018 - 2030 (USD Billion)
Table 47 France plate & frame heat exchangers market estimates and forecasts, by type, 2018 - 2030 (USD Billion)
Table 48 France shell & tube heat exchangers market estimates and forecasts, by type, 2018 - 2030 (USD Billion)
Table 49 France heat exchangers market estimates and forecasts, by end-use, 2018 - 2030 (USD Billion)
Table 50 France heat exchangers market estimates and forecasts, by material, 2018 - 2030 (USD Billion)
Table 51 Italy heat exchangers market estimates and forecasts, 2018 - 2030 (USD Billion)
Table 52 Italy heat exchangers market estimates and forecasts, by product, 2018 - 2030 (USD Billion)
Table 53 Italy plate & frame heat exchangers market estimates and forecasts, by type, 2018 - 2030 (USD Billion)
Table 54 Italy shell & tube heat exchangers market estimates and forecasts, by type, 2018 - 2030 (USD Billion)
Table 55 Italy heat exchangers market estimates and forecasts, by end-use, 2018 - 2030 (USD Billion)
Table 56 Italy heat exchangers market estimates and forecasts, by material, 2018 - 2030 (USD Billion)
Table 57 Spain heat exchangers market estimates and forecasts, 2018 - 2030 (USD Billion)
Table 58 Spain heat exchangers market estimates and forecasts, by product, 2018 - 2030 (USD Billion)
Table 59 Spain plate & frame heat exchangers market estimates and forecasts, by type, 2018 - 2030 (USD Billion)
Table 60 Spain shell & tube heat exchangers market estimates and forecasts, by type, 2018 - 2030 (USD Billion)
Table 61 Spain heat exchangers market estimates and forecasts, by end-use, 2018 - 2030 (USD Billion)
Table 62 Spain heat exchangers market estimates and forecasts, by material, 2018 - 2030 (USD Billion)
Table 63 UK heat exchangers market estimates and forecasts, 2018 - 2030 (USD Billion)
Table 64 UK heat exchangers market estimates and forecasts, by product, 2018 - 2030 (USD Billion)
Table 65 UK plate & frame heat exchangers market estimates and forecasts, by type, 2018 - 2030 (USD Billion)
Table 66 UK shell & tube heat exchangers market estimates and forecasts, by type, 2018 - 2030 (USD Billion)
Table 67 UK heat exchangers market estimates and forecasts, by end-use, 2018 - 2030 (USD Billion)
Table 68 UK heat exchangers market estimates and forecasts, by material, 2018 - 2030 (USD Billion)
Table 69 Asia Pacific heat exchangers market estimates and forecasts, 2018 - 2030 (USD Billion)
Table 70 Asia Pacific heat exchangers market estimates and forecasts, by product, 2018 - 2030 (USD Billion)
Table 71 Asia Pacific plate & frame heat exchangers market estimates and forecasts, by type, 2018 - 2030 (USD Billion)
Table 72 Asia Pacific shell & tube heat exchangers market estimates and forecasts, by type, 2018 - 2030 (USD Billion)
Table 73 Asia Pacific heat exchangers market estimates and forecasts, by end-use, 2018 - 2030 (USD Billion)
Table 74 Asia Pacific heat exchangers market estimates and forecasts, by material, 2018 - 2030 (USD Billion)
Table 75 China heat exchangers market estimates and forecasts, 2018 - 2030 (USD Billion)
Table 76 China heat exchangers market estimates and forecasts, by product, 2018 - 2030 (USD Billion)
Table 77 China plate & frame heat exchangers market estimates and forecasts, by type, 2018 - 2030 (USD Billion)
Table 78 China shell & tube heat exchangers market estimates and forecasts, by type, 2018 - 2030 (USD Billion)
Table 79 China heat exchangers market estimates and forecasts, by end-use, 2018 - 2030 (USD Billion)
Table 80 China heat exchangers market estimates and forecasts, by material, 2018 - 2030 (USD Billion)
Table 81 India heat exchangers market estimates and forecasts, 2018 - 2030 (USD Billion)
Table 82 India heat exchangers market estimates and forecasts, by product, 2018 - 2030 (USD Billion)
Table 83 India plate & frame heat exchangers market estimates and forecasts, by type, 2018 - 2030 (USD Billion)
Table 84 India shell & tube heat exchangers market estimates and forecasts, by type, 2018 - 2030 (USD Billion)
Table 85 India heat exchangers market estimates and forecasts, by end-use, 2018 - 2030 (USD Billion)
Table 86 India heat exchangers market estimates and forecasts, by material, 2018 - 2030 (USD Billion)
Table 87 Japan heat exchangers market estimates and forecasts, 2018 - 2030 (USD Billion)
Table 88 Japan heat exchangers market estimates and forecasts, by product, 2018 - 2030 (USD Billion)
Table 89 Japan plate & frame heat exchangers market estimates and forecasts, by type, 2018 - 2030 (USD Billion)
Table 90 Japan shell & tube heat exchangers market estimates and forecasts, by type, 2018 - 2030 (USD Billion)
Table 91 Japan heat exchangers market estimates and forecasts, by end-use, 2018 - 2030 (USD Billion)
Table 92 Japan heat exchangers market estimates and forecasts, by material, 2018 - 2030 (USD Billion)
Table 93 South Korea heat exchangers market estimates and forecasts, 2018 - 2030 (USD Billion)
Table 94 South Korea heat exchangers market estimates and forecasts, by product, 2018 - 2030 (USD Billion)
Table 95 South Korea plate & frame heat exchangers market estimates and forecasts, by type, 2018 - 2030 (USD Billion)
Table 96 South Korea shell & tube heat exchangers market estimates and forecasts, by type, 2018 - 2030 (USD Billion)
Table 97 South Korea heat exchangers market estimates and forecasts, by end-use, 2018 - 2030 (USD Billion)
Table 98 South Korea heat exchangers market estimates and forecasts, by material, 2018 - 2030 (USD Billion)
Table 99 Australia heat exchangers market estimates and forecasts, 2018 - 2030 (USD Billion)
Table 100 Australia heat exchangers market estimates and forecasts, by product, 2018 - 2030 (USD Billion)
Table 101 Australia plate & frame heat exchangers market estimates and forecasts, by type, 2018 - 2030 (USD Billion)
Table 102 Australia shell & tube heat exchangers market estimates and forecasts, by type, 2018 - 2030 (USD Billion)
Table 103 Australia heat exchangers market estimates and forecasts, by end-use, 2018 - 2030 (USD Billion)
Table 104 Australia heat exchangers market estimates and forecasts, by material, 2018 - 2030 (USD Billion)
Table 105 Central & South America heat exchangers market estimates and forecasts, 2018 - 2030 (USD Billion)
Table 106 Central & South America heat exchangers market estimates and forecasts, by product, 2018 - 2030 (USD Billion)
Table 107 Central & South America plate & frame heat exchangers market estimates and forecasts, by type, 2018 - 2030 (USD Billion)
Table 108 Central & South America shell & tube heat exchangers market estimates and forecasts, by type, 2018 - 2030 (USD Billion)
Table 109 Central & South America heat exchangers market estimates and forecasts, by end-use, 2018 - 2030 (USD Billion)
Table 110 Central & South America heat exchangers market estimates and forecasts, by material, 2018 - 2030 (USD Billion)
Table 111 Brazil heat exchangers market estimates and forecasts, 2018 - 2030 (USD Billion)
Table 112 Brazil heat exchangers market estimates and forecasts, by product, 2018 - 2030 (USD Billion)
Table 113 Brazil plate & frame heat exchangers market estimates and forecasts, by type, 2018 - 2030 (USD Billion)
Table 114 Brazil shell & tube heat exchangers market estimates and forecasts, by type, 2018 - 2030 (USD Billion)
Table 115 Brazil heat exchangers market estimates and forecasts, by end-use, 2018 - 2030 (USD Billion)
Table 116 Brazil heat exchangers market estimates and forecasts, by material, 2018 - 2030 (USD Billion)
Table 117 Argentina heat exchangers market estimates and forecasts, 2018 - 2030 (USD Billion)
Table 118 Argentina heat exchangers market estimates and forecasts, by product, 2018 - 2030 (USD Billion)
Table 119 Argentina plate & frame heat exchangers market estimates and forecasts, by type, 2018 - 2030 (USD Billion)
Table 120 Argentina shell & tube heat exchangers market estimates and forecasts, by type, 2018 - 2030 (USD Billion)
Table 121 Argentina heat exchangers market estimates and forecasts, by end-use, 2018 - 2030 (USD Billion)
Table 122 Argentina heat exchangers market estimates and forecasts, by material, 2018 - 2030 (USD Billion)
Table 123 Middle East & Africa heat exchangers market estimates and forecasts, 2018 - 2030 (USD Billion)
Table 124 Middle East & Africa heat exchangers market estimates and forecasts, by product, 2018 - 2030 (USD Billion)
Table 125 Middle East & Africa plate & frame heat exchangers market estimates and forecasts, by type, 2018 - 2030 (USD Billion)
Table 126 Middle East & Africa shell & tube heat exchangers market estimates and forecasts, by type, 2018 - 2030 (USD Billion)
Table 127 Middle East & Africa heat exchangers market estimates and forecasts, by end-use, 2018 - 2030 (USD Billion)
Table 128 Middle East & Africa heat exchangers market estimates and forecasts, by material, 2018 - 2030 (USD Billion)
Table 129 Saudi Arabia heat exchangers market estimates and forecasts, 2018 - 2030 (USD Billion)
Table 130 Saudi Arabia heat exchangers market estimates and forecasts, by product, 2018 - 2030 (USD Billion)
Table 131 Saudi Arabia plate & frame heat exchangers market estimates and forecasts, by type, 2018 - 2030 (USD Billion)
Table 132 Saudi Arabia shell & tube heat exchangers market estimates and forecasts, by type, 2018 - 2030 (USD Billion)
Table 133 Saudi Arabia heat exchangers market estimates and forecasts, by end-use, 2018 - 2030 (USD Billion)
Table 134 Saudi Arabia heat exchangers market estimates and forecasts, by material, 2018 - 2030 (USD Billion)
Table 135 South Africa heat exchangers market estimates and forecasts, 2018 - 2030 (USD Billion)
Table 136 South Africa heat exchangers market estimates and forecasts, by product, 2018 - 2030 (USD Billion)
Table 137 South Africa plate & frame heat exchangers market estimates and forecasts, by type, 2018 - 2030 (USD Billion)
Table 138 South Africa shell & tube heat exchangers market estimates and forecasts, by type, 2018 - 2030 (USD Billion)
Table 139 South Africa heat exchangers market estimates and forecasts, by end-use, 2018 - 2030 (USD Billion)
Table 140 South Africa heat exchangers market estimates and forecasts, by material, 2018 - 2030 (USD Billion)
Table 141 UAE heat exchangers market estimates and forecasts, 2018 - 2030 (USD Billion)
Table 142 UAE heat exchangers market estimates and forecasts, by product, 2018 - 2030 (USD Billion)
Table 143 UAE plate & frame heat exchangers market estimates and forecasts, by type, 2018 - 2030 (USD Billion)
Table 144 UAE shell & tube heat exchangers market estimates and forecasts, by type, 2018 - 2030 (USD Billion)
Table 145 UAE heat exchangers market estimates and forecasts, by end-use, 2018 - 2030 (USD Billion)
Table 146 UAE heat exchangers market estimates and forecasts, by material, 2018 - 2030 (USD Billion)
Table 147 Key Companies Undergoing Mergers & Acquisitions
Table 148 Key Companies Undergoing Product Launches
Table 149 Key Companies Undergoing Partnerships & Collaborations
Table 150 Key Companies Making Investments
Table 151 Key Companies Undergoing Expansions
Table 152 Key Companies Undergoing Agreements
Table 153 Key Companies Undergoing Disinvestment


List of Figures

Fig. 1 Market research process
Fig. 2 Data triangulation techniques
Fig. 3 Primary research pattern
Fig. 4 Market research approaches
Fig. 5 QFD modeling for market share assessment
Fig. 6 Information Procurement
Fig. 7 Market Formulation and Validation
Fig. 8 Data Validating & Publishing
Fig. 9 Market Segmentation & Scope
Fig. 10 Heat Exchangers Market Snapshot
Fig. 11 Product Segment Snapshot
Fig. 12 End-use Segment Snapshot
Fig. 13 Material Segment Snapshot
Fig. 14 Competitive Landscape Snapshot
Fig. 15 Heat Exchangers Market Value, 2023 (USD Billion)
Fig. 16 Heat Exchangers Market - Value Chain Analysis
Fig. 17 Heat Exchangers Market - Market Dynamics
Fig. 18 Heat Exchangers Market - PORTER’s Analysis
Fig. 19 Heat Exchangers Market - PESTEL Analysis
Fig. 20 Heat Exchangers Market Estimates & Forecasts, By Product: Key Takeaways
Fig. 21 Heat Exchangers Market Share, By Product, 2023 & 2030
Fig. 22 Plate & Frame Heat Exchangers Market Estimates & Forecasts, 2018 - 2030 (USD Billion)
Fig. 23 Plate & Frame Heat Exchangers Market Estimates & Forecasts, By Type, 2018 - 2030 (USD Billion)
Fig. 24 Brazed Plate & Frame Heat Exchanger Market Estimates & Forecasts, 2018 - 2030 (USD Billion)
Fig. 25 Gasketed Plate & Frame Heat Exchanger Market Estimates & Forecasts, 2018 - 2030 (USD Billion)
Fig. 26 Welded Plate & Frame Heat Exchanger Market Estimates & Forecasts, 2018 - 2030 (USD Billion)
Fig. 27 Other Product Type Market Estimates & Forecasts, 2018 - 2030 (USD Billion)
Fig. 28 Shell & Tube Heat Exchangers Market Estimates & Forecasts, 2018 - 2030 (USD Billion)
Fig. 29 Air Cooled Heat Exchangers Market Estimates & Forecasts, 2018 - 2030 (USD Billion)
Fig. 30 Other Product Heat Exchangers Market Estimates & Forecasts, 2018 - 2030 (USD Billion)
Fig. 31 Heat Exchangers Market Estimates & Forecasts, By End-use: Key Takeaways
Fig. 32 Heat Exchangers Market Share, By End-use, 2023 & 2030
Fig. 33 Heat Exchangers Market Estimates & Forecasts, In Chemical & Petrochemical, 2018 - 2030 (USD Billion)
Fig. 34 Heat Exchangers Market Estimates & Forecasts, In Oil & Gas, 2018 - 2030 (USD Billion)
Fig. 35 Heat Exchangers Market Estimates & Forecasts, In HVAC & Refrigeration, 2018 - 2030 (USD Billion)
Fig. 36 Heat Exchangers Market Estimates & Forecasts, In Power Generation, 2018 - 2030 (USD Billion)
Fig. 37 Heat Exchangers Market Estimates & Forecasts, In Food & Beverage, 2018 - 2030 (USD Billion)
Fig. 38 Heat Exchangers Market Estimates & Forecasts, In Pulp & Paper, 2018 - 2030 (USD Billion)
Fig. 39 Heat Exchangers Market Estimates & Forecasts, In Other End-use, 2018 - 2030 (USD Billion)
Fig. 40 Heat Exchangers Market Estimates & Forecasts, By Material: Key Takeaways
Fig. 41 Heat Exchangers Market Share, By Material, 2023 & 2030
Fig. 42 Heat Exchangers Market Estimates & Forecasts, By Metals, 2018 - 2030 (USD Billion)
Fig. 43 Heat Exchangers Market Estimates & Forecasts, By Alloys, 2018 - 2030 (USD Billion)
Fig. 44 Heat Exchangers Market Estimates & Forecasts, By Others, 2018 - 2030 (USD Billion)
Fig. 45 North America Heat Exchangers Market Estimates & Forecasts, 2018 - 2030 (USD Billion)
Fig. 46 U.S. Heat Exchangers Market Estimates & Forecasts, 2018 - 2030 (USD Billion)
Fig. 47 Canada Heat Exchangers Market Estimates & Forecasts, 2018 - 2030 (USD Billion)
Fig. 48 Mexico Heat Exchangers Market Estimates & Forecasts, 2018 - 2030 (USD Billion)
Fig. 49 Europe Heat Exchangers Market Estimates & Forecasts, 2018 - 2030 (USD Billion)
Fig. 50 Germany Heat Exchangers Market Estimates & Forecasts, 2018 - 2030 (USD Billion)
Fig. 51 France Heat Exchangers Market Estimates & Forecasts, 2018 - 2030 (USD Billion)
Fig. 52 UK Heat Exchangers Market Estimates & Forecasts, 2018 - 2030 (USD Billion)
Fig. 53 Italy Heat Exchangers Market Estimates & Forecasts, 2018 - 2030 (USD Billion)
Fig. 54 Spain Heat Exchangers Market Estimates & Forecasts, 2018 - 2030 (USD Billion)
Fig. 55 Asia Pacific Heat Exchangers Market Estimates & Forecasts, 2018 - 2030 (USD Billion)
Fig. 56 China Heat Exchangers Market Estimates & Forecasts, 2018 - 2030 (USD Billion)
Fig. 57 India Heat Exchangers Market Estimates & Forecasts, 2018 - 2030 (USD Billion)
Fig. 58 Japan Heat Exchangers Market Estimates & Forecasts, 2018 - 2030 (USD Billion)
Fig. 59 South Korea Heat Exchangers Market Estimates & Forecasts, 2018 - 2030 (USD Billion)
Fig. 60 Australia Heat Exchangers Market Estimates & Forecasts, 2018 - 2030 (USD Billion)
Fig. 61 Central & South America Heat Exchangers Market Estimates & Forecasts, 2018 - 2030 (USD Billion)
Fig. 62 Brazil Heat Exchangers Market Estimates & Forecasts, 2018 - 2030 (USD Billion)
Fig. 63 Argentina Heat Exchangers Market Estimates & Forecasts, By Product, 2018 - 2030 (USD Billion)
Fig. 64 Middle East & Africa Heat Exchangers Market Estimates & Forecasts, By Product, 2018 - 2030 (USD Billion)
Fig. 65 UAE Heat Exchangers Market Estimates & Forecasts, 2018 - 2030 (USD Billion)
Fig. 66 South Africa Heat Exchangers Market Estimates & Forecasts, 2018 - 2030 (USD Billion)
Fig. 67 Saudi Arabia Heat Exchangers Market Estimates & Forecasts, 2018 - 2030 (USD Billion)
Fig. 68 Key Company Categorization
Fig. 69 Competitive Dashboard Analysis
Fig. 70 Company Market Positioning
Fig. 71 Key Company Market Share Analysis, 2023
Fig. 72 Strategy Mapping

What questions do you have? Get quick response from our industry experts. Request a Free Consultation

Market Segmentation

  • Heat Exchanger Product Outlook (Revenue, USD Million, 2018 - 2030)
    • Plate & Frame Heat Exchanger
      • Brazed Plate & Frame Heat Exchanger
      • Gasketed Plate & Frame Heat Exchanger
      • Welded Plate & Frame Heat Exchanger
      • Others
    • Shell & Tube Heat Exchanger
    • Air-Cooled Heat Exchanger
    • Others
  • Heat Exchanger End-use Outlook (Revenue, USD Million, 2018 - 2030)
    • Chemical & Petrochemical
    • Oil & Gas
    • HVAC & Refrigeration
    • Power Generation
    • Food & Beverage
    • Pulp & Paper
    • Others
  • Heat Exchanger Material Outlook (Revenue, USD Billion, 2018 – 2030)
    • Metals
    • Alloys
    • Others
  • Heat Exchanger Regional Outlook (Revenue, USD Million, 2018 - 2030)
    • North America
      • North America Heat Exchanger Market, By Product
        • Plate & Frame Heat Exchanger
          • Brazed Plate & Frame Heat Exchanger
          • Gasketed Plate & Frame Heat Exchanger
          • Welded Plate & Frame Heat Exchanger
          • Others
        • Shell & Tube Heat Exchanger
        • Air-Cooled Heat Exchanger
        • Others
      • North America Heat Exchanger Market, By End-Use
        • Chemical & Petrochemical
        • Oil & Gas
        • HVAC & Refrigeration
        • Power Generation
        • Food & Beverage
        • Pulp & Paper
      • North America Heat Exchangers Market, By Material
        • Metals
        • AlloysOthers
        • Others
      • U.S.
        • U.S. Heat Exchanger Market, By Product
          • Plate & Frame Heat Exchanger
            • Brazed Plate & Frame Heat Exchanger
            • Gasketed Plate & Frame Heat Exchanger
            • Welded Plate & Frame Heat Exchanger
            • Others
          • Shell & Tube Heat Exchanger
          • Air-Cooled Heat Exchanger
          • Others
        • U.S. Heat Exchanger Market, By End-Use
          • Chemical & Petrochemical
          • Oil & Gas
          • HVAC & Refrigeration
          • Power Generation
          • Food & Beverage
          • Pulp & Paper
          • Others
        • U.S. Heat Exchangers Market, By Material
          • Metals
          • AlloysOthers
          • Others
      • Canada
        • Canada Heat Exchanger Market, By Product
          • Plate & Frame Heat Exchanger
            • Brazed Plate & Frame Heat Exchanger
            • Gasketed Plate & Frame Heat Exchanger
            • Welded Plate & Frame Heat Exchanger
            • Others
          • Shell & Tube Heat Exchanger
          • Air-Cooled Heat Exchanger
          • Others
        • Canada Heat Exchanger Market, By End-Use
          • Chemical & Petrochemical
          • Oil & Gas
          • HVAC & Refrigeration
          • Power Generation
          • Food & Beverage
          • Pulp & Paper
          • Others
        • Canada Heat Exchangers Market, By Material
          • Metals
          • AlloysOthers
          • Others
      • Mexico
        • Mexico Heat Exchanger Market, By Product
          • Plate & Frame Heat Exchanger
            • Brazed Plate & Frame Heat Exchanger
            • Gasketed Plate & Frame Heat Exchanger
            • Welded Plate & Frame Heat Exchanger
            • Others
          • Shell & Tube Heat Exchanger
          • Air-Cooled Heat Exchanger
          • Others
        • Mexico Heat Exchanger Market, By End-Use
          • Chemical & Petrochemical
          • Oil & Gas
          • HVAC & Refrigeration
          • Power Generation
          • Food & Beverage
          • Pulp & Paper
          • Others
        • Mexico Heat Exchangers Market, By Material
          • Metals
          • AlloysOthers
          • Others
    • Europe
      • Europe Heat Exchanger Market, By Product
        • Plate & Frame Heat Exchanger
          • Brazed Plate & Frame Heat Exchanger
          • Gasketed Plate & Frame Heat Exchanger
          • Welded Plate & Frame Heat Exchanger
          • Others
        • Shell & Tube Heat Exchanger
        • Air-Cooled Heat Exchanger
        • Others
      • Europe Heat Exchanger Market, By End-Use
        • Chemical & Petrochemical
        • Oil & Gas
        • HVAC & Refrigeration
        • Power Generation
        • Food & Beverage
        • Pulp & Paper
        • Others
      • Europe Heat Exchangers Market, By Material
        • Metals
        • AlloysOthers
        • Others
      • Germany
        • Germany Heat Exchanger Market, By Product
          • Plate & Frame Heat Exchanger
            • Brazed Plate & Frame Heat Exchanger
            • Gasketed Plate & Frame Heat Exchanger
            • Welded Plate & Frame Heat Exchanger
            • Others
          • Shell & Tube Heat Exchanger
          • Air-Cooled Heat Exchanger
          • Others
        • Germany Heat Exchanger Market, By End-Use
          • Chemical & Petrochemical
          • Oil & Gas
          • HVAC & Refrigeration
          • Power Generation
          • Food & Beverage
          • Pulp & Paper
          • Others
        • Germany Heat Exchangers Market, By Material
          • Metals
          • AlloysOthers
          • Others
      • France
        • France Heat Exchanger Market, By Product
          • Plate & Frame Heat Exchanger
            • Brazed Plate & Frame Heat Exchanger
            • Gasketed Plate & Frame Heat Exchanger
            • Welded Plate & Frame Heat Exchanger
            • Others
          • Shell & Tube Heat Exchanger
          • Air-Cooled Heat Exchanger
          • Others
        • France Heat Exchanger Market, By End-Use
          • Chemical & Petrochemical
          • Oil & Gas
          • HVAC & Refrigeration
          • Power Generation
          • Food & Beverage
          • Pulp & Paper
          • Others
        • France Heat Exchangers Market, By Material
          • Metals
          • AlloysOthers
          • Others
      • Italy
        • Italy Heat Exchanger Market, By Product
          • Plate & Frame Heat Exchanger
            • Brazed Plate & Frame Heat Exchanger
            • Gasketed Plate & Frame Heat Exchanger
            • Welded Plate & Frame Heat Exchanger
            • Others
          • Shell & Tube Heat Exchanger
          • Air-Cooled Heat Exchanger
          • Others
        • Italy Heat Exchanger Market, By End-Use
          • Chemical & Petrochemical
          • Oil & Gas
          • HVAC & Refrigeration
          • Power Generation
          • Food & Beverage
          • Pulp & Paper
          • Others
        • Italy Heat Exchangers Market, By Material
          • Metals
          • AlloysOthers
          • Others
    • Asia Pacific
      • Asia Pacific Heat Exchanger Market, By Product
        • Plate & Frame Heat Exchanger
          • Brazed Plate & Frame Heat Exchanger
          • Gasketed Plate & Frame Heat Exchanger
          • Welded Plate & Frame Heat Exchanger
          • Others
        • Shell & Tube Heat Exchanger
        • Air-Cooled Heat Exchanger
        • Others
      • Asia Pacific Heat Exchanger Market, By End-Use
        • Chemical & Petrochemical
        • Oil & Gas
        • HVAC & Refrigeration
        • Power Generation
        • Food & Beverage
        • Pulp & Paper
        • Others
      • Asia Pacific  Heat Exchangers Market, By Material
        • Metals
        • AlloysOthers
        • Others
      • China
        • China Heat Exchanger Market, By Product
          • Plate & Frame Heat Exchanger
            • Brazed Plate & Frame Heat Exchanger
            • Gasketed Plate & Frame Heat Exchanger
            • Welded Plate & Frame Heat Exchanger
            • Others
          • Shell & Tube Heat Exchanger
          • Air-Cooled Heat Exchanger
          • Others
        • China Heat Exchanger Market, By End-Use
          • Chemical & Petrochemical
          • Oil & Gas
          • HVAC & Refrigeration
          • Power Generation
          • Food & Beverage
          • Pulp & Paper
          • Others
        • China Heat Exchangers Market, By Material
          • Metals
          • AlloysOthers
          • Others
      • Japan
        • Japan Heat Exchanger Market, By Product
          • Plate & Frame Heat Exchanger
            • Brazed Plate & Frame Heat Exchanger
            • Gasketed Plate & Frame Heat Exchanger
            • Welded Plate & Frame Heat Exchanger
            • Others
          • Shell & Tube Heat Exchanger
          • Air-Cooled Heat Exchanger
          • Others
        • Japan Heat Exchanger Market, By End-Use
          • Chemical & Petrochemical
          • Oil & Gas
          • HVAC & Refrigeration
          • Power Generation
          • Food & Beverage
          • Pulp & Paper
          • Others
        • Japan Heat Exchangers Market, By Material
          • Metals
          • AlloysOthers
          • Others
      • India
        • India Heat Exchanger Market, By Product
          • Plate & Frame Heat Exchanger
            • Brazed Plate & Frame Heat Exchanger
            • Gasketed Plate & Frame Heat Exchanger
            • Welded Plate & Frame Heat Exchanger
            • Others
          • Shell & Tube Heat Exchanger
          • Air-Cooled Heat Exchanger
          • Others
        • India Heat Exchanger Market, By End-Use
          • Chemical & Petrochemical
          • Oil & Gas
          • HVAC & Refrigeration
          • Power Generation
          • Food & Beverage
          • Pulp & Paper
          • Others
        • India Heat Exchangers Market, By Material
          • Metals
          • AlloysOthers
          • Others
    • Central & South America
      • Central & South America Heat Exchanger Market, By Product
        • Plate & Frame Heat Exchanger
          • Brazed Plate & Frame Heat Exchanger
          • Gasketed Plate & Frame Heat Exchanger
          • Welded Plate & Frame Heat Exchanger
          • Others
        • Shell & Tube Heat Exchanger
        • Air-Cooled Heat Exchanger
        • Others
      • Central & South America Heat Exchanger Market, By End-Use
        • Chemical & Petrochemical
        • Oil & Gas
        • HVAC & Refrigeration
        • Power Generation
        • Food & Beverage
        • Pulp & Paper
        • Others
      • Central & South America Heat Exchangers Market, By Material
        • Metals
        • AlloysOthers
        • Others
      • Brazil
        • Brazil Heat Exchanger Market, By Product
          • Plate & Frame Heat Exchanger
            • Brazed Plate & Frame Heat Exchanger
            • Gasketed Plate & Frame Heat Exchanger
            • Welded Plate & Frame Heat Exchanger
            • Others
          • Shell & Tube Heat Exchanger
          • Air-Cooled Heat Exchanger
          • Others
        • Brazil Heat Exchanger Market, By End-Use
          • Chemical & Petrochemical
          • Oil & Gas
          • HVAC & Refrigeration
          • Power Generation
          • Food & Beverage
          • Pulp & Paper
          • Others
        • Brazil Heat Exchangers Market, By Material
          • Metals
          • AlloysOthers
          • Others
    • Middle East & Africa
      • Middle East & Africa Heat Exchanger Market, By Product
        • Plate & Frame Heat Exchanger
          • Brazed Plate & Frame Heat Exchanger
          • Gasketed Plate & Frame Heat Exchanger
          • Welded Plate & Frame Heat Exchanger
          • Others
        • Shell & Tube Heat Exchanger
        • Air-Cooled Heat Exchanger
        • Others
      • Middle East & Africa Heat Exchanger Market, By End-Use
        • Chemical & Petrochemical
        • Oil & Gas
        • HVAC & Refrigeration
        • Power Generation
        • Food & Beverage
        • Pulp & Paper
        • Others
      • Middle East & Africa Heat Exchangers Market, By Material
        • Metals
        • AlloysOthers
        • Others
      • Saudi Arabia
        • Saudi Arabia Heat Exchanger Market, By Product
          • Plate & Frame Heat Exchanger
            • Brazed Plate & Frame Heat Exchanger
            • Gasketed Plate & Frame Heat Exchanger
            • Welded Plate & Frame Heat Exchanger
            • Others
          • Shell & Tube Heat Exchanger
          • Air-Cooled Heat Exchanger
          • Others
        • Saudi Arabia Heat Exchanger Market, By End-Use
          • Chemical & Petrochemical
          • Oil & Gas
          • HVAC & Refrigeration
          • Power Generation
          • Food & Beverage
          • Pulp & Paper
          • Others
        • Saudi Arabia Heat Exchangers Market, By Material
          • Metals
          • AlloysOthers
          • Others
      • UAE
        • UAE Heat Exchanger Market, By Product
          • Plate & Frame Heat Exchanger
            • Brazed Plate & Frame Heat Exchanger
            • Gasketed Plate & Frame Heat Exchanger
            • Welded Plate & Frame Heat Exchanger
            • Others
          • Shell & Tube Heat Exchanger
          • Air-Cooled Heat Exchanger
          • Others
        • UAE Heat Exchanger Market, By End-Use
          • Chemical & Petrochemical
          • Oil & Gas
          • HVAC & Refrigeration
          • Power Generation
          • Food & Beverage
          • Pulp & Paper
          • Others
        • UAE Heat Exchangers Market, By Material
          • Metals
          • AlloysOthers
          • Others

Heat Exchangers Market Dynamics

Drivers: Growth Of Chemical And Petrochemical Industries

According to the American Chemical Society, chemical industry in the U.S. witnessed a growth of 2.5% in 2019 and 3% in 2020. In light of the COVID-19 pandemic, chemical production in the country is expected to decline by 9.3% in 2020 but is projected to grow by around 12.3% by 2021. Major factors augmenting the growth of chemical industry in the U.S. include the expanding domestic end-use industries. The increased chemical demand from various end-use applications further encourages new capital investment in the chemice industry. This process requires heat exchangers for cooling, heating, and mixing substances. A significant factor driving the heat exchangers market is the rapid expansion of the chemical industry.

In China, chemicals are one of the largest and fastest-growing industries, with a growth rate expected to surpass other chemical-producing countries in the coming years. According to Deutsche Bank, China is expected to account for 45% of the revenue share in the global market by 2020. The rapid expansion of chemical industry in Asia, especially in China, is expected to act as a significant driving force for the heat exchangers market on account of vast product penetration in various applications including solvent condensation, multiple material mixtures, benzene heat recovery, cooling of water circuits, cooling of hydrocarbons, heating & cooling of intermediate products, heating & cooling of reactors, and production processes. Thus, chemical industry necessitates heat exchangers that prevent cross-contamination and offer corrosion resistance.

The Dow Chemical Company invested USD 3 million in China in 2018. The company planned to establish a joint venture with Sinopec to produce an annual 900,000 tons of ethane, which is expected to make China the leading ethane supplier. This, in turn, is expected to drive the heat exchangers market in China.

Growth Of Power Generation Industry

Significant power markets such as China, the U.S., India, Russia, and Japan are restructuring the operating models to adapt the structure of renewable energy and efficient utilization of energy by installing heat exchangers and, thus, are shifting from the traditional use of energy. This is expected to drive the demand for heat exchangers over the forecast period.

Heat exchanger is an essential part of the power generating units and plants, as it is required for evaporation of working fluids, condensation of working fluids, extraction of heat, re-cooling of cooling circuits, cooling of lube-oil, and cooling of motor cooling water. Heat exchanger is a low-cost, effective, and efficient means of heat transfer. According to the 5th Strategic Energy Plan approved by the government of Japan in 2018, the number of renewable energy and nuclear power plants has witnessed significant growth to ensure the country's self-sufficiency for energy requirements. The increasing demand for power plants is anticipated to augment the heat exchangers market growth in the country. Developing countries such as India, China, and Brazil are expected to witness an increase in power demand owing to the high level of development and economic growth along with the improvement in the quality of life. Several governments have established incentives to promote innovations and installations to guarantee increased power supply and reduce the emission of polluting gases. The improvement of renewable energy technologies coupled with the close monitoring of energy consumption has enabled rapid expansion in the number of power plants. The European Union is installing new power generation plants to ensure efficient energy consumption, which is in line with the norms set by the European Parliament in 2009. The new and efficient heat exchangers installed in the power generating plants are expected to reduce the overall energy consumption. Such government initiatives are expected to drive the heat exchangers market over the forecast period.

Restraints: Regulations On Curbing The Use Of Fluorinated Greenhouse Gas In Heat Exchangers

Fluorinated gases (F-gases) are a family of man-made gases which are more harmful than carbon dioxide. These gases include sulfur hexafluoride (SF6), perfluorocarbons (PFCs), and hydrofluorocarbons (HFCs). F-gases are used as substitutes for ozone-depleting substances as they do not damage the ozone layer. However, F-gases have around 23,000 higher global warming effects compared to CO2.

According to the European Environmental Agency (EEA), the F-gas emissions doubled from 1990 to 2014, whereas the emission of other greenhouse gases declined. In response to the rising discharge of F-gas, the European Union has adopted the MAC Directive and F-gas regulation to limit fluorinated gas emissions.

The European Union is taking strong actions to curb F-gas emissions by implementing heat exchangers as a part of its policy to combat climate change. The first regulation was adopted in 2006 and successfully stabilized the levels of F-gas by 2010. The next set of regulations followed in January 2015, introducing and strengthening the policies and regulations.

Hydrofluorocarbon (HFC), a type of F-gas, is emitted by heat exchangers (when in use) in various applications such as blowing agents for foam, refrigerants in HVAC refrigeration, fire-extinguishers, air-conditioner, and heat pump equipment. Rising F-gas emissions, along with regulatory standards and strict regulations regarding the emission of man-made gas, are expected to limit the growth of the heat exchangers market over the forecast period.

What Does This Report Include?

This section will provide insights into the contents included in this heat exchangers market report and help gain clarity on the structure of the report to assist readers in navigating smoothly.

Heat exchangers market qualitative analysis

  • Industry overview

  • Industry trends

  • Market drivers and restraints

  • Market size

  • Growth prospects

  • Porter’s analysis

  • PESTEL analysis

  • Key market opportunities prioritized

  • Competitive landscape

    • Company overview

    • Financial performance

    • Product benchmarking

    • Latest strategic developments

Heat exchangers market quantitative analysis

  • Market size, estimates, and forecast from 2018 to 2030

  • Market estimates and forecast for product segments up to 2030

  • Regional market size and forecast for product segments up to 2030

  • Market estimates and forecast for application segments up to 2030

  • Regional market size and forecast for application segments up to 2030

  • Company financial performance

What questions do you have? Get quick response from our industry experts. Request a Free Consultation

Research Methodology

A three-pronged approach was followed for deducing the heat exchangers market estimates and forecasts. The process has three steps: information procurement, analysis, and validation. The whole process is cyclical, and steps repeat until the estimates are validated. The three steps are explained in detail below:

Information procurement: Information procurement is one of the most extensive and important stages in our research process, and quality data is critical for accurate analysis. We followed a multi-channel data collection process for heat exchangers market to gather the most reliable and current information possible.

  • We buy access to paid databases such as Hoover’s and Factiva for company financials, industry information, white papers, industry journals, SME journals, and more.
  • We tap into Grand View’s proprietary database of data points and insights from active and archived monitoring and reporting.
  • We conduct primary research with industry experts through questionnaires and one-on-one phone interviews.
  • We pull from reliable secondary sources such as white papers and government statistics, published by organizations like WHO, NGOs, World Bank, etc., Key Opinion Leaders (KoL) publications, company filings, investor documents, and more.
  • We purchase and review investor analyst reports, broker reports, academic commentary, government quotes, and wealth management publications for insightful third-party perspectives.

Analysis: We mine the data collected to establish baselines for forecasting, identify trends and opportunities, gain insight into consumer demographics and drivers, and so much more. We utilized different methods of heat exchangers market data depending on the type of information we’re trying to uncover in our research.

  • Market Research Efforts: Bottom-up Approach for estimating and forecasting demand size and opportunity, top-down Approach for new product forecasting and penetration, and combined approach of both Bottom-up and Top-down for full coverage analysis.

  • Value-Chain-Based Sizing & Forecasting: Supply-side estimates for understanding potential revenue through competitive benchmarking, forecasting, and penetration modeling.

  • Demand-side estimates for identifying parent and ancillary markets, segment modeling, and heuristic forecasting.

  • Qualitative Functional Deployment (QFD) Modelling for market share assessment.

Market formulation and validation: We mine the data collected to establish baselines for forecasting, identify trends and opportunities, gain insight into consumer demographics and drivers, and so much more. We utilize different methods of data analysis depending on the type of information we’re trying to uncover in our research.

  • Market Formulation: This step involves the finalization of market numbers. This step on an internal level is designed to manage outputs from the Data Analysis step.

  • Data Normalization: The final market estimates and forecasts are then aligned and sent to industry experts, in-panel quality control managers for validation.

  • This step also entails the finalization of the report scope and data representation pattern.

  • Validation: The process entails multiple levels of validation. All these steps run in parallel, and the study is forwarded for publishing only if all three levels render validated results.

Heat Exchangers Market Categorization:

The heat exchangers market was categorized into four segments, namely product (Plate & Frame Heat Exchanger, Shell & Tube Heat Exchanger, Air-Cooled Heat Exchanger), end-use (Chemical & Petrochemical, Oil & Gas, HVAC & Refrigeration, Power Generation Food & Beverage, Pulp & Paper), material (Metals, Alloys), and region (North America, Europe, Asia Pacific, Central & South America, and Middle East & Africa)

Segment Market Methodology:

The heat exchangers market was segmented into product, end-use, material, and regions. The demand at a segment level was deduced using a funnel method. Concepts like the TAM, SAM, SOM, etc., were put into practice to understand the demand. We at GVR deploy three methods to deduce market estimates and determine forecasts. These methods are explained below:

Market research approaches: Bottom-up

  • Demand estimation of each product across countries/regions summed up to from the total market.

  • Variable analysis for demand forecast.

  • Demand estimation via analyzing paid database, and company financials either via annual reports or paid database.

  • Primary interviews for data revalidation and insight collection.

Market research approaches: Top-down

  • Used extensively for new product forecasting or analyzing penetration levels.

  • Tool used invoice product flow and penetration models Use of regression multi-variant analysis for forecasting Involves extensive use of paid and public databases.

  • Primary interviews and vendor-based primary research for variable impact analysis.

Market research approaches: Combined

  • This is the most common method. We apply concepts from both the top-down and bottom-up approaches to arrive at a viable conclusion.

Regional Market Methodology:

The heat exchangers market was analyzed at a regional level. The globe was divided into North America, Europe, Asia Pacific, Central & South America, and Middle East & Africa, keeping in focus variables like consumption patterns, export-import regulations, consumer expectations, etc. These regions were further divided into eighteen countries, namely, the U.S.; Canada; Mexico; Germany; France; Italy; Spain, the UK, China; Japan; India; South Korea, Australia, Brazil; Argentina, Saudi Arabia; UAE, South Africa.

All three above-mentioned market research methodologies were applied to arrive at regional-level conclusions. The regions were then summed up to form the global market.

Heat exchangers market companies & financials:

The heat exchangers market was analyzed via companies operating in the sector. Analyzing these companies and cross-referencing them to the demand equation helped us validate our assumptions and conclusions. Key market players analyzed include:

  • Alfa Laval - Alfa Laval was incorporated in 1883 and is headquartered in Lund, Sweden. The company's business line is segmented based on three major technologies, namely heat transfer, separation, and fluid handling. Products offered under heat transfer technology segment include numerous heat exchangers designed for different temperatures and pressure levels. The segment accounted for around 44% of the total group sales in 2018. Separation technology segment offers separators, decanter centrifuges, strainers, filters, and membranes. The fluid handling technology segment provides various products, including valves, pumps, tank cleaning equipment, and installation material. Alfa Laval has also established three sales divisions, namely Food & Water, Energy, and Marine. The Operations division supports these divisions. Food & water division focuses on customers from various industries, including food, breweries, pharmaceuticals, vegetable oils, and personal care products, whereas energy division targets customers from oil & gas, petrochemicals, and power generation industries among others. The marine division focuses on customers, including ship owners, manufacturers of gas and diesel engines, and companies that focus on offshore oil and gas extraction. The operations division focuses on procurement, manufacturing, distribution, and logistics related to production.

  • Danfoss - Danfoss was incorporated in 1933 as “Dansk Køleautomatik og Apparatfabrik” and is headquartered in Nordborg, Denmark. The company provides a wide range of products and solutions for air conditioning, refrigeration, heating, motor control and off-highway machinery. The company operates through four segments: Danfoss Power Solutions, Danfoss Heating, Danfoss Cooling, and Danfoss Drives. Danfoss Power Solutions segment offers products including hydrostatic pumps and motors, orbital motors, electric motors, converters, and storage, steering solutions, and electronic components and software among others. Danfoss's heating segment provides heating and cooling systems, thermostats, radiator valves, floor heating and heat pumps, and heat exchangers, among others. Danfoss's cooling segment offers numerous products, including heat exchangers, condensing units, compressors, electronic controllers, valves, sensors, and high-pressure pumps. Danfoss drives provides low and medium-voltage AC drives, stacks, and modules used in fans, pumps, chillers, conveyors, and electric vehicles.

  • Kelvion Holding GmbH - Kelvion Holding GmbH was established in 1920 as Gesellschaft für Entstaubungs-Anlagen (GEA). GEA Heat Exchangers was acquired by the Triton Fund in 2014 and renamed Kelvion post-acquisition in November 2015. Kelvion Holding GmBH had around 5,000 employees as of December 2020, and the company operates as a standalone company and is managed under Galapagos Holding S.A. The company's business line is focused on manufacturing and supplying heat exchangers to HVAC, chemical, oil and gas, power generation, and food and beverage industries. Heat exchangers offered by the company are broadly categorized as compact fin heat exchangers, shell & tube heat exchangers, plate heat exchangers, and single tube heat exchangers. Other products in the company's portfolio include transformer cooling systems and towers. Kelvion offers services related to heat exchangers such as commissioning, inspection, repair, monitoring & testing, consulting & training, and upgrade & replacement. It marks its global presence through 67 locations and partners in North America, Europe, Asia Pacific, the Middle East & Africa, and Central & South America.

  • Güntner Group GmbH - Güntner Group GmbH, a cross brand-handling company for brands - thermowave, JAEGGI Hybridtechnologie, and Guntner, was established in 1931 in Munich, Germany. Its manufacturing plants are located in Asia, Europe, and the Americas. As of December 31st, 2019, the company had over 80 employees working in 4 R&D centers in Germany, Mexico, Indonesia, and Hungary, which took care of product design, thermodynamic calculation, testing, and product data and software development. The company is one of the world's largest manufacturers of refrigeration systems. It provides its products to a wide range of industries, including pharmaceutical, automotive, computer, manufacturing, and food industries, along with numerous public sector institutions. It offers products through four business segments, namely industrial, HVAC, energy & process, and commercial. Through its widespread distribution network, the company offers a wide range of condensers, air coolers, dry coolers, controls, adiabatic, and plate heat exchangers.

  • Xylem Inc. - Xylem Inc. was incorporated in 2011 and is headquartered in New York, U.S. The company is engaged in providing smart technology and innovative solutions for meeting global wastewater, water, and energy requirements. It operates through three business segments: Applied Water, Water Infrastructure, and Measurement & Control Solutions. Applied Water segment provides water pressure boosting systems for air conditioning & ventilation, heating, and fire protection systems to commercial and residential buildings. Major brands operating under this segment include A-C Fire Pump, Bell & Gossett, Flojet, Goulds Water Technology, Jabsco, Lowara, and Standard Xchange. Furthermore, it offers heat exchangers, dispensing equipment, valves, controls, and pumps to aid in cooling of manufacturing facilities and power plants, boosting systems for agricultural irrigation, and circulation for food & beverage processing. Water infrastructure segment provides pump systems for transporting water from seas, rivers, lakes, and aquifers, along with other related services such as filtration and treatment. Similarly, solutions provided under Measurement & Control Solutions segment include critical infrastructure technologies, measurement & control technologies, and smart metering. These services aid in the effective management of distribution networks for control, monitoring, and delivery. As of December 2019, it had around 16,300 employees working across 150 countries globally.

  • API Heat Transfer - API Heat Transfer was incorporated in 1947 and is headquartered in Buffalo, New York, U.S. The company's business line is focused on manufacturing and supplying heat transfer equipment. It markets its products under five brands: AirTech, Basco, Covrad, Schmidt, and TTP. Furthermore, the company operates through four heat transfer groups, namely Air Cooled, Shell & Tube, Plate & Thermal Systems, and Fluid Power & Distributed Products, which provide optimal heat transfer solutions for required applications. Major products offered by the company include gasketed plate, brazed plate, welded plate, plate & shell, shell & tube heat exchangers, air coolers, radiators, evaporation systems, dealcoholization systems, and pasteurization systems. The company markets its products to various end-use industries, including oil and gas, food and beverage, power generation, automotive, and HVAC. It has manufacturing facilities in the U.S., China, the UK, and Germany and markets its products to end-use industries in Europe, Asia, the Middle East, and the Americas. As of 2018, the company had over 1,800 employees.

  • Mersen - Mersen was established as Carbone Lorraine by merging Le Carbone and Compagnie Lorraine de Charbons pour l'Électricité in 1937, which was renamed Mersen in 2010. The company's headquarters are located in Paris, France. It is engaged in providing solutions to advanced materials and electric power industries. The company offers products and services to various applications including solar & wind power, fiber optics & electronics, rail, aeronautics transportation & aerospace, and corrosive chemicals. It offers products through segments such as graphite specialties, anti-corrosion equipment, power transfer technologies, electrical protection & control, and solutions for power management. Graphite specialties segment provides silicon carbide (SiC), flexible graphite, carbon insulation, carbon & carbon composites, and graphite solutions to electronics, solar PV, aerospace, and process industries. The company offers technical solutions for generators and motor applications including brushes & brush-holders, brush rockers, and slip ring assemblies through its power transfer technologies segment. Solutions offered by the company under anti-corrosion equipment segment include engineering services; heat exchangers; columns, reactors, and pressure vessels; piping, bellows, and accessories; and bursting disks. This segment designs, manufactures, and supplies process equipment manufactured from fluoropolymers, nickel alloys, noble metals (zirconium, tantalum, and titanium), silicon carbide, and graphite for resisting corrosion in chemical industries.

  • Hisaka Works, Ltd. - Hisaka Works, Ltd. was founded in 1942 and is headquartered in Osaka, Japan. The company's business line focuses on manufacturing and supplying industrial machinery. The company's business portfolio is broadly categorized as heat exchanger, vital industry, valve, and solar photovoltaics. Major products offered by the company include plate heat exchangers, evaporation, distillation and condensation systems, dyeing and finishing machines, dewatering equipment, and food machinery. Heat exchangers offered by the company include plate type, multi gap plate, welded type, plate condenser, brazed type, and cushion gasket type. The company markets its products to various end-use industries, including steelmaking, power generation, pharmaceutical, HVAC, pulp & paper, marine, and chemical. The company markets its products to these industries in Malaysia, China, South Korea, Vietnam, Philippines, Indonesia, Singapore, and Saudi Arabia. The company had around 906 employees working across the globe as of March 2020.

  • Chart Industries, Inc - Chart Industries, Inc. is a leading global manufacturer of highly engineered equipment servicing various industrial gas and energy applications. The company was established in 1992 in Georgia, U.S. and its operations are spread across Australia, Asia, Europe, and the Americas. The company's manufacturing plants are located in China, India, the Czech Republic, France, Germany, Italy, and the U.S. The company acquired Thermax, Inc., a leading manufacturer of heat exchangers, thermal systems, and vaporizers, in 2014 followed by the acquisition of Hetsco (a brazed aluminum heat exchanger service and repair company), and Hudson Products (an air-cooled heat exchanger manufacturer) in 2017. The company provides its services via four business segments, including Distribution & Storage Western Hemisphere (“D&S West”), Distribution & Storage Eastern Hemisphere (“D&S East”), E&C FinFans, and Energy & Chemicals Cryogenics (“E&C Cryogenics”). The principal products of the E&C FinFans segment include HVAC, air cooled heat exchangers, and axial cooling fans for power and other end-user applications. E&C Cryogenics segment provides shell and tube heat exchangers, brazed aluminum heat exchangers, Core-in-Kettle heat exchangers, and high-pressure vessels and reactors.

  • Johnson Controls International - Johnson Controls International, a global diversified technology and multi-industrial company, was established in 1885 in Cork, Ireland. The company designs, manufactures, and installs building products and systems, including fire suppression solutions, fire detection systems, security systems, energy management systems, and HVAC equipment and controls, across the globe. As of December 2019, it had a staff of 105,000 working in over 2000 locations worldwide. Products under the building technologies and solutions segment are sold through the company's extensive distribution network in 70 countries. The segment encompasses brands such as York, Hitachi Air Conditioning, Ansul, Titus, Metasys, Frick, Ruskin, Sabroe, PENN, Grinnell, and Simplex. In 2018, the building technologies and solutions segment made up 75% of the company's total net sales. The company is a key player in the North American residential air conditioning and heating systems market and serves customers by providing technical services, data-driven solutions, and energy-management consulting. Sustainability is an integral part of the company's strategic plan 2025. The company is a part of the Three Percent Club, which is a new coalition of businesses, including companies, countries, and international organizations, planning to drive a 3% rise in energy efficiency every year. In addition, it was the first U.S.-based company to commit to the EP100 initiative. Furthermore, the company also endorses a global alliance for energy productivity goals and adheres to setting best practice steps to support environmental issues more effectively.

Value chain-based sizing & forecasting

Supply Side Estimates

  • Company revenue estimation via referring to annual reports, investor presentations, and Hoover’s.

  • Segment revenue determination via variable analysis and penetration modeling.

  • Competitive benchmarking to identify market leaders and their collective revenue shares.

  • Forecasting via analyzing commercialization rates, pipelines, market initiatives, distribution networks, etc.

Demand side estimates

  • Identifying parent markets and ancillary markets

  • Segment penetration analysis to obtain pertinent

  • revenue/volume

  • Heuristic forecasting with the help of subject matter experts

  • Forecasting via variable analysis

Heat Exchangers Market Report Objectives:

  • Understanding market dynamics (in terms of drivers, restraints, & opportunities) in the countries.

  • Understanding trends & variables in the individual countries & their impact on growth and using analytical tools to provide high-level insights into the market dynamics and the associated growth pattern.

  • Understanding market estimates and forecasts (with the base year as 2023, historic information from 2018 to 2022, and forecast from 2024 to 2030). Regional estimates & forecasts for each category are available and are summed up to form the global market estimates.

Heat Exchangers Market Report Assumptions:

  • The report provides market value for the base year 2023 and a yearly forecast till 2030 in terms of revenue/volume or both. The market for each of the segment outlooks has been provided on region & country basis for the above-mentioned forecast period.

  • The key industry dynamics, major technological trends, and application markets are evaluated to understand their impact on the demand for the forecast period. The growth rates were estimated using correlation, regression, and time-series analysis.

  • We have used the bottom-up approach for market sizing, analyzing key regional markets, dynamics, & trends for various products and end-users. The total market has been estimated by integrating the country markets.

  • All market estimates and forecasts have been validated through primary interviews with the key industry participants.

  • Inflation has not been accounted for to estimate and forecast the market.

  • Numbers may not add up due to rounding off.

  • Europe consists of EU-8, Central & Eastern Europe, along with the Commonwealth of Independent States (CIS).

  • Asia Pacific includes South Asia, East Asia, Southeast Asia, and Oceania (Australia & New Zealand).

  • Latin America includes Central American countries and the South American continent

  • Middle East includes Western Asia (as assigned by the UN Statistics Division) and the African continent.

Primary Research

GVR strives to procure the latest and unique information for reports directly from industry experts, which gives it a competitive edge. Quality is of utmost importance to us, therefore every year we focus on increasing our experts’ panel. Primary interviews are one of the critical steps in identifying recent market trends and scenarios. This process enables us to justify and validate our market estimates and forecasts to our clients. With more than 8,000 reports in our database, we have connected with some key opinion leaders across various domains, including healthcare, technology, consumer goods, and the chemical sector. Our process starts with identifying the right platform for a particular type of report, i.e., emails, LinkedIn, seminars, or telephonic conversation, as every report is unique and requires a differentiated approach.

We send out questionnaires to different experts from various regions/ countries, which is dependent on the following factors:

  • Report/Market scope: If the market study is global, we send questionnaires to industry experts across various regions, including North America, Europe, Asia Pacific, Latin America, and MEA.

  • Market Penetration: If the market is driven by technological advancements, population density, disease prevalence, or other factors, we identify experts and send out questionnaires based on region or country dominance.

The time to start receiving responses from industry experts varies based on how niche or well-penetrated the market is. Our reports include a detailed chapter on the KoL opinion section, which helps our clients understand the perspective of experts already in the market space.

What questions do you have? Get quick response from our industry experts. Request a Free Consultation
pdf icn

GET A FREE SAMPLE

arrow icn

This FREE sample includes data points, ranging from trend analyses to estimates and forecasts. See for yourself.

gvr icn

NEED A CUSTOM REPORT?

We can customize every report - free of charge - including purchasing stand-alone sections or country-level reports, as well as offer affordable discounts for start-ups & universities. Contact us now

Certified Icon

We are GDPR and CCPA compliant! Your transaction & personal information is safe and secure. For more details, please read our privacy policy.