GVR Report cover Waterproofing Membranes Market Size, Share & Trends Report

Waterproofing Membranes Market Size, Share & Trends Analysis Report By Product ((Liquid Applied), Sheet (PVC, EPDM)), By Application (Roofing, Building), By Raw Material, By Construction, And Segment Forecasts, 2024 - 2030

  • Report ID: 978-1-68038-470-3
  • Number of Report Pages: 100
  • Format: PDF, Horizon Databook
  • Historical Range: 2018 - 2023
  • Forecast Period: 2023 - 2030 
  • Industry: Advanced Materials

Waterproofing Membranes Market Trends

The global waterproofing membranes market size was estimated at USD 24.54 billion in 2023 and is expected to grow at a compound annual growth rate (CAGR) of 8.5% from 2024 to 2030. Growing demand from the waste and water management sector coupled with the increasing development in water conservation infrastructure is anticipated to positively impact the growth. Additionally, uneven distribution of water precipitation both geographically and seasonally increases the need for water conservation, transportation, and treatment.
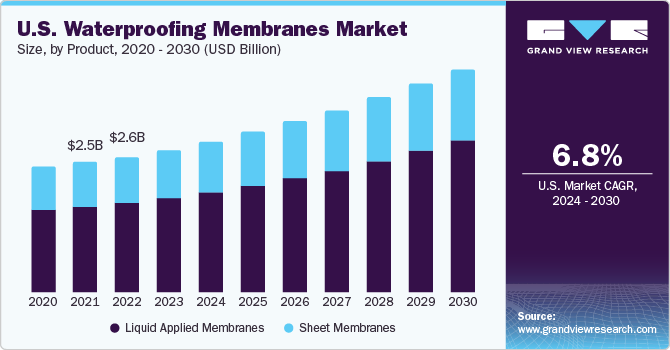
U.S. Waterproofing Membrane market size and growth rate, 2024 - 2030

Waterproofing membranes find a wide array of uses including wet rooms, roofs, water & sewage treatment plants, retaining walls, building foundations, and tunnels. Rising consumer consciousness regarding the product advantages along with the adoption of new materials such as geo membranes is expected to further propel the product demand over the projected time.

The U.S. is expected to be the largest market for waterproofing membranes in North America. Rapid industrialization on account of increasing construction projects and housing developments is expected to fuel the demand for sheet membranes in the region. Furthermore, growing consumer preference towards increasing the shelf life of paint jobs on buildings is expected to drive the sheet membrane market in the region.

Factors including low manufacturing costs coupled with rising mining activities in various regions are likely to increase the utilization of the product in the forthcoming years. In addition, the increasing trend of the wastewater management market is likely to augment the product demand over the forecast period.

Several regulations have been enforced for the production and use of waterproofing membranes. For instance, use for various applications, including designing and installing membranes, and flashings located in kitchens, bathrooms, and laundries located in residential buildings should be made and tested as per AS/NZS 4858:2004, wet area membranes.

However, the market is subjected to the lack of experts regarding the use of the right type of membrane for durable structures such as basements, decks, watercraft, and others. This is expected to act as a restraint for the market during the forecast period. In addition, fluctuating raw materials prices of polypropylene and bitumen obtained from crude oil further affecting the waterproofing membrane price, thereby, restrict the market growth.

Market Concentration & Characteristics

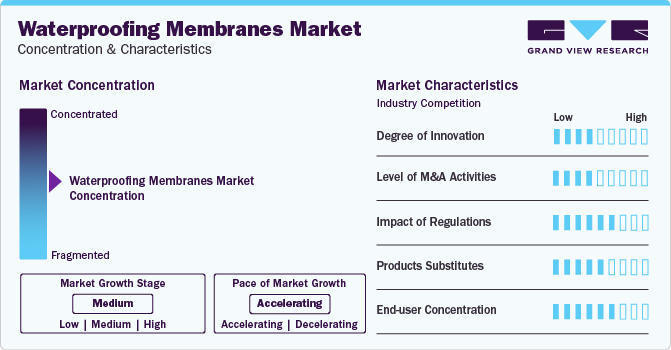
Market growth stage is medium, and pace of market growth is accelerating. Waterproofing membrane market is consolidated by a few numbers of companies that hold a majority of share. This concentration is influenced by variety of factors such as technological advancements, brand recognition, and global reach. Market players participate in moderate level of merger & acquisition, and expansion activities to gain technological advancements, global reach, and expand portfolio. Large market players absorb the small players with an aim to gain market share and intensify competition in industry.

Waterproofing membrane industry is evolving owing to moderate level of innovations that primarily involve advanced installation methods, eco-friendly solutions, new materials including self-healing membranes. Companies invest in R&D with focus on such innovations to enhance product durability, sustainability, and gain competitive edge over competitors.
Waterproofing Membrane Market Concentration & Characteristics

Waterproofing membrane industry is highly impacted by stringent regulatory standards pertaining to quality, environmental impact, production methods, among others. Companies exceeding regulations and standards have competitive edge and non-compliant players face challenges. It has further induced innovation and adaption of new materials.

Waterproofing membrane has a few direct substitutes available in the market that are restraining and challenging the growth of the market. Consumer preferences impact demand and vary based on budget constraints, construction, and desired application method, therefore it is necessary to enhance performance of waterproofing membrane to sustain in a competitive environment.

End-user concentration in market is moderate and serves end-use industries such as construction & infrastructure, and water & wastewater management. Understanding and catering to the requirements of these industries across diverse regions with different climate conditions is necessary to influence demand for waterproofing membrane.

Product Insights

The liquid applied membrane product segment led the market and accounted for more than 64.1% share of the global revenue in 2023. The growth can be attributed to the growing awareness about the advantages of the product such as cost-effectiveness and ease of installation.

In addition, increasing global infrastructural in terms of water conservation and treatment is expected to rise the demand for the liquid applied membrane during the fore coming period. In terms of region, Asia Pacific, North America, and Europe have been the largest markets for liquid applied membranes; however, Asia Pacific is projected to emerge as the fastest-growing regional market over the forecast period, followed by Europe.

Polyurethane liquid applied membrane is expected to grow at a significant rate of 10.8% in terms of revenue during the forecast period. It features uniform thickness making its utilization easy across various applications. These membranes are typically utilized for applications such as the waterproofing of roofs, wet rooms, water & sewage treatment plants, and stadium stands.

Demand for the bituminous liquid membrane is expected to grow at a CAGR of 8.8% in terms of volume over the projected period, owing to its unique properties such as high resistance to weathering and aging. It increases product viability in terms of flexibility at low temperatures, high UV resistance properties, and improved flow resistance at high temperatures.

Polyvinyl chloride membrane is expected to achieve a notable market share in 2023 and is likely to register a prominent share over the forecast period owing to the product advantages such as resistance to UV radiation and precipitation.

In addition, the product’s ability to withstand heavy loads is expected to add growth prospects to the market. Various advantages of PVC membranes such as resistance to precipitation, UV radiation, and ability to withstand heavy loads are anticipated to provide positive scope for product demand over the forecast period.

Application Insights

The roofing application segment held the largest revenue share of 37.9% in 2023. The growth can be attributed to its rising application in the Asia-Pacific region for residential housing construction. In addition, demand for sheet membranes for roofs due to high exposure to rainwater and environmental moisture is expected to drive the growth of the roofing segment over the next seven years.
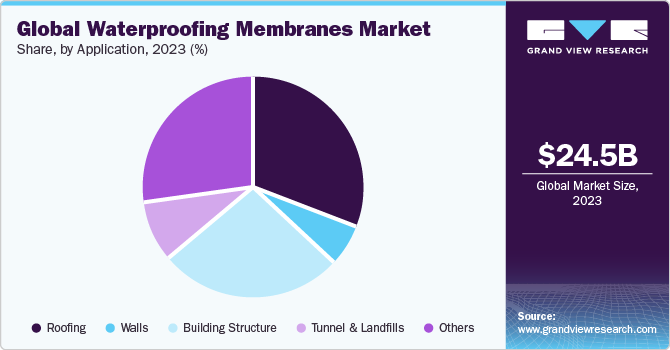
Global Waterproofing Membrane market share and size, 2023

The building structure is expected to witness a CAGR of 9.4% in terms of revenue over the forecasted period which can be attributed due to its application in buildings to improve the shelf life and protection at varying temperatures. In addition, the increasing use of sheet membranes for flooring in buildings is expected to contribute to growth prospects.

Landfill and tunnels accounted for USD 2.13 billion in 2023 and is expected to witness substantial growth during the forecast period owing to the rise in demand for cleaning methods in the tunnels. Rising demand for waterproofing membranes in developing countries on account of increasing industrial activity which in turn leads to a rising amount of waste is expected to drive the market growth on a positive note.

Other application segments of the waterproofing membrane include usage in wet rooms, kitchen floors, bathrooms, and areas surrounding the swimming pool. In addition, increasing awareness such as long-term cost-effectiveness and risk mitigation by applying waterproofing membrane is further expected to add positive growth to the market.

Regional Insights

Asia Pacific accounted for the largest revenue share of 32.3% in 2023. The growth can be attributed to the growing infrastructural developments and rapid industrialization, especially in China and India. In addition, the trend will increase the congestion in the city which in turn will increase the demand for utilities in a domestic application for water requirement, thus adding growth to the market. In addition, the rising roofing and waste management industries are driving regional growth. The use of waterproofing membranes in mining application is further expected to fuel the growth.
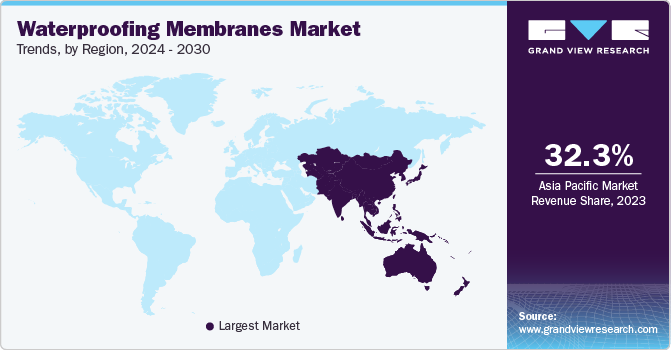
Waterproofing Membrane Market Trends, by Region, 2024 - 2030

The market in North America was estimated to be USD 5.60 billion in 2023 and is expected to grow at a significant rate over the forecast period, which can be attributed to the rise in construction activities in Mexico and Canada. In addition, rising investment in warehouse construction for the healthcare, retail, and automotive application industry requiring waterproofing solutions is positively impacting the industry’s growth.

The product demand in Europe is dominated by product penetration in advanced countries such as the U.K., Germany, and France. In addition, the increasing adoption of waste management and water conservation demanding liquid applied and sheet membrane products in residential & buildings is further expected to increase the product demand in the region over the forecast period. Revival of the construction industry coupled with increasing investment in Eastern European economies is expected to have a positive impact on liquid applied membranes market demand over the forecast period.

The demand for waterproofing membranes in Central & South America is likely to witness a CAGR of 8.4% in terms of volume from 2024 to 2030. In addition, the investment in infrastructural projects by various regional governments is expected to boost the commercial and industrial application segment requiring waterproofing solutions, thereby, further fueling the market growth.

Key Companies & Market Share Insights

The market has been characterized by integration through raw material procurement and waterproofing membrane manufacturing. The waterproofing membrane manufacturers through mergers & acquisitions, capacity expansion, partnerships, and others are trying to increase their sales to facilitate the respective market across the globe.

A large set of companies are involved in waterproofing system market which makes the market highly competitive. Major companies operate their business through a dedicated distribution network to differentiate themselves in the value chain and against competitors.

  • In January 2023, Saint-Gobain announced the acquisition of Brazil’s Matchem, along with an agreement to acquire the Egypt-based IDP Chemicals. The acquisitions are aimed at strengthening Saint-Gobain’s position in the construction chemicals space, with both the acquisitions becoming a part of the Construction Chemicals segment in High-Performance Solutions.

  • In May 2023, ALCHIMICA announced the development of the Humidity Activated Accelerator Technology (HAA) technology, through the combination of ACCELERATOR-3000A and HYPERDESMO. The formulation enables the formation of a membrane that is defect-free and possesses strong elastomeric and mechanical properties.

Key Waterproofing Membranes Companies:

  • BASF SE
  • Kemper System America, Inc.
  • GAF Materials Corporation
  • Paul Bauder GmbH & Co. KG
  • CICO Technologies Ltd.
  • Fosroc Ltd
  • GAF Materials Corporation
  • Alchimica Building Chemicals
  • Maris Polymers
  • Isomat S.A.
  • Bayer MaterialScience AG

Waterproofing Membrane Market Report Scope

Report Attribute

Details

Market size value in 2024

USD 26.12 billion

Revenue forecast in 2030

USD 40.15 billion

Growth rate

CAGR of 8.5% from 2024 to 2030

Historical data

2018 - 2023

Forecast period

2024 - 2030

Quantitative units

Volume in million square meters, revenue in USD million/billion, and CAGR from 2024 to 2030

Report coverage

Volume forecast, revenue forecast, company ranking, competitive landscape, growth factors, and trends

Segments covered

raw material, product, application, construction, region

Regional scope

North America, Europe, Asia Pacific, South America, Middle East & Africa

Country scope

U.S.; Canada; Mexico; Germany; UK; France; Italy; Russia; Spain; Netherlands; China; India; Japan; South Korea; Australia; Singapore; Philippines; Malaysia; Indonesia; Vietnam; Thailand; Brazil; Argentina; Chile; Saudi Arabia; UAE; Kuwait; Qatar; South Africa;

Key companies profiled

BASF SE; Kemper System America, Inc.; GAF Materials Corporation; Paul Bauder GmbH & Co. KG; CICO Technologies Ltd.; Fosroc Ltd; GAF Materials Corporation; Alchimica Building Chemicals; Maris Polymers; Isomat S.A.; Bayer MaterialScience AG;

Customization scope

Free report customization (equivalent up to 8 analysts working days) with purchase. Addition or alteration to country, regional & segment scope.

Pricing and purchase options

Avail customized purchase options to meet your exact research needs. Explore purchase options


Global Waterproofing Membrane Market Report Segmentation

This report forecasts revenue growth at global, regional & country levels and provides an analysis on the industry trends in each of the sub-segments from 2018 to 2030. For the purpose of this study, Grand View Research has segmented the global waterproofing membrane market report on the basis of raw material, product, application, construction, and region:

  • Raw Material Outlook (Volume, Million Square Meters; Revenue, USD Million; 2018 - 2030)

    • Modified Bitumen

      • SBS

      • APP

    • PVC

    • EPDM

    • TPO

    • Acrylic

    • Polyurea

    • Polyurethane

    • PMMA

    • EVA

    • PE

      • HDPE

      • LDPE

  • Product Outlook (Volume, Million Square Meters; Revenue, USD Million; 2018 - 2030)

    • Liquid Applied Membranes

      • Cementitious

      • Bituminous

      • Polyurethane

      • Acrylic

      • PMMA

      • Elastomeric

    • Sheet Membranes

      • Bituminous

      • Polyvinyl Chloride (PVC)

      • Ethylene Propylene Diene Monomer (EPDM)

      • Other

  • Application Outlook (Volume, Million Square Meters; Revenue, USD Million; 2018 - 2030)

    • Roofing

    • Walls

    • Building Structure

      • Commercial

      • Residential

    • Tunnel & Landfills

    • Other

  • Construction Outlook (Volume, Million Square Meters; Revenue, USD Million; 2018 - 2030)

    • New Construction

    • Refurbishment

  • Regional Outlook (Volume, Million Square Meters; Revenue, USD Million; 2018 - 2030)

    • North America

      • U.S.

      • Canada

      • Mexico

    • Europe

      • Germany

      • UK

      • France

      • Italy

      • Russia

      • Spain

      • Netherlands

    • Asia Pacific

      • China

      • India

      • Japan

      • South Korea

      • Australia

      • Singapore

      • Philippines

      • Malaysia

      • Indonesia

      • Vietnam

      • Thailand

    • Central & South America

      • Brazil

      • Argentina

      • Chile

    • Middle East & Africa

      • Saudi Arabia

      • UAE

      • Kuwait

      • Qatar

      • South Africa

Frequently Asked Questions About This Report

Table of Contents

Chapter 1. Methodology and Scope
                   1.1. Market Segmentation & Scope
                   1.2. Market Definition
                   1.3. Information Procurement
                       1.3.1. Purchased Database
                       1.3.2. GVR’s Internal Database
                       1.3.3. Secondary Sources & Third-Party Perspectives
                       1.3.4. Primary Research
                   1.4. Information Analysis
                       1.4.1. Data Analysis Models
                   1.5. Market Formulation & Data Visualization
                   1.6. Data Validation & Publishing
Chapter 2. Executive Summary
                   2.1. Market Outlook
                   2.2. Segmental Outlook
                   2.3. Competitive Insights
Chapter 3. Market Variables, Trends, and Scope
                   3.1. Ancillary Market Outlook
                   3.2. Industry Value Chain Analysis
                       3.2.1. Major Raw Material Trends Analysis
                   3.3. Raw-material trends
                       3.3.1. Bitumen
                       3.3.2. Polypropylene
                   3.4. Technology Trend
                       3.4.1. Process for manufacturing a waterproofing membrane.
                       3.4.2. Manufacturing of PVC type waterproofing membrane
                           3.4.2.1. Co-Extrusion
                           3.4.2.2. Caste Spreading
                   3.5. Polyurethane Liquid Membranes -Technology overview
                       3.5.1. The α Technology
                       3.5.2. Liquid applied membrane with moisture triggered polyurethane technology.
                       3.5.3. Rapid-curing resin technology
                       3.5.4. Solvent-free and “Odor-free” technology for concrete surface
                       3.5.5. Liquid cold applied membranes
                   3.6. Regulatory Framework
                   3.7. Market Dynamics
                       3.7.1. Market Driver Analysis
                       3.7.2. Market Restraint Analysis
                       3.7.3. Industry Challenges
                   3.8. Business Environmental Tools Analysis: Waterproofing membranes Market
                       3.8.1. Porter’s Five Forces Analysis
                           3.8.1.1. Bargaining Power of Suppliers
                           3.8.1.2. Bargaining Power of Buyers
                           3.8.1.3. Threat of Substitution
                           3.8.1.4. Threat of New Entrants
                           3.8.1.5. Competitive Rivalry
                       3.8.2. PESTLE Analysis
                           3.8.2.1. Political Landscape
                           3.8.2.2. Economic Landscape
                           3.8.2.3. Social Landscape
                           3.8.2.4. Technology Landscape
                           3.8.2.5. Environmental Landscape
                           3.8.2.6. Legal Landscape
                   3.9. Case studies
Chapter 4. Waterproofing membranes Market: Raw Material Estimates & Trend Analysis
                   4.1. Waterproofing membranes Market: Material Movement Analysis, 2023 & 2030
                       4.1.1. Modified Bitumen
                           4.1.1.1. SBS
                           4.1.1.2. APP
                       4.1.2. PVC
                       4.1.3. EPDM
                       4.1.4. TPO
                       4.1.5. Acrylic
                       4.1.6. Polyurea
                       4.1.7. Polyurethane
                       4.1.8. PMMA
                       4.1.9. EVA
                       4.1.10. PE
                           4.1.10.1. HDPE
                           4.1.10.2. LDPE
Chapter 5. Waterproofing membranes Market: Product Estimates & Trend Analysis
                   5.1. Waterproofing membranes Market: Material Movement Analysis, 2023 & 2030
                   5.2. Liquid Applied Membranes
                       5.2.1. Market estimates and forecasts, 2018 - 2030 (USD Million) (Million Square meters)
                       5.2.2. Cementitious
                           5.2.2.1. Market estimates and forecasts, 2018 - 2030 (USD Million) (Million Square Meters)
                       5.2.3. Bituminous
                           5.2.3.1. Market estimates and forecasts, 2018 - 2030 (USD Million) (Million Square Meters)
                       5.2.4. Polyethylene
                           5.2.4.1. Market estimates and forecasts, 2018 - 2030 (USD Million) (Million Square Meters)
                       5.2.5. Acrylic
                           5.2.5.1. Market estimates and forecasts, 2018 - 2030 (USD Million) (Million Square meters)
                       5.2.6. PMMA
                           5.2.6.1. Market estimates and forecasts, 2018 - 2030 (USD Million) (Million Square meters)
                       5.2.7. Elastomeric
                           5.2.7.1. Market estimates and forecasts, 2018 - 2030 (USD Million) (Million Square meters)
                       5.2.8. Others
                           5.2.8.1. Market estimates and forecasts, 2018 - 2030 (USD Million) (Million Square meters)
                   5.3. Sheet Membranes
                       5.3.1. Market estimates and forecasts, 2018 - 2030 (USD Million) (Million Square meters)
                       5.3.2. Bituminous
                           5.3.2.1. Market estimates and forecasts, 2018 - 2030 (USD Million) (Million Square Meters)
                       5.3.3. Polyvinyl Chloride (PVC)
                           5.3.3.1. Market estimates and forecasts, 2018 - 2030 (USD Million) (Million Square Meters)
                       5.3.4. Ethylene Propylene Diene Monomer (EPDM)
                           5.3.4.1. Market estimates and forecasts, 2018 - 2030 (USD Million) (Million Square Meters)
                       5.3.5. Others
                           5.3.5.1. Market estimates and forecasts, 2018 - 2030 (USD Million) (Million Square meters)
Chapter 6. Waterproofing membranes Market: Application Estimates & Trend Analysis
                   6.1. Waterproofing membranes Market: Application Movement Analysis, 2023 & 2030
                   6.2. Roofing
                       6.2.1. Market estimates and forecasts, 2018 - 2030 (USD Million) (Million Square meters)
                   6.3. Walls
                       6.3.1. Market estimates and forecasts, 2018 - 2030 (USD Million) (Million Square meters)
                   6.4. Building Structures
                       6.4.1. Market estimates and forecasts, 2018 - 2030 (USD Million) (Million Square meters)
                       6.4.2. Residential
                           6.4.2.1. Market estimates and forecasts, 2018 - 2030 (USD Million) (Million Square meters)
                       6.4.3. Commercial
                           6.4.3.1. Market estimates and forecasts, 2018 - 2030 (USD Million) (Million Square meters)
                   6.5. Landfills & Structures
                       6.5.1. Market estimates and forecasts, 2018 - 2030 (USD Million) (Million Square meters)
                   6.6. Others
                       6.6.1. Market estimates and forecasts, 2018 - 2030 (USD Million) (Million Square meters)
Chapter 7. Waterproofing membranes Market: Regional Estimates & Trend Analysis
                   7.1. Regional Movement Analysis & Market Share, 2023 & 2030
                   7.2. Waterproofing membranes market: Regional movement analysis, 2023 & 2030
                   7.3. North America
                       7.3.1. Market estimates and forecasts, 2018 - 2030 (USD Million) (Million Square meters)
                       7.3.2. Market estimates and forecasts, by raw material, 2018 - 2030 (USD Million) (Million Square meters)
                       7.3.3. Market estimates and forecasts, by product, 2018 - 2030 (USD Million) (Million Square meters)
                           7.3.3.1. Market estimates and forecasts, by liquid membrane product, 2018 - 2030 (USD Million) (Million Square meters)
                           7.3.3.2. Market estimates and forecasts, by sheet waterproofing membrane product, 2018 - 2030 (USD Million) (Million Square meters)
                       7.3.4. Market estimates and forecasts, by application, 2018 - 2030 (USD Million) (Million Square meters)
                       7.3.5. Market estimates and forecasts, by construction, 2018 - 2030 (USD Million) (Million Square meters)
                       7.3.6. U.S.
                           7.3.6.1. Market estimates and forecasts, 2018 - 2030 (USD Million) (Million Square meters)
                           7.3.6.2. Market estimates and forecasts, by raw material, 2018 - 2030 (USD Million) (Million Square meters)
                           7.3.6.3. Market estimates and forecasts, by product, 2018 - 2030 (USD Million) (Million Square meters)
                               7.3.6.3.1. Market estimates and forecasts, by liquid membrane product, 2018 - 2030 (USD Million) (Million Square meters)
                               7.3.6.3.2. Market estimates and forecasts, by sheet waterproofing membrane product, 2018 - 2030 (USD Million) (Million Square meters)
                           7.3.6.4. Market estimates and forecasts, by application, 2018 - 2030 (USD Million) (Million Square meters)
                           7.3.6.5. Market estimates and forecasts, by construction, 2018 - 2030 (USD Million) (Million Square meters)
                       7.3.7. Canada
                           7.3.7.1. Market estimates and forecasts, 2018 - 2030 (USD Million) (Million Square meters)
                           7.3.7.2. Market estimates and forecasts, by raw material, 2018 - 2030 (USD Million) (Million Square meters)
                           7.3.7.3. Market estimates and forecasts, by product, 2018 - 2030 (USD Million) (Million Square meters)
                               7.3.7.3.1. Market estimates and forecasts, by liquid membrane product, 2018 - 2030 (USD Million) (Million Square meters)
                               7.3.7.3.2. Market estimates and forecasts, by sheet waterproofing membrane product, 2018 - 2030 (USD Million) (Million Square meters)
                           7.3.7.4. Market estimates and forecasts, by application, 2018 - 2030 (USD Million) (Million Square meters)
                           7.3.7.5. Market estimates and forecasts, by construction, 2018 - 2030 (USD Million) (Million Square meters)
                       7.3.8. Mexico
                           7.3.8.1. Market estimates and forecasts, 2018 - 2030 (USD Million) (Million Square meters)
                           7.3.8.2. Market estimates and forecasts, by raw material, 2018 - 2030 (USD Million) (Million Square meters)
                           7.3.8.3. Market estimates and forecasts, by product, 2018 - 2030 (USD Million) (Million Square meters)
                               7.3.8.3.1. Market estimates and forecasts, by liquid membrane product, 2018 - 2030 (USD Million) (Million Square meters)
                               7.3.8.3.2. Market estimates and forecasts, by sheet waterproofing membrane product, 2018 - 2030 (USD Million) (Million Square meters)
                           7.3.8.4. Market estimates and forecasts, by application, 2018 - 2030 (USD Million) (Million Square meters)
                           7.3.8.5. Market estimates and forecasts, by construction, 2018 - 2030 (USD Million) (Million Square meters)
                   7.4. Europe
                       7.4.1. Market estimates and forecasts, 2018 - 2030 (USD Million) (Million Square meters)
                       7.4.2. Market estimates and forecasts, by raw material, 2018 - 2030 (USD Million) (Million Square meters)
                       7.4.3. Market estimates and forecasts, by product, 2018 - 2030 (USD Million) (Million Square meters)
                           7.4.3.1. Market estimates and forecasts, by liquid membrane product, 2018 - 2030 (USD Million) (Million Square meters)
                           7.4.3.2. Market estimates and forecasts, by sheet waterproofing membrane product, 2018 - 2030 (USD Million) (Million Square meters)
                       7.4.4. Market estimates and forecasts, by application, 2018 - 2030 (USD Million) (Million Square meters)
                       7.4.5. Market estimates and forecasts, by construction, 2018 - 2030 (USD Million) (Million Square meters)
                       7.4.6. Germany
                           7.4.6.1. Market estimates and forecasts, 2018 - 2030 (USD Million) (Million Square meters)
                           7.4.6.2. Market estimates and forecasts, by raw material, 2018 - 2030 (USD Million) (Million Square meters)
                           7.4.6.3. Market estimates and forecasts, by product, 2018 - 2030 (USD Million) (Million Square meters)
                               7.4.6.3.1. Market estimates and forecasts, by liquid membrane product, 2018 - 2030 (USD Million) (Million Square meters)
                               7.4.6.3.2. Market estimates and forecasts, by sheet waterproofing membrane product, 2018 - 2030 (USD Million) (Million Square meters)
                           7.4.6.4. Market estimates and forecasts, by application, 2018 - 2030 (USD Million) (Million Square meters)
                           7.4.6.5. Market estimates and forecasts, by construction, 2018 - 2030 (USD Million) (Million Square meters)
                       7.4.7. France
                           7.4.7.1. Market estimates and forecasts, 2018 - 2030 (USD Million) (Million Square meters)
                           7.4.7.2. Market estimates and forecasts, by raw material, 2018 - 2030 (USD Million) (Million Square meters)
                           7.4.7.3. Market estimates and forecasts, by product, 2018 - 2030 (USD Million) (Million Square meters)
                               7.4.7.3.1. Market estimates and forecasts, by liquid membrane product, 2018 - 2030 (USD Million) (Million Square meters)
                               7.4.7.3.2. Market estimates and forecasts, by sheet waterproofing membrane product, 2018 - 2030 (USD Million) (Million Square meters)
                           7.4.7.4. Market estimates and forecasts, by application, 2018 - 2030 (USD Million) (Million Square meters)
                           7.4.7.5. Market estimates and forecasts, by construction, 2018 - 2030 (USD Million) (Million Square meters)
                       7.4.8. UK
                           7.4.8.1. Market estimates and forecasts, 2018 - 2030 (USD Million) (Million Square meters)
                           7.4.8.2. Market estimates and forecasts, by raw material, 2018 - 2030 (USD Million) (Million Square meters)
                           7.4.8.3. Market estimates and forecasts, by product, 2018 - 2030 (USD Million) (Million Square meters)
                               7.4.8.3.1. Market estimates and forecasts, by liquid membrane product, 2018 - 2030 (USD Million) (Million Square meters)
                               7.4.8.3.2. Market estimates and forecasts, by sheet waterproofing membrane product, 2018 - 2030 (USD Million) (Million Square meters)
                           7.4.8.4. Market estimates and forecasts, by application, 2018 - 2030 (USD Million) (Million Square meters)
                           7.4.8.5. Market estimates and forecasts, by construction, 2018 - 2030 (USD Million) (Million Square meters)
                       7.4.9. Italy
                           7.4.9.1. Market estimates and forecasts, 2018 - 2030 (USD Million) (Million Square meters)
                           7.4.9.2. Market estimates and forecasts, by raw material, 2018 - 2030 (USD Million) (Million Square meters)
                           7.4.9.3. Market estimates and forecasts, by product, 2018 - 2030 (USD Million) (Million Square meters)
                               7.4.9.3.1. Market estimates and forecasts, by liquid membrane product, 2018 - 2030 (USD Million) (Million Square meters)
                               7.4.9.3.2. Market estimates and forecasts, by sheet waterproofing membrane product, 2018 - 2030 (USD Million) (Million Square meters)
                           7.4.9.4. Market estimates and forecasts, by application, 2018 - 2030 (USD Million) (Million Square meters)
                           7.4.9.5. Market estimates and forecasts, by construction, 2018 - 2030 (USD Million) (Million Square meters)
                       7.4.10. Russia
                           7.4.10.1. Market estimates and forecasts, 2018 - 2030 (USD Million) (Million Square meters)
                           7.4.10.2. Market estimates and forecasts, by raw material, 2018 - 2030 (USD Million) (Million Square meters)
                           7.4.10.3. Market estimates and forecasts, by product, 2018 - 2030 (USD Million) (Million Square meters)
                               7.4.10.3.1. Market estimates and forecasts, by liquid membrane product, 2018 - 2030 (USD Million) (Million Square meters)
                               7.4.10.3.2. Market estimates and forecasts, by sheet waterproofing membrane product, 2018 - 2030 (USD Million) (Million Square meters)
                           7.4.10.4. Market estimates and forecasts, by application, 2018 - 2030 (USD Million) (Million Square meters)
                           7.4.10.5. Market estimates and forecasts, by construction, 2018 - 2030 (USD Million) (Million Square meters)
                       7.4.11. Spain
                           7.4.11.1. Market estimates and forecasts, 2018 - 2030 (USD Million) (Million Square meters)
                           7.4.11.2. Market estimates and forecasts, by raw material, 2018 - 2030 (USD Million) (Million Square meters)
                           7.4.11.3. Market estimates and forecasts, by product, 2018 - 2030 (USD Million) (Million Square meters)
                               7.4.11.3.1. Market estimates and forecasts, by liquid membrane product, 2018 - 2030 (USD Million) (Million Square meters)
                               7.4.11.3.2. Market estimates and forecasts, by sheet waterproofing membrane product, 2018 - 2030 (USD Million) (Million Square meters)
                           7.4.11.4. Market estimates and forecasts, by application, 2018 - 2030 (USD Million) (Million Square meters)
                           7.4.11.5. Market estimates and forecasts, by construction, 2018 - 2030 (USD Million) (Million Square meters)
                       7.4.12. The Netherlands
                           7.4.12.1. Market estimates and forecasts, 2018 - 2030 (USD Million) (Million Square meters)
                           7.4.12.2. Market estimates and forecasts, by raw material, 2018 - 2030 (USD Million) (Million Square meters)
                           7.4.12.3. Market estimates and forecasts, by product, 2018 - 2030 (USD Million) (Million Square meters)
                               7.4.12.3.1. Market estimates and forecasts, by liquid membrane product, 2018 - 2030 (USD Million) (Million Square meters)
                               7.4.12.3.2. Market estimates and forecasts, by sheet waterproofing membrane product, 2018 - 2030 (USD Million) (Million Square meters)
                           7.4.12.4. Market estimates and forecasts, by application, 2018 - 2030 (USD Million) (Million Square meters)
                           7.4.12.5. Market estimates and forecasts, by construction, 2018 - 2030 (USD Million) (Million Square meters)
                   7.5. Asia Pacific
                       7.5.1. Market estimates and forecasts, 2018 - 2030 (USD Million) (Million Square meters)
                       7.5.2. Market estimates and forecasts, by raw material, 2018 - 2030 (USD Million) (Million Square meters)
                       7.5.3. Market estimates and forecasts, by product, 2018 - 2030 (USD Million) (Million Square meters)
                           7.5.3.1. Market estimates and forecasts, by liquid membrane product, 2018 - 2030 (USD Million) (Million Square meters)
                           7.5.3.2. Market estimates and forecasts, by sheet waterproofing membrane product, 2018 - 2030 (USD Million) (Million Square meters)
                       7.5.4. Market estimates and forecasts, by application, 2018 - 2030 (USD Million) (Million Square meters)
                       7.5.5. Market estimates and forecasts, by construction, 2018 - 2030 (USD Million) (Million Square meters)
                       7.5.6. China
                           7.5.6.1. Market estimates and forecasts, 2018 - 2030 (USD Million) (Million Square meters)
                           7.5.6.2. Market estimates and forecasts, by raw material, 2018 - 2030 (USD Million) (Million Square meters)
                           7.5.6.3. Market estimates and forecasts, by product, 2018 - 2030 (USD Million) (Million Square meters)
                               7.5.6.3.1. Market estimates and forecasts, by liquid membrane product, 2018 - 2030 (USD Million) (Million Square meters)
                               7.5.6.3.2. Market estimates and forecasts, by sheet waterproofing membrane product, 2018 - 2030 (USD Million) (Million Square meters)
                           7.5.6.4. Market estimates and forecasts, by application, 2018 - 2030 (USD Million) (Million Square meters)
                           7.5.6.5. Market estimates and forecasts, by construction, 2018 - 2030 (USD Million) (Million Square meters)
                       7.5.7. Japan
                           7.5.7.1. Market estimates and forecasts, 2018 - 2030 (USD Million) (Million Square meters)
                           7.5.7.2. Market estimates and forecasts, by raw material, 2018 - 2030 (USD Million) (Million Square meters)
                           7.5.7.3. Market estimates and forecasts, by product, 2018 - 2030 (USD Million) (Million Square meters)
                               7.5.7.3.1. Market estimates and forecasts, by liquid membrane product, 2018 - 2030 (USD Million) (Million Square meters)
                               7.5.7.3.2. Market estimates and forecasts, by sheet waterproofing membrane product, 2018 - 2030 (USD Million) (Million Square meters)
                           7.5.7.4. Market estimates and forecasts, by application, 2018 - 2030 (USD Million) (Million Square meters)
                           7.5.7.5. Market estimates and forecasts, by construction, 2018 - 2030 (USD Million) (Million Square meters)
                       7.5.8. India
                           7.5.8.1. Market estimates and forecasts, 2018 - 2030 (USD Million) (Million Square meters)
                           7.5.8.2. Market estimates and forecasts, by raw material, 2018 - 2030 (USD Million) (Million Square meters)
                           7.5.8.3. Market estimates and forecasts, by product, 2018 - 2030 (USD Million) (Million Square meters)
                               7.5.8.3.1. Market estimates and forecasts, by liquid membrane product, 2018 - 2030 (USD Million) (Million Square meters)
                               7.5.8.3.2. Market estimates and forecasts, by sheet waterproofing membrane product, 2018 - 2030 (USD Million) (Million Square meters)
                           7.5.8.4. Market estimates and forecasts, by application, 2018 - 2030 (USD Million) (Million Square meters)
                           7.5.8.5. Market estimates and forecasts, by construction, 2018 - 2030 (USD Million) (Million Square meters)
                       7.5.9. South Korea
                           7.5.9.1. Market estimates and forecasts, 2018 - 2030 (USD Million) (Million Square meters)
                           7.5.9.2. Market estimates and forecasts, by raw material, 2018 - 2030 (USD Million) (Million Square meters)
                           7.5.9.3. Market estimates and forecasts, by product, 2018 - 2030 (USD Million) (Million Square meters)
                               7.5.9.3.1. Market estimates and forecasts, by liquid membrane product, 2018 - 2030 (USD Million) (Million Square meters)
                               7.5.9.3.2. Market estimates and forecasts, by sheet waterproofing membrane product, 2018 - 2030 (USD Million) (Million Square meters)
                           7.5.9.4. Market estimates and forecasts, by application, 2018 - 2030 (USD Million) (Million Square meters)
                           7.5.9.5. Market estimates and forecasts, by construction, 2018 - 2030 (USD Million) (Million Square meters)
                       7.5.10. Australia
                           7.5.10.1. Market estimates and forecasts, 2018 - 2030 (USD Million) (Million Square meters)
                           7.5.10.2. Market estimates and forecasts, by raw material, 2018 - 2030 (USD Million) (Million Square meters)
                           7.5.10.3. Market estimates and forecasts, by product, 2018 - 2030 (USD Million) (Million Square meters)
                               7.5.10.3.1. Market estimates and forecasts, by liquid membrane product, 2018 - 2030 (USD Million) (Million Square meters)
                               7.5.10.3.2. Market estimates and forecasts, by sheet waterproofing membrane product, 2018 - 2030 (USD Million) (Million Square meters)
                           7.5.10.4. Market estimates and forecasts, by application, 2018 - 2030 (USD Million) (Million Square meters)
                           7.5.10.5. Market estimates and forecasts, by construction, 2018 - 2030 (USD Million) (Million Square meters)
                       7.5.11. Singapore
                           7.5.11.1. Market estimates and forecasts, 2018 - 2030 (USD Million) (Million Square meters)
                           7.5.11.2. Market estimates and forecasts, by raw material, 2018 - 2030 (USD Million) (Million Square meters)
                           7.5.11.3. Market estimates and forecasts, by product, 2018 - 2030 (USD Million) (Million Square meters)
                               7.5.11.3.1. Market estimates and forecasts, by liquid membrane product, 2018 - 2030 (USD Million) (Million Square meters)
                               7.5.11.3.2. Market estimates and forecasts, by sheet waterproofing membrane product, 2018 - 2030 (USD Million) (Million Square meters)
                           7.5.11.4. Market estimates and forecasts, by application, 2018 - 2030 (USD Million) (Million Square meters)
                           7.5.11.5. Market estimates and forecasts, by construction, 2018 - 2030 (USD Million) (Million Square meters)
                       7.5.12. Philippines
                           7.5.12.1. Market estimates and forecasts, 2018 - 2030 (USD Million) (Million Square meters)
                           7.5.12.2. Market estimates and forecasts, by raw material, 2018 - 2030 (USD Million) (Million Square meters)
                           7.5.12.3. Market estimates and forecasts, by product, 2018 - 2030 (USD Million) (Million Square meters)
                               7.5.12.3.1. Market estimates and forecasts, by liquid membrane product, 2018 - 2030 (USD Million) (Million Square meters)
                               7.5.12.3.2. Market estimates and forecasts, by sheet waterproofing membrane product, 2018 - 2030 (USD Million) (Million Square meters)
                           7.5.12.4. Market estimates and forecasts, by application, 2018 - 2030 (USD Million) (Million Square meters)
                           7.5.12.5. Market estimates and forecasts, by construction, 2018 - 2030 (USD Million) (Million Square meters)
                       7.5.13. Malaysia
                           7.5.13.1. Market estimates and forecasts, 2018 - 2030 (USD Million) (Million Square meters)
                           7.5.13.2. Market estimates and forecasts, by raw material, 2018 - 2030 (USD Million) (Million Square meters)
                           7.5.13.3. Market estimates and forecasts, by product, 2018 - 2030 (USD Million) (Million Square meters)
                               7.5.13.3.1. Market estimates and forecasts, by liquid membrane product, 2018 - 2030 (USD Million) (Million Square meters)
                               7.5.13.3.2. Market estimates and forecasts, by sheet waterproofing membrane product, 2018 - 2030 (USD Million) (Million Square meters)
                           7.5.13.4. Market estimates and forecasts, by application, 2018 - 2030 (USD Million) (Million Square meters)
                           7.5.13.5. Market estimates and forecasts, by construction, 2018 - 2030 (USD Million) (Million Square meters)
                       7.5.14. Indonesia
                           7.5.14.1. Market estimates and forecasts, 2018 - 2030 (USD Million) (Million Square meters)
                           7.5.14.2. Market estimates and forecasts, by raw material, 2018 - 2030 (USD Million) (Million Square meters)
                           7.5.14.3. Market estimates and forecasts, by product, 2018 - 2030 (USD Million) (Million Square meters)
                               7.5.14.3.1. Market estimates and forecasts, by liquid membrane product, 2018 - 2030 (USD Million) (Million Square meters)
                               7.5.14.3.2. Market estimates and forecasts, by sheet waterproofing membrane product, 2018 - 2030 (USD Million) (Million Square meters)
                           7.5.14.4. Market estimates and forecasts, by application, 2018 - 2030 (USD Million) (Million Square meters)
                           7.5.14.5. Market estimates and forecasts, by construction, 2018 - 2030 (USD Million) (Million Square meters)
                       7.5.15. Vietnam
                           7.5.15.1. Market estimates and forecasts, 2018 - 2030 (USD Million) (Million Square meters)
                           7.5.15.2. Market estimates and forecasts, by raw material, 2018 - 2030 (USD Million) (Million Square meters)
                           7.5.15.3. Market estimates and forecasts, by product, 2018 - 2030 (USD Million) (Million Square meters)
                               7.5.15.3.1. Market estimates and forecasts, by liquid membrane product, 2018 - 2030 (USD Million) (Million Square meters)
                               7.5.15.3.2. Market estimates and forecasts, by sheet waterproofing membrane product, 2018 - 2030 (USD Million) (Million Square meters)
                           7.5.15.4. Market estimates and forecasts, by application, 2018 - 2030 (USD Million) (Million Square meters)
                           7.5.15.5. Market estimates and forecasts, by construction, 2018 - 2030 (USD Million) (Million Square meters)
                       7.5.16. Thailand
                           7.5.16.1. Market estimates and forecasts, 2018 - 2030 (USD Million) (Million Square meters)
                           7.5.16.2. Market estimates and forecasts, by raw material, 2018 - 2030 (USD Million) (Million Square meters)
                           7.5.16.3. Market estimates and forecasts, by product, 2018 - 2030 (USD Million) (Million Square meters)
                               7.5.16.3.1. Market estimates and forecasts, by liquid membrane product, 2018 - 2030 (USD Million) (Million Square meters)
                               7.5.16.3.2. Market estimates and forecasts, by sheet waterproofing membrane product, 2018 - 2030 (USD Million) (Million Square meters)
                           7.5.16.4. Market estimates and forecasts, by application, 2018 - 2030 (USD Million) (Million Square meters)
                           7.5.16.5. Market estimates and forecasts, by construction, 2018 - 2030 (USD Million) (Million Square meters)
                   7.6. Central & South America
                       7.6.1. Market estimates and forecasts, 2018 - 2030 (USD Million) (Million Square meters)
                       7.6.2. Market estimates and forecasts, by raw material, 2018 - 2030 (USD Million) (Million Square meters)
                       7.6.3. Market estimates and forecasts, by product, 2018 - 2030 (USD Million) (Million Square meters)
                           7.6.3.1. Market estimates and forecasts, by liquid membrane product, 2018 - 2030 (USD Million) (Million Square meters)
                           7.6.3.2. Market estimates and forecasts, by sheet waterproofing membrane product, 2018 - 2030 (USD Million) (Million Square meters)
                       7.6.4. Market estimates and forecasts, by application, 2018 - 2030 (USD Million) (Million Square meters)
                       7.6.5. Market estimates and forecasts, by construction, 2018 - 2030 (USD Million) (Million Square meters)
                       7.6.6. Brazil
                           7.6.6.1. Market estimates and forecasts, 2018 - 2030 (USD Million) (Million Square meters)
                           7.6.6.2. Market estimates and forecasts, by raw material, 2018 - 2030 (USD Million) (Million Square meters)
                           7.6.6.3. Market estimates and forecasts, by product, 2018 - 2030 (USD Million) (Million Square meters)
                               7.6.6.3.1. Market estimates and forecasts, by liquid membrane product, 2018 - 2030 (USD Million) (Million Square meters)
                               7.6.6.3.2. Market estimates and forecasts, by sheet waterproofing membrane product, 2018 - 2030 (USD Million) (Million Square meters)
                           7.6.6.4. Market estimates and forecasts, by application, 2018 - 2030 (USD Million) (Million Square meters)
                           7.6.6.5. Market estimates and forecasts, by construction, 2018 - 2030 (USD Million) (Million Square meters)
                       7.6.7. Argentina
                           7.6.7.1. Market estimates and forecasts, 2018 - 2030 (USD Million) (Million Square meters)
                           7.6.7.2. Market estimates and forecasts, by raw material, 2018 - 2030 (USD Million) (Million Square meters)
                           7.6.7.3. Market estimates and forecasts, by product, 2018 - 2030 (USD Million) (Million Square meters)
                               7.6.7.3.1. Market estimates and forecasts, by liquid membrane product, 2018 - 2030 (USD Million) (Million Square meters)
                               7.6.7.3.2. Market estimates and forecasts, by sheet waterproofing membrane product, 2018 - 2030 (USD Million) (Million Square meters)
                           7.6.7.4. Market estimates and forecasts, by application, 2018 - 2030 (USD Million) (Million Square meters)
                           7.6.7.5. Market estimates and forecasts, by construction, 2018 - 2030 (USD Million) (Million Square meters)
                       7.6.8. Chile
                           7.6.8.1. Market estimates and forecasts, 2018 - 2030 (USD Million) (Million Square meters)
                           7.6.8.2. Market estimates and forecasts, by raw material, 2018 - 2030 (USD Million) (Million Square meters)
                           7.6.8.3. Market estimates and forecasts, by product, 2018 - 2030 (USD Million) (Million Square meters)
                               7.6.8.3.1. Market estimates and forecasts, by liquid membrane product, 2018 - 2030 (USD Million) (Million Square meters)
                               7.6.8.3.2. Market estimates and forecasts, by sheet waterproofing membrane product, 2018 - 2030 (USD Million) (Million Square meters)
                           7.6.8.4. Market estimates and forecasts, by application, 2018 - 2030 (USD Million) (Million Square meters)
                           7.6.8.5. Market estimates and forecasts, by construction, 2018 - 2030 (USD Million) (Million Square meters)
                   7.7. Middle East & Africa
                       7.7.1. Market estimates and forecasts, 2018 - 2030 (USD Million) (Million Square meters)
                       7.7.2. Market estimates and forecasts, by raw material, 2018 - 2030 (USD Million) (Million Square meters)
                       7.7.3. Market estimates and forecasts, by product, 2018 - 2030 (USD Million) (Million Square meters)
                           7.7.3.1. Market estimates and forecasts, by liquid membrane product, 2018 - 2030 (USD Million) (Million Square meters)
                           7.7.3.2. Market estimates and forecasts, by sheet waterproofing membrane product, 2018 - 2030 (USD Million) (Million Square meters)
                       7.7.4. Market estimates and forecasts, by application, 2018 - 2030 (USD Million) (Million Square meters)
                       7.7.5. Market estimates and forecasts, by construction, 2018 - 2030 (USD Million) (Million Square meters)
                       7.7.6. Saudi Arabia
                           7.7.6.1. Market estimates and forecasts, 2018 - 2030 (USD Million) (Million Square meters)
                           7.7.6.2. Market estimates and forecasts, by raw material, 2018 - 2030 (USD Million) (Million Square meters)
                           7.7.6.3. Market estimates and forecasts, by product, 2018 - 2030 (USD Million) (Million Square meters)
                               7.7.6.3.1. Market estimates and forecasts, by liquid membrane product, 2018 - 2030 (USD Million) (Million Square meters)
                               7.7.6.3.2. Market estimates and forecasts, by sheet waterproofing membrane product, 2018 - 2030 (USD Million) (Million Square meters)
                           7.7.6.4. Market estimates and forecasts, by application, 2018 - 2030 (USD Million) (Million Square meters)
                           7.7.6.5. Market estimates and forecasts, by construction, 2018 - 2030 (USD Million) (Million Square meters)
                       7.7.7. UAE
                           7.7.7.1. Market estimates and forecasts, 2018 - 2030 (USD Million) (Million Square meters)
                           7.7.7.2. Market estimates and forecasts, by raw material, 2018 - 2030 (USD Million) (Million Square meters)
                           7.7.7.3. Market estimates and forecasts, by product, 2018 - 2030 (USD Million) (Million Square meters)
                               7.7.7.3.1. Market estimates and forecasts, by liquid membrane product, 2018 - 2030 (USD Million) (Million Square meters)
                               7.7.7.3.2. Market estimates and forecasts, by sheet waterproofing membrane product, 2018 - 2030 (USD Million) (Million Square meters)
                           7.7.7.4. Market estimates and forecasts, by application, 2018 - 2030 (USD Million) (Million Square meters)
                           7.7.7.5. Market estimates and forecasts, by construction, 2018 - 2030 (USD Million) (Million Square meters)
                       7.7.8. Kuwait
                           7.7.8.1. Market estimates and forecasts, 2018 - 2030 (USD Million) (Million Square meters)
                           7.7.8.2. Market estimates and forecasts, by raw material, 2018 - 2030 (USD Million) (Million Square meters)
                           7.7.8.3. Market estimates and forecasts, by product, 2018 - 2030 (USD Million) (Million Square meters)
                               7.7.8.3.1. Market estimates and forecasts, by liquid membrane product, 2018 - 2030 (USD Million) (Million Square meters)
                               7.7.8.3.2. Market estimates and forecasts, by sheet waterproofing membrane product, 2018 - 2030 (USD Million) (Million Square meters)
                           7.7.8.4. Market estimates and forecasts, by application, 2018 - 2030 (USD Million) (Million Square meters)
                           7.7.8.5. Market estimates and forecasts, by construction, 2018 - 2030 (USD Million) (Million Square meters)
                       7.7.9. Qatar
                           7.7.9.1. Market estimates and forecasts, 2018 - 2030 (USD Million) (Million Square meters)
                           7.7.9.2. Market estimates and forecasts, by raw material, 2018 - 2030 (USD Million) (Million Square meters)
                           7.7.9.3. Market estimates and forecasts, by product, 2018 - 2030 (USD Million) (Million Square meters)
                               7.7.9.3.1. Market estimates and forecasts, by liquid membrane product, 2018 - 2030 (USD Million) (Million Square meters)
                               7.7.9.3.2. Market estimates and forecasts, by sheet waterproofing membrane product, 2018 - 2030 (USD Million) (Million Square meters)
                           7.7.9.4. Market estimates and forecasts, by application, 2018 - 2030 (USD Million) (Million Square meters)
                           7.7.9.5. Market estimates and forecasts, by construction, 2018 - 2030 (USD Million) (Million Square meters)
                       7.7.10. South Africa
                           7.7.10.1. Market estimates and forecasts, 2018 - 2030 (USD Million) (Million Square meters)
                           7.7.10.2. Market estimates and forecasts, by raw material, 2018 - 2030 (USD Million) (Million Square meters)
                           7.7.10.3. Market estimates and forecasts, by product, 2018 - 2030 (USD Million) (Million Square meters)
                               7.7.10.3.1. Market estimates and forecasts, by liquid membrane product, 2018 - 2030 (USD Million) (Million Square meters)
                               7.7.10.3.2. Market estimates and forecasts, by sheet waterproofing membrane product, 2018 - 2030 (USD Million) (Million Square meters)
                           7.7.10.4. Market estimates and forecasts, by application, 2018 - 2030 (USD Million) (Million Square meters)
                           7.7.10.5. Market estimates and forecasts, by construction, 2018 - 2030 (USD Million) (Million Square meters)
Chapter 8. Competitive Landscape
                   8.1. Key Global Players, Their Initiatives, & Its Impact on the Market
                   8.2. Competitive Environment
                   8.3. Vendor Landscape
                   8.4. Public companies
                       8.4.1. Company Market Position analysis
                       8.4.2. SWOT
                   8.5. Private companies
Chapter 9. Company Profiles
                   9.1. Sika AG
                       9.1.1. Company overview
                       9.1.2. Financial performance
                       9.1.3. Product benchmarking
                       9.1.4. Strategic initiatives
                   9.2. Pidilite Industries Ltd.
                       9.2.1. Company overview
                       9.2.2. Financial performance
                       9.2.3. Product benchmarking
                       9.2.4. Strategic initiatives
                   9.3. BASF SE
                       9.3.1. Company overview
                       9.3.2. Financial performance
                       9.3.3. Product benchmarking
                       9.3.4. Strategic initiatives
                   9.4. Paul Bauder GmbH & Co. KG
                       9.4.1. Company overview
                       9.4.2. Financial performance
                       9.4.3. Product benchmarking
                       9.4.4. Strategic initiatives
                   9.5. Kemper System America, Inc.
                       9.5.1. Company overview
                       9.5.2. Financial performance
                       9.5.3. Product benchmarking
                       9.5.4. Strategic initiatives
                   9.6. Dow Chemical Company
                       9.6.1. Company overview
                       9.6.2. Financial performance
                       9.6.3. Product benchmarking
                       9.6.4. Strategic initiatives
                   9.7. DuPont
                       9.7.1. Company overview
                       9.7.2. Financial performance
                       9.7.3. Product benchmarking
                       9.7.4. Strategic initiatives
                   9.8. GAF Materials Corporation
                       9.8.1. Company overview
                       9.8.2. Financial performance
                       9.8.3. Product benchmarking
                       9.8.4. Strategic initiatives
                   9.9. Fosroc Ltd.
                       9.9.1. Company overview
                       9.9.2. Financial performance
                       9.9.3. Product benchmarking
                       9.9.4. Strategic initiatives
                   9.10. CICO Technologies Ltd.
                       9.10.1. Company overview
                       9.10.2. Financial performance
                       9.10.3. Product benchmarking
                       9.10.4. Strategic initiatives
                   9.11. Alchimica Building Chemicals
                       9.11.1. Company overview
                       9.11.2. Financial performance
                       9.11.3. Product benchmarking
                       9.11.4. Strategic initiatives
                   9.12. Maris Polymers
                       9.12.1. Company overview
                       9.12.2. Financial performance
                       9.12.3. Product benchmarking
                       9.12.4. Strategic initiatives
                   9.13. Saint-Gobain Weber GmbH
                       9.13.1. Company overview
                       9.13.2. Financial performance
                       9.13.3. Product benchmarking
                       9.13.4. Strategic initiatives
                   9.14. Isomat S.A.
                       9.14.1. Company overview
                       9.14.2. Financial performance
                       9.14.3. Product benchmarking
                       9.14.4. Strategic initiatives
                   9.15. Covestro AG.
                       9.15.1. Company overview
                       9.15.2. Financial performance
                       9.15.3. Product benchmarking
                       9.15.4. Strategic initiatives


List of Tables

1. Liquid applied waterproofing membranes market revenue and volume, 2018 - 2030 (USD Million) (Million Square Meters)
2. Cementitious liquid applied waterproofing membranes market volume, 2018 - 2030 (USD Million) (Million Square Meters)
3. Bituminous liquid applied waterproofing membranes market volume, 2018 - 2030 (USD Million) (Million Square Meters)
4. Polyurethane liquid applied waterproofing membranes market volume, 2018 - 2030 (USD Million) (Million Square Meters)
5. Acrylic liquid applied waterproofing membranes market volume, 2018 - 2030 (USD Million) (Million Square Meters)
6. PMMA liquid applied waterproofing membranes market volume, 2018 - 2030 (USD Million) (Million Square Meters)
7. Elastomeric liquid applied waterproofing membranes market volume, 2018 - 2030 (USD Million) (Million Square Meters)
8. Other liquid applied waterproofing membranes market volume, 2018 - 2030 (USD Million) (Million Square Meters)
9. Sheet waterproofing membranes market revenue and volume, 2018 - 2030 (USD Million) (Million Square Meters)
10. Bituminous sheet waterproofing membranes market volume, 2018 - 2030 (USD Million) (Million Square Meters)
11. Polyvinylchloride sheet waterproofing membranes market volume, 2018 - 2030 (USD Million) (Million Square Meters)
12. Ethylene propylene diene monomer sheet waterproofing membranes market volume, 2018 - 2030 (USD Million) (Million Square Meters)
13. Other sheet waterproofing membranes market volume, 2018 - 2030 (USD Million) (Million Square Meters)
14. Waterproofing membranes market revenue and volume, in roofing, 2018 - 2030 (USD Million) (Million Square Meters)
15. Waterproofing membranes market revenue and volume, in walls, 2018 - 2030 (USD Million) (Million Square Meters)
16. Waterproofing membranes market revenue and volume, in building structures, 2018 - 2030 (USD Million) (Million Square Meters)
17. Waterproofing membranes market revenue and volume, in landfills & tunnels, 2018 - 2030 (USD Million) (Million Square Meters)
18. Waterproofing membranes market revenue and volume, in other applications, 2018 - 2030 (USD Million) (Million Square Meters)
19. Waterproofing membranes market revenue and volume, in new construction, 2018 - 2030 (USD Million) (Million Square Meters)
20. Waterproofing membranes market revenue and volume, in refurbishment, 2018 - 2030 (USD Million) (Million Square Meters)
21. North America waterproofing membranes market revenue and volume, 2018 - 2030 (USD Million) (Million Square Meters)
22. North America waterproofing membranes market revenue by raw material, 2018 - 2030 (USD Million)
23. North America waterproofing membranes market volume by raw material, 2018 - 2030 (Million Square Meters)
24. North America waterproofing membranes market revenue by application, 2018 - 2030 (USD Million)
25. North America waterproofing membranes market volume by application, 2018 - 2030 (Million Square Meters)
26. North America liquid applied waterproofing membranes market revenue by product, 2018 - 2030 (USD Million)
27. North America liquid applied waterproofing membranes market volume by product, 2018 - 2030 (Million Square Meters)
28. North America sheet waterproofing membranes market revenue by product, 2018 - 2030 (USD Million)
29. North America sheet waterproofing membranes market volume by product, 2018 - 2030 (Million Square Meters)
30. North America waterproofing membranes market revenue by end-use, 2018 - 2030 (USD Million)
31. North America waterproofing membranes market volume by end-use, 2018 - 2030 (Million Square Meters)
32. U.S. waterproofing membranes market revenue and volume, 2018 - 2030 (USD Million) (Million Square Meters)
33. U.S. waterproofing membranes market revenue by application, 2018 - 2030 (USD Million)
34. U.S. waterproofing membranes market volume by application, 2018 - 2030 (Million Square Meters)
35. U.S. waterproofing membranes market revenue by raw material, 2018 - 2030 (USD Million)
36. U.S. waterproofing membranes market volume by raw material, 2018 - 2030 (Million Square Meters)
37. U.S. liquid applied waterproofing membranes market revenue by product, 2018 - 2030 (USD Million)
38. U.S. liquid applied waterproofing membranes market volume by product, 2018 - 2030 (Million Square Meters)
39. U.S. sheet waterproofing membranes market revenue by product, 2018 - 2030 (USD Million)
40. U.S. sheet waterproofing membranes market volume by product, 2018 - 2030 (Million Square Meters)
41. U.S. waterproofing membranes market revenue by end-use, 2018 - 2030 (USD Million)
42. U.S. waterproofing membranes market volume by end-use, 2018 - 2030 (Million Square Meters)
43. Canada waterproofing membranes market revenue and volume, 2018 - 2030 (USD Million) (Million Square Meters)
44. Canada waterproofing membranes market revenue by application, 2018 - 2030 (USD Million)
45. Canada waterproofing membranes market volume by application, 2018 - 2030 (Million Square Meters)
46. Canada waterproofing membranes market revenue by raw material, 2018 - 2030 (USD Million)
47. Canada waterproofing membranes market volume by raw material, 2018 - 2030 (Million Square Meters)
48. Canada liquid applied waterproofing membranes market revenue by product, 2018 - 2030 (USD Million)
49. Canada liquid applied waterproofing membranes market volume by product, 2018 - 2030 (Million Square Meters)
50. Canada sheet waterproofing membranes market revenue by product, 2018 - 2030 (USD Million)
51. Canada sheet waterproofing membranes market volume by product, 2018 - 2030 (Million Square Meters)
52. Canada waterproofing membranes market revenue by end-use, 2018 - 2030 (USD Million)
53. Canada waterproofing membranes market volume by end-use, 2018 - 2030 (Million Square Meters)
54. Mexico waterproofing membranes market revenue and volume, 2018 - 2030 (USD Million) (Million Square Meters)
55. Mexico waterproofing membranes market revenue by application, 2018 - 2030 (USD Million)
56. Mexico waterproofing membranes market volume by application, 2018 - 2030 (Million Square Meters)
57. Mexico waterproofing membranes market revenue by raw material, 2018 - 2030 (USD Million)
58. Mexico waterproofing membranes market volume by raw material, 2018 - 2030 (Million Square Meters)
59. Mexico liquid applied waterproofing membranes market revenue by product, 2018 - 2030 (USD Million)
60. Mexico liquid applied waterproofing membranes market volume by product, 2018 - 2030 (Million Square Meters)
61. Mexico sheet waterproofing membranes market revenue by product, 2018 - 2030 (USD Million)
62. Mexico sheet waterproofing membranes market volume by product, 2018 - 2030 (Million Square Meters)
63. Mexico waterproofing membranes market revenue by end-use, 2018 - 2030 (USD Million)
64. Mexico waterproofing membranes market volume by end-use, 2018 - 2030 (Million Square Meters)
65. Europe waterproofing membranes market revenue and volume, 2018 - 2030 (USD Million) (Million Square Meters)
66. Europe waterproofing membranes market revenue by application, 2018 - 2030 (USD Million)
67. Europe waterproofing membranes market volume by application, 2018 - 2030 (Million Square Meters)
68. Europe liquid applied waterproofing membranes market revenue by product, 2018 - 2030 (USD Million)
69. Europe liquid applied waterproofing membranes market volume by product, 2018 - 2030 (Million Square Meters)
70. Europe sheet waterproofing membranes market revenue by product, 2018 - 2030 (USD Million)
71. Europe sheet waterproofing membranes market volume by product, 2018 - 2030 (Million Square Meters)
72. Europe waterproofing membranes market revenue by end-use, 2018 - 2030 (USD Million)
73. Europe waterproofing membranes market volume by end-use, 2018 - 2030 (Million Square Meters)
74. Germany waterproofing membranes market revenue and volume, 2018 - 2030 (USD Million) (Million Square Meters)
75. Germany waterproofing membranes market revenue by application, 2018 - 2030 (USD Million)
76. Germany waterproofing membranes market volume by application, 2018 - 2030 (Million Square Meters)
77. Germany liquid applied waterproofing membranes market revenue by product, 2018 - 2030 (USD Million)
78. Germany liquid applied waterproofing membranes market volume by product, 2018 - 2030 (Million Square Meters)
79. Germany sheet waterproofing membranes market revenue by product, 2018 - 2030 (USD Million)
80. Germany sheet waterproofing membranes market volume by product, 2018 - 2030 (Million Square Meters)
81. Germany waterproofing membranes market revenue by end-use, 2018 - 2030 (USD Million)
82. Germany waterproofing membranes market volume by end-use, 2018 - 2030 (Million Square Meters)
83. U.K. waterproofing membranes market revenue and volume, 2018 - 2030 (USD Million) (Million Square Meters)
84. U.K. waterproofing membranes market revenue by application, 2018 - 2030 (USD Million)
85. U.K. waterproofing membranes market volume by application, 2018 - 2030 (Million Square Meters)
86. U.K. liquid applied waterproofing membranes market revenue by product, 2018 - 2030 (USD Million)
87. U.K. liquid applied waterproofing membranes market volume by product, 2018 - 2030 (Million Square Meters)
88. U.K. sheet waterproofing membranes market revenue by product, 2018 - 2030 (USD Million)
89. U.K. sheet waterproofing membranes market volume by product, 2018 - 2030 (Million Square Meters)
90. U.K. waterproofing membranes market revenue by end-use, 2018 - 2030 (USD Million)
91. U.K. waterproofing membranes market volume by end-use, 2018 - 2030 (Million Square Meters)
92. France waterproofing membranes market revenue and volume, 2018 - 2030 (USD Million) (Million Square Meters)
93. France waterproofing membranes market revenue by application, 2018 - 2030 (USD Million)
94. France waterproofing membranes market volume by application, 2018 - 2030 (Million Square Meters)
95. France waterproofing membranes market revenue by raw material, 2018 - 2030 (USD Million)
96. France waterproofing membranes market volume by raw material, 2018 - 2030 (Million Square Meters)
97. France liquid applied waterproofing membranes market revenue by product, 2018 - 2030 (USD Million)
98. France liquid applied waterproofing membranes market volume by product, 2018 - 2030 (Million Square Meters)
99. France sheet waterproofing membranes market revenue by product, 2018 - 2030 (USD Million)
100. France sheet waterproofing membranes market volume by product, 2018 - 2030 (Million Square Meters)
101. France waterproofing membranes market revenue by end-use, 2018 - 2030 (USD Million)
102. France waterproofing membranes market volume by end-use, 2018 - 2030 (Million Square Meters)
103. Italy waterproofing membranes market revenue and volume, 2018 - 2030 (USD Million) (Million Square Meters)
104. Italy waterproofing membranes market revenue by application, 2018 - 2030 (USD Million)
105. Italy waterproofing membranes market volume by application, 2018 - 2030 (Million Square Meters)
106. Italy waterproofing membranes market revenue by raw material, 2018 - 2030 (USD Million)
107. Italy waterproofing membranes market volume by raw material, 2018 - 2030 (Million Square Meters)
108. Italy liquid applied waterproofing membranes market revenue by product, 2018 - 2030 (USD Million)
109. Italy liquid applied waterproofing membranes market volume by product, 2018 - 2030 (Million Square Meters)
110. Italy sheet waterproofing membranes market revenue by product, 2018 - 2030 (USD Million)
111. Italy sheet waterproofing membranes market volume by product, 2018 - 2030 (Million Square Meters)
112. Italy waterproofing membranes market revenue by end-use, 2018 - 2030 (USD Million)
113. Italy waterproofing membranes market volume by end-use, 2018 - 2030 (Million Square Meters)
114. Spain waterproofing membranes market revenue and volume, 2018 - 2030 (USD Million) (Million Square Meters)
115. Spain waterproofing membranes market revenue by application, 2018 - 2030 (USD Million)
116. Spain waterproofing membranes market volume by application, 2018 - 2030 (Million Square Meters)
117. Spain waterproofing membranes market revenue by raw material, 2018 - 2030 (USD Million)
118. Spain waterproofing membranes market volume by raw material, 2018 - 2030 (Million Square Meters)
119. Spain liquid applied waterproofing membranes market revenue by product, 2018 - 2030 (USD Million)
120. Spain liquid applied waterproofing membranes market volume by product, 2018 - 2030 (Million Square Meters)
121. Spain sheet waterproofing membranes market revenue by product, 2018 - 2030 (USD Million)
122. Spain sheet waterproofing membranes market volume by product, 2018 - 2030 (Million Square Meters)
123. Spain waterproofing membranes market revenue by end-use, 2018 - 2030 (USD Million)
124. Spain waterproofing membranes market volume by end-use, 2018 - 2030 (Million Square Meters)
125. Russia waterproofing membranes market revenue and volume, 2018 - 2030 (USD Million) (Million Square Meters)
126. Russia waterproofing membranes market revenue by application, 2018 - 2030 (USD Million)
127. Russia waterproofing membranes market volume by application, 2018 - 2030 (Million Square Meters)
128. Russia waterproofing membranes market revenue by raw material, 2018 - 2030 (USD Million)
129. Russia waterproofing membranes market volume by raw material, 2018 - 2030 (Million Square Meters)
130. Russia liquid applied waterproofing membranes market revenue by product, 2018 - 2030 (USD Million)
131. Russia liquid applied waterproofing membranes market volume by product, 2018 - 2030 (Million Square Meters)
132. Russia sheet waterproofing membranes market revenue by product, 2018 - 2030 (USD Million)
133. Russia sheet waterproofing membranes market volume by product, 2018 - 2030 (Million Square Meters)
134. Russia waterproofing membranes market revenue by end-use, 2018 - 2030 (USD Million)
135. Russia waterproofing membranes market volume by end-use, 2018 - 2030 (Million Square Meters)
136. The Netherlands waterproofing membranes market revenue and volume, 2018 - 2030 (USD Million) (Million Square Meters)
137. The Netherlands waterproofing membranes market revenue by application, 2018 - 2030 (USD Million)
138. The Netherlands waterproofing membranes market volume by application, 2018 - 2030 (Million Square Meters)
139. The Netherlands waterproofing membranes market revenue by raw material, 2018 - 2030 (USD Million)
140. The Netherlands waterproofing membranes market volume by raw material, 2018 - 2030 (Million Square Meters)
141. The Netherlands liquid applied waterproofing membranes market revenue by product, 2018 - 2030 (USD Million)
142. The Netherlands liquid applied waterproofing membranes market volume by product, 2018 - 2030 (Million Square Meters)
143. The Netherlands sheet waterproofing membranes market revenue by product, 2018 - 2030 (USD Million)
144. The Netherlands sheet waterproofing membranes market volume by product, 2018 - 2030 (Million Square Meters)
145. The Netherlands waterproofing membranes market revenue by end-use, 2018 - 2030 (USD Million)
146. The Netherlands waterproofing membranes market volume by end-use, 2018 - 2030 (Million Square Meters)
147. Asia Pacific waterproofing membranes market revenue and volume, 2018 - 2030 (USD Million) (Million Square Meters)
148. Asia Pacific waterproofing membranes market revenue by application, 2018 - 2030 (USD Million)
149. Asia Pacific waterproofing membranes market volume by application, 2018 - 2030 (Million Square Meters)
150. Asia Pacific liquid applied waterproofing membranes market revenue by product, 2018 - 2030 (USD Million)
151. Asia Pacific liquid applied waterproofing membranes market volume by product, 2018 - 2030 (Million Square Meters)
152. Asia Pacific sheet waterproofing membranes market revenue by product, 2018 - 2030 (USD Million)
153. Asia Pacific sheet waterproofing membranes market volume by product, 2018 - 2030 (Million Square Meters)
154. Asia Pacific waterproofing membranes market revenue by end-use, 2018 - 2030 (USD Million)
155. Asia Pacific waterproofing membranes market volume by end-use, 2018 - 2030 (Million Square Meters)
156. China waterproofing membranes market revenue and volume, 2018 - 2030 (USD Million) (Million Square Meters)
157. China waterproofing membranes market revenue by application, 2018 - 2030 (USD Million)
158. China waterproofing membranes market volume by application, 2018 - 2030 (Million Square Meters)
159. China liquid applied waterproofing membranes market revenue by product, 2018 - 2030 (USD Million)
160. China liquid applied waterproofing membranes market volume by product, 2018 - 2030 (Million Square Meters)
161. China sheet waterproofing membranes market revenue by product, 2018 - 2030 (USD Million)
162. China sheet waterproofing membranes market volume by product, 2018 - 2030 (Million Square Meters)
163. China waterproofing membranes market revenue by end-use, 2018 - 2030 (USD Million)
164. China waterproofing membranes market volume by end-use, 2018 - 2030 (Million Square Meters)
165. Japan waterproofing membranes market revenue and volume, 2018 - 2030 (USD Million) (Million Square Meters)
166. Japan waterproofing membranes market revenue by application, 2018 - 2030 (USD Million)
167. Japan waterproofing membranes market volume by application, 2018 - 2030 (Million Square Meters)
168. Japan liquid applied waterproofing membranes market revenue by product, 2018 - 2030 (USD Million)
169. Japan liquid applied waterproofing membranes market volume by product, 2018 - 2030 (Million Square Meters)
170. Japan sheet waterproofing membranes market revenue by product, 2018 - 2030 (USD Million)
171. Japan sheet waterproofing membranes market volume by product, 2018 - 2030 (Million Square Meters)
172. Japan waterproofing membranes market revenue by end-use, 2018 - 2030 (USD Million)
173. Japan waterproofing membranes market volume by end-use, 2018 - 2030 (Million Square Meters)
174. India waterproofing membranes market revenue and volume, 2018 - 2030 (USD Million) (Million Square Meters)
175. India waterproofing membranes market revenue by application, 2018 - 2030 (USD Million)
176. India waterproofing membranes market volume by application, 2018 - 2030 (Million Square Meters)
177. India waterproofing membranes market revenue by raw material, 2018 - 2030 (USD Million)
178. India waterproofing membranes market volume by raw material, 2018 - 2030 (Million Square Meters)
179. India liquid applied waterproofing membranes market revenue by product, 2018 - 2030 (USD Million)
180. India liquid applied waterproofing membranes market volume by product, 2018 - 2030 (Million Square Meters)
181. India sheet waterproofing membranes market revenue by product, 2018 - 2030 (USD Million)
182. India sheet waterproofing membranes market volume by product, 2018 - 2030 (Million Square Meters)
183. India waterproofing membranes market revenue by end-use, 2018 - 2030 (USD Million)
184. India waterproofing membranes market volume by end-use, 2018 - 2030 (Million Square Meters)
185. South Korea waterproofing membranes market revenue and volume, 2018 - 2030 (USD Million) (Million Square Meters)
186. South Korea waterproofing membranes market revenue by application, 2018 - 2030 (USD Million)
187. South Korea waterproofing membranes market volume by application, 2018 - 2030 (Million Square Meters)
188. South Korea waterproofing membranes market revenue by raw material, 2018 - 2030 (USD Million)
189. South Korea waterproofing membranes market volume by raw material, 2018 - 2030 (Million Square Meters)
190. South Korea liquid applied waterproofing membranes market revenue by product, 2018 - 2030 (USD Million)
191. South Korea liquid applied waterproofing membranes market volume by product, 2018 - 2030 (Million Square Meters)
192. South Korea sheet waterproofing membranes market revenue by product, 2018 - 2030 (USD Million)
193. South Korea sheet waterproofing membranes market volume by product, 2018 - 2030 (Million Square Meters)
194. South Korea waterproofing membranes market revenue by end-use, 2018 - 2030 (USD Million)
195. South Korea waterproofing membranes market volume by end-use, 2018 - 2030 (Million Square Meters)
196. Australia waterproofing membranes market revenue and volume, 2018 - 2030 (USD Million) (Million Square Meters)
197. Australia waterproofing membranes market revenue by application, 2018 - 2030 (USD Million)
198. Australia waterproofing membranes market volume by application, 2018 - 2030 (Million Square Meters)
199. Australia waterproofing membranes market revenue by raw material, 2018 - 2030 (USD Million)
200. Australia waterproofing membranes market volume by raw material, 2018 - 2030 (Million Square Meters)
201. Australia liquid applied waterproofing membranes market revenue by product, 2018 - 2030 (USD Million)
202. Australia liquid applied waterproofing membranes market volume by product, 2018 - 2030 (Million Square Meters)
203. Australia sheet waterproofing membranes market revenue by product, 2018 - 2030 (USD Million)
204. Australia sheet waterproofing membranes market volume by product, 2018 - 2030 (Million Square Meters)
205. Australia waterproofing membranes market revenue by end-use, 2018 - 2030 (USD Million)
206. Australia waterproofing membranes market volume by end-use, 2018 - 2030 (Million Square Meters)
207. Thailand waterproofing membranes market revenue and volume, 2018 - 2030 (USD Million) (Million Square Meters)
208. Thailand waterproofing membranes market revenue by application, 2018 - 2030 (USD Million)
209. Thailand waterproofing membranes market volume by application, 2018 - 2030 (Million Square Meters)
210. Thailand waterproofing membranes market revenue by raw material, 2018 - 2030 (USD Million)
211. Thailand waterproofing membranes market volume by raw material, 2018 - 2030 (Million Square Meters)
212. Thailand liquid applied waterproofing membranes market revenue by product, 2018 - 2030 (USD Million)
213. Thailand liquid applied waterproofing membranes market volume by product, 2018 - 2030 (Million Square Meters)
214. Thailand sheet waterproofing membranes market revenue by product, 2018 - 2030 (USD Million)
215. Thailand sheet waterproofing membranes market volume by product, 2018 - 2030 (Million Square Meters)
216. Thailand waterproofing membranes market revenue by end-use, 2018 - 2030 (USD Million)
217. Thailand waterproofing membranes market volume by end-use, 2018 - 2030 (Million Square Meters)
218. Indonesia waterproofing membranes market revenue and volume, 2018 - 2030 (USD Million) (Million Square Meters)
219. Indonesia waterproofing membranes market revenue by application, 2018 - 2030 (USD Million)
220. Indonesia waterproofing membranes market volume by application, 2018 - 2030 (Million Square Meters)
221. Indonesia waterproofing membranes market revenue by raw material, 2018 - 2030 (USD Million)
222. Indonesia waterproofing membranes market volume by raw material, 2018 - 2030 (Million Square Meters)
223. Indonesia liquid applied waterproofing membranes market revenue by product, 2018 - 2030 (USD Million)
224. Indonesia liquid applied waterproofing membranes market volume by product, 2018 - 2030 (Million Square Meters)
225. Indonesia sheet waterproofing membranes market revenue by product, 2018 - 2030 (USD Million)
226. Indonesia sheet waterproofing membranes market volume by product, 2018 - 2030 (Million Square Meters)
227. Indonesia waterproofing membranes market revenue by end-use, 2018 - 2030 (USD Million)
228. Indonesia waterproofing membranes market volume by end-use, 2018 - 2030 (Million Square Meters)
229. Malaysia waterproofing membranes market revenue and volume, 2018 - 2030 (USD Million) (Million Square Meters)
230. Malaysia waterproofing membranes market revenue by application, 2018 - 2030 (USD Million)
231. Malaysia waterproofing membranes market volume by application, 2018 - 2030 (Million Square Meters)
232. Malaysia waterproofing membranes market revenue by raw material, 2018 - 2030 (USD Million)
233. Malaysia waterproofing membranes market volume by raw material, 2018 - 2030 (Million Square Meters)
234. Malaysia liquid applied waterproofing membranes market revenue by product, 2018 - 2030 (USD Million)
235. Malaysia liquid applied waterproofing membranes market volume by product, 2018 - 2030 (Million Square Meters)
236. Malaysia sheet waterproofing membranes market revenue by product, 2018 - 2030 (USD Million)
237. Malaysia sheet waterproofing membranes market volume by product, 2018 - 2030 (Million Square Meters)
238. Malaysia waterproofing membranes market revenue by end-use, 2018 - 2030 (USD Million)
239. Malaysia waterproofing membranes market volume by end-use, 2018 - 2030 (Million Square Meters)
240. Singapore waterproofing membranes market revenue and volume, 2018 - 2030 (USD Million) (Million Square Meters)
241. Singapore waterproofing membranes market revenue by application, 2018 - 2030 (USD Million)
242. Singapore waterproofing membranes market volume by application, 2018 - 2030 (Million Square Meters)
243. Singapore waterproofing membranes market revenue by raw material, 2018 - 2030 (USD Million)
244. Singapore waterproofing membranes market volume by raw material, 2018 - 2030 (Million Square Meters)
245. Singapore liquid applied waterproofing membranes market revenue by product, 2018 - 2030 (USD Million)
246. Singapore liquid applied waterproofing membranes market volume by product, 2018 - 2030 (Million Square Meters)
247. Singapore sheet waterproofing membranes market revenue by product, 2018 - 2030 (USD Million)
248. Singapore sheet waterproofing membranes market volume by product, 2018 - 2030 (Million Square Meters)
249. Singapore waterproofing membranes market revenue by end-use, 2018 - 2030 (USD Million)
250. Singapore waterproofing membranes market volume by end-use, 2018 - 2030 (Million Square Meters)
251. Philippines waterproofing membranes market revenue and volume, 2018 - 2030 (USD Million) (Million Square Meters)
252. Philippines waterproofing membranes market revenue by application, 2018 - 2030 (USD Million)
253. Philippines waterproofing membranes market volume by application, 2018 - 2030 (Million Square Meters)
254. Philippines waterproofing membranes market revenue by raw material, 2018 - 2030 (USD Million)
255. Philippines waterproofing membranes market volume by raw material, 2018 - 2030 (Million Square Meters)
256. Philippines liquid applied waterproofing membranes market revenue by product, 2018 - 2030 (USD Million)
257. Philippines liquid applied waterproofing membranes market volume by product, 2018 - 2030 (Million Square Meters)
258. Philippines sheet waterproofing membranes market revenue by product, 2018 - 2030 (USD Million)
259. Philippines sheet waterproofing membranes market volume by product, 2018 - 2030 (Million Square Meters)
260. Philippines waterproofing membranes market revenue by end-use, 2018 - 2030 (USD Million)
261. Philippines waterproofing membranes market volume by end-use, 2018 - 2030 (Million Square Meters)
262. Vietnam waterproofing membranes market revenue and volume, 2018 - 2030 (USD Million) (Million Square Meters)
263. Vietnam waterproofing membranes market revenue by application, 2018 - 2030 (USD Million)
264. Vietnam waterproofing membranes market volume by application, 2018 - 2030 (Million Square Meters)
265. Vietnam waterproofing membranes market revenue by raw material, 2018 - 2030 (USD Million)
266. Vietnam waterproofing membranes market volume by raw material, 2018 - 2030 (Million Square Meters)
267. Vietnam liquid applied waterproofing membranes market revenue by product, 2018 - 2030 (USD Million)
268. Vietnam liquid applied waterproofing membranes market volume by product, 2018 - 2030 (Million Square Meters)
269. Vietnam sheet waterproofing membranes market revenue by product, 2018 - 2030 (USD Million)
270. Vietnam sheet waterproofing membranes market volume by product, 2018 - 2030 (Million Square Meters)
271. Vietnam waterproofing membranes market revenue by end-use, 2018 - 2030 (USD Million)
272. Vietnam waterproofing membranes market volume by end-use, 2018 - 2030 (Million Square Meters)
273. Central & South America waterproofing membranes market revenue and volume, 2018 - 2030 (USD Million) (Million Square Meters)
274. Central & South America waterproofing membranes market revenue by application, 2018 - 2030 (USD Million)
275. Central & South America waterproofing membranes market volume by application, 2018 - 2030 (Million Square Meters)
276. Central & South America liquid applied waterproofing membranes market revenue by product, 2018 - 2030 (USD Million)
277. Central & South America liquid applied waterproofing membranes market volume by product, 2018 - 2030 (Million Square Meters)
278. Central & South America sheet waterproofing membranes market revenue by product, 2018 - 2030 (USD Million)
279. Central & South America sheet waterproofing membranes market volume by product, 2018 - 2030 (Million Square Meters)
280. Central & South America waterproofing membranes market revenue by end-use, 2018 - 2030 (USD Million)
281. Central & South America waterproofing membranes market volume by end-use, 2018 - 2030 (Million Square Meters)
282. Brazil waterproofing membranes market revenue and volume, 2018 - 2030 (USD Million) (Million Square Meters)
283. Brazil waterproofing membranes market revenue by application, 2018 - 2030 (USD Million)
284. Brazil waterproofing membranes market volume by application, 2018 - 2030 (Million Square Meters)
285. Brazil liquid applied waterproofing membranes market revenue by product, 2018 - 2030 (USD Million)
286. Brazil liquid applied waterproofing membranes market volume by product, 2018 - 2030 (Million Square Meters)
287. Brazil sheet waterproofing membranes market revenue by product, 2018 - 2030 (USD Million)
288. Brazil sheet waterproofing membranes market volume by product, 2018 - 2030 (Million Square Meters)
289. Brazil waterproofing membranes market revenue by end-use, 2018 - 2030 (USD Million)
290. Brazil waterproofing membranes market volume by end-use, 2018 - 2030 (Million Square Meters)
291. Argentina waterproofing membranes market revenue and volume, 2018 - 2030 (USD Million) (Million Square Meters)
292. Argentina waterproofing membranes market revenue by application, 2018 - 2030 (USD Million)
293. Argentina waterproofing membranes market volume by application, 2018 - 2030 (Million Square Meters)
294. Argentina waterproofing membranes market revenue by raw material, 2018 - 2030 (USD Million)
295. Argentina waterproofing membranes market volume by raw material, 2018 - 2030 (Million Square Meters)
296. Argentina liquid applied waterproofing membranes market revenue by product, 2018 - 2030 (USD Million)
297. Argentina liquid applied waterproofing membranes market volume by product, 2018 - 2030 (Million Square Meters)
298. Argentina sheet waterproofing membranes market revenue by product, 2018 - 2030 (USD Million)
299. Argentina sheet waterproofing membranes market volume by product, 2018 - 2030 (Million Square Meters)
300. Argentina waterproofing membranes market revenue by end-use, 2018 - 2030 (USD Million)
301. Argentina waterproofing membranes market volume by end-use, 2018 - 2030 (Million Square Meters)
302. Chile waterproofing membranes market revenue and volume, 2018 - 2030 (USD Million) (Million Square Meters)
303. Chile waterproofing membranes market revenue by application, 2018 - 2030 (USD Million)
304. Chile waterproofing membranes market volume by application, 2018 - 2030 (Million Square Meters)
305. Chile waterproofing membranes market revenue by raw material, 2018 - 2030 (USD Million)
306. Chile waterproofing membranes market volume by raw material, 2018 - 2030 (Million Square Meters)
307. Chile liquid applied waterproofing membranes market revenue by product, 2018 - 2030 (USD Million)
308. Chile liquid applied waterproofing membranes market volume by product, 2018 - 2030 (Million Square Meters)
309. Chile sheet waterproofing membranes market revenue by product, 2018 - 2030 (USD Million)
310. Chile sheet waterproofing membranes market volume by product, 2018 - 2030 (Million Square Meters)
311. Chile waterproofing membranes market revenue by end-use, 2018 - 2030 (USD Million)
312. Chile waterproofing membranes market volume by end-use, 2018 - 2030 (Million Square Meters)
313. Middle East & Africa waterproofing membranes market revenue and volume, 2018 - 2030 (USD Million) (Million Square Meters)
314. Middle East & Africa waterproofing membranes market revenue by application, 2018 - 2030 (USD Million)
315. Middle East & Africa waterproofing membranes market volume by application, 2018 - 2030 (Million Square Meters)
316. Middle East & Africa liquid applied waterproofing membranes market revenue by product, 2018 - 2030 (USD Million)
317. Middle East & Africa liquid applied waterproofing membranes market volume by product, 2018 - 2030 (Million Square Meters
318. Middle East & Africa sheet waterproofing membranes market revenue by product, 2018 - 2030 (USD Million)
319. Middle East & Africa sheet waterproofing membranes market volume by product, 2018 - 2030 (Million Square Meters)
320. Middle East & Africa waterproofing membranes market revenue by end-use,
321. Middle East & Africa waterproofing membranes market volume by end-use, 2018 - 2030 (Million Square Meters)
322. Saudi Arabia waterproofing membranes market revenue and volume, 2018 - 2030 (USD Million) (Million Square Meters)
323. Saudi Arabia waterproofing membranes market revenue by application, 2018 - 2030 (USD Million)
324. Saudi Arabia waterproofing membranes market volume by application, 2018 - 2030 (Million Square Meters)
325. Saudi Arabia waterproofing membranes market revenue by raw material, 2018 - 2030 (USD Million)
326. Saudi Arabia waterproofing membranes market volume by raw material, 2018 - 2030 (Million Square Meters)
327. Saudi Arabia liquid applied waterproofing membranes market revenue by product, 2018 - 2030 (USD Million)
328. Saudi Arabia liquid applied waterproofing membranes market volume by product, 2018 - 2030 (Million Square Meters)
329. Saudi Arabia sheet waterproofing membranes market revenue by product, 2018 - 2030 (USD Million)
330. Saudi Arabia sheet waterproofing membranes market volume by product, 2018 - 2030 (Million Square Meters)
331. Saudi Arabia waterproofing membranes market revenue by end-use, 2018 - 2030 (USD Million)
332. Saudi Arabia waterproofing membranes market volume by end-use, 2018 - 2030 (Million Square Meters)
333. UAE waterproofing membranes market revenue and volume, 2018 - 2030 (USD Million) (Million Square Meters)
334. UAE waterproofing membranes market revenue by application, 2018 - 2030 (USD Million)
335. UAE waterproofing membranes market volume by application, 2018 - 2030 (Million Square Meters)
336. UAE waterproofing membranes market revenue by raw material, 2018 - 2030 (USD Million)
337. UAE waterproofing membranes market volume by raw material, 2018 - 2030 (Million Square Meters)
338. UAE liquid applied waterproofing membranes market revenue by product, 2018 - 2030 (USD Million)
339. UAE liquid applied waterproofing membranes market volume by product, 2018 - 2030 (Million Square Meters)
340. UAE sheet waterproofing membranes market revenue by product, 2018 - 2030 (USD Million)
341. UAE sheet waterproofing membranes market volume by product, 2018 - 2030 (Million Square Meters)
342. UAE waterproofing membranes market revenue by end-use, 2018 - 2030 (USD Million)
343. UAE waterproofing membranes market volume by end-use, 2018 - 2030 (Million Square Meters)
344. Bahrain waterproofing membranes market revenue and volume, 2018 - 2030 (USD Million) (Million Square Meters)
345. Bahrain waterproofing membranes market revenue by application, 2018 - 2030 (USD Million)
346. Bahrain waterproofing membranes market volume by application, 2018 - 2030 (Million Square Meters)
347. Bahrain waterproofing membranes market revenue by raw material, 2018 - 2030 (USD Million)
348. Bahrain waterproofing membranes market volume by raw material, 2018 - 2030 (Million Square Meters)
349. Bahrain liquid applied waterproofing membranes market revenue by product, 2018 - 2030 (USD Million)
350. Bahrain liquid applied waterproofing membranes market volume by product, 2018 - 2030 (Million Square Meters)
351. Bahrain sheet waterproofing membranes market revenue by product, 2018 - 2030 (USD Million)
352. Bahrain sheet waterproofing membranes market volume by product, 2018 - 2030 (Million Square Meters)
353. Bahrain waterproofing membranes market revenue by end-use, 2018 - 2030 (USD Million)
354. Bahrain waterproofing membranes market volume by end-use, 2018 - 2030 (Million Square Meters)
355. Qatar waterproofing membranes market revenue and volume, 2018 - 2030 (USD Million) (Million Square Meters)
356. Qatar waterproofing membranes market revenue by application, 2018 - 2030 (USD Million)
357. Qatar waterproofing membranes market volume by application, 2018 - 2030 (Million Square Meters)
358. Qatar waterproofing membranes market revenue by raw material, 2018 - 2030 (USD Million)
359. Qatar waterproofing membranes market volume by raw material, 2018 - 2030 (Million Square Meters)
360. Qatar liquid applied waterproofing membranes market revenue by product, 2018 - 2030 (USD Million)
361. Qatar liquid applied waterproofing membranes market volume by product, 2018 - 2030 (Million Square Meters)
362. Qatar sheet waterproofing membranes market revenue by product, 2018 - 2030 (USD Million)
363. Qatar sheet waterproofing membranes market volume by product, 2018 - 2030 (Million Square Meters)
364. Qatar waterproofing membranes market revenue by end-use, 2018 - 2030 (USD Million)
365. Qatar waterproofing membranes market volume by end-use, 2018 - 2030 (Million Square Meters)
366. South Africa waterproofing membranes market revenue and volume, 2018 - 2030 (USD Million) (Million Square Meters)
367. South Africa waterproofing membranes market revenue by application, 2018 - 2030 (USD Million)
368. South Africa waterproofing membranes market volume by application, 2018 - 2030 (Million Square Meters)
369. South Africa waterproofing membranes market revenue by raw material, 2018 - 2030 (USD Million)
370. South Africa waterproofing membranes market volume by raw material, 2018 - 2030 (Million Square Meters)
371. South Africa liquid applied waterproofing membranes market revenue by product, 2018 - 2030 (USD Million)
372. South Africa liquid applied waterproofing membranes market volume by product, 2018 - 2030 (Million Square Meters)
373. South Africa sheet waterproofing membranes market revenue by product, 2018 - 2030 (USD Million)
374. South Africa sheet waterproofing membranes market volume by product, 2018 - 2030 (Million Square Meters)
375. South Africa waterproofing membranes market revenue by end-use, 2018 - 2030 (USD Million)
376. South Africa waterproofing membranes market volume by end-use, 2018 - 2030 (Million Square Meters)
377. Vendor Landscape - Waterproofing membranes market)


List of Figures

1. Waterproofing Membranes Market
2. Information procurement
3. Primary research pattern
4. Primary research process
5. Primary research approaches
6. Penetration & Growth Prospect Mapping
7. Waterproofing Membranes - Value Chain Analysis
8. Top 10 Bitumen Producing Countries, 2023 (Million Tons)
9. Global Average Bitumen Price, 2018 - 2030 (USD/Ton)
10. Polypropylene Average Price Trend, 2018 - 2030 (USD/Ton)
11. Waterproofing Membranes - Market Dynamics
12. Market Driver Analysis
13. Infrastructure Investment in Asia Pacific, 2018 - 2030 (USD Billion)
14. Liquid Waste Management Market by Region, 2020 (USD Million)
15. Market Restraint Analysis
16. Average Bitumen Price, 2018 - 2030 (USD/Ton)
17. Waterproofing membranes market: Raw Material movement analysis, 2023 & 2030
18. Waterproofing membranes market: Product movement analysis, 2023 & 2030
19. Waterproofing membranes market: Construction movement analysis, 2023 & 2030
20. Waterproofing membranes market: Application movement analysis, 2023 & 2030
21. Waterproofing membranes market: Regional movement analysis, 2023 & 2030
22. SWOT analysis - Sika AG
23. SWOT analysis - DowDupont
24 SWOT analysis - BASF SE

What questions do you have? Get quick response from our industry experts. Request a Free Consultation

Market Segmentation

  • Raw Material Outlook (Volume, Million Square meters; Revenue, USD Million; 2018 - 2030)
    • Modified Bitumen
      • SBS
      • APP
    • PVC
    • EPDM
    • TPO
    • Acrylic
    • Polyurea
    • Polyurethane
    • PMMA
    • EVA
    • PE
      • HDPE
      • LDPE
  • Product Outlook (Volume, Million Square meters; Revenue, USD Million; 2018 - 2030)
    • Liquid Applied Membranes
      • Cementitious
      • Bituminous
      • Polyurethane
      • Acrylic
      • PMMA
      • Elastomeric
    • Sheet Membranes
      • Bituminous
      • Polyvinyl Chloride (PVC)
      • Ethylene Propylene Diene Monomer (EPDM)
      • Other
  • Application Outlook (Volume, Million Square meters; Revenue, USD Million; 2018 - 2030)
    • Roofing
    • Walls
    • Building Structure
      • Commercial
      • Residential
    • Tunnel & Landfills
    • Other
  • Construction Outlook (Volume, Million Square meters; Revenue, USD Million; 2018 - 2030)
    • New Construction
    • Refurbishment
  • Waterproofing membranes Market Regional Outlook (Volume, Million Square meters; Revenue, USD Million; 2018 - 2030)
    • North America
      • North America Raw Material Outlook (Volume, Million Square meters; Revenue, USD Million; 2018 - 2030)
        • Modified Bitumen
          • SBS
          • APP
        • PVC
        • EPDM
        • TPO
        • Acrylic
        • Polyurea
        • Polyurethane
        • PMMA
        • EVA
        • PE
          • HDPE
          • LDPE
      • North America Product Outlook (Volume, Million Square meters; Revenue, USD Million; 2018 - 2030)
        • Liquid Applied Membranes
          • Cementitious
          • Bituminous
          • Polyurethane
          • Acrylic
          • PMMA
          • Elastomeric
        • Sheet Membranes
          • Bituminous
          • Polyvinyl Chloride (PVC)
          • Ethylene Propylene Diene Monomer (EPDM)
          • Other
      • North America Application Outlook (Volume, Million Square meters; Revenue, USD Million; 2018 - 2030)
        • Roofing
        • Walls
        • Building Structure
          • Commercial
          • Residential
        • Tunnel & Landfills
        • Other
      • North America Construction Outlook (Volume, Million Square meters; Revenue, USD Million; 2018 - 2030)
        • New Construction
        • Refurbishment
      • U.S.
        • U.S. Raw Material Outlook (Volume, Million Square meters; Revenue, USD Million; 2018 - 2030)
          • Modified Bitumen
            • SBS
            • APP
          • PVC
          • EPDM
          • TPO
          • Acrylic
          • Polyurea
          • Polyurethane
          • PMMA
          • EVA
          • PE
            • HDPE
            • LDPE
        • U.S. Product Outlook (Volume, Million Square meters; Revenue, USD Million; 2018 - 2030)
          • Liquid Applied Membranes
            • Cementitious
            • Bituminous
            • Polyurethane
            • Acrylic
            • PMMA
            • Elastomeric
          • Sheet Membranes
            • Bituminous
            • Polyvinyl Chloride (PVC)
            • Ethylene Propylene Diene Monomer (EPDM)
            • Other
        • U.S. Application Outlook (Volume, Million Square meters; Revenue, USD Million; 2018 - 2030)
          • Roofing
          • Walls
          • Building Structure
            • Commercial
            • Residential
          • Tunnel & Landfills
          • Other
        • U.S. Construction Outlook (Volume, Million Square meters; Revenue, USD Million; 2018 - 2030)
          • New Construction
          • Refurbishment
      • Canada
        • Canada Raw Material Outlook (Volume, Million Square meters; Revenue, USD Million; 2018 - 2030)
          • Modified Bitumen
            • SBS
            • APP
          • PVC
          • EPDM
          • TPO
          • Acrylic
          • Polyurea
          • Polyurethane
          • PMMA
          • EVA
          • PE
            • HDPE
            • LDPE
        • Canada Product Outlook (Volume, Million Square meters; Revenue, USD Million; 2018 - 2030)
          • Liquid Applied Membranes
            • Cementitious
            • Bituminous
            • Polyurethane
            • Acrylic
            • PMMA
            • Elastomeric
          • Sheet Membranes
            • Bituminous
            • Polyvinyl Chloride (PVC)
            • Ethylene Propylene Diene Monomer (EPDM)
            • Other
        • Canada Application Outlook (Volume, Million Square meters; Revenue, USD Million; 2018 - 2030)
          • Roofing
          • Walls
          • Building Structure
            • Commercial
            • Residential
          • Tunnel & Landfills
          • Other
        • Canada Construction Outlook (Volume, Million Square meters; Revenue, USD Million; 2018 - 2030)
          • New Construction
          • Refurbishment
      • Mexico
        • Mexico Raw Material Outlook (Volume, Million Square meters; Revenue, USD Million; 2018 - 2030)
          • Modified Bitumen
            • SBS
            • APP
          • PVC
          • EPDM
          • TPO
          • Acrylic
          • Polyurea
          • Polyurethane
          • PMMA
          • EVA
          • PE
            • HDPE
            • LDPE
        • Mexico Product Outlook (Volume, Million Square meters; Revenue, USD Million; 2018 - 2030)
          • Liquid Applied Membranes
            • Cementitious
            • Bituminous
            • Polyurethane
            • Acrylic
            • PMMA
            • Elastomeric
          • Sheet Membranes
            • Bituminous
            • Polyvinyl Chloride (PVC)
            • Ethylene Propylene Diene Monomer (EPDM)
            • Other
        • Mexico Application Outlook (Volume, Million Square meters; Revenue, USD Million; 2018 - 2030)
          • Roofing
          • Walls
          • Building Structure
            • Commercial
            • Residential
          • Tunnel & Landfills
          • Other
        • Mexico Construction Outlook (Volume, Million Square meters; Revenue, USD Million; 2018 - 2030)
          • New Construction
          • Refurbishment
    • Europe
      • Europe Raw Material Outlook (Volume, Million Square meters; Revenue, USD Million; 2018 - 2030)
        • Modified Bitumen
          • SBS
          • APP
        • PVC
        • EPDM
        • TPO
        • Acrylic
        • Polyurea
        • Polyurethane
        • PMMA
        • EVA
        • PE
          • HDPE
          • LDPE
      • Europe Product Outlook (Volume, Million Square meters; Revenue, USD Million; 2018 - 2030)
        • Liquid Applied Membranes
          • Cementitious
          • Bituminous
          • Polyurethane
          • Acrylic
          • PMMA
          • Elastomeric
        • Sheet Membranes
          • Bituminous
          • Polyvinyl Chloride (PVC)
          • Ethylene Propylene Diene Monomer (EPDM)
          • Other
      • Europe Application Outlook (Volume, Million Square meters; Revenue, USD Million; 2018 - 2030)
        • Roofing
        • Walls
        • Building Structure
          • Commercial
          • Residential
        • Tunnel & Landfills
        • Other
      • Europe Construction Outlook (Volume, Million Square meters; Revenue, USD Million; 2018 - 2030)
        • New Construction
        • Refurbishment
      • Germany
        • Germany Raw Material Outlook (Volume, Million Square meters; Revenue, USD Million; 2018 - 2030)
          • Modified Bitumen
            • SBS
            • APP
          • PVC
          • EPDM
          • TPO
          • Acrylic
          • Polyurea
          • Polyurethane
          • PMMA
          • EVA
          • PE
            • HDPE
            • LDPE
        • Germany Product Outlook (Volume, Million Square meters; Revenue, USD Million; 2018 - 2030)
          • Liquid Applied Membranes
            • Cementitious
            • Bituminous
            • Polyurethane
            • Acrylic
            • PMMA
            • Elastomeric
          • Sheet Membranes
            • Bituminous
            • Polyvinyl Chloride (PVC)
            • Ethylene Propylene Diene Monomer (EPDM)
            • Other
        • Germany Application Outlook (Volume, Million Square meters; Revenue, USD Million; 2018 - 2030)
          • Roofing
          • Walls
          • Building Structure
            • Commercial
            • Residential
          • Tunnel & Landfills
          • Other
        • Germany Construction Outlook (Volume, Million Square meters; Revenue, USD Million; 2018 - 2030)
          • New Construction
          • Refurbishment
      • UK
        • UK Raw Material Outlook (Volume, Million Square meters; Revenue, USD Million; 2018 - 2030)
          • Modified Bitumen
            • SBS
            • APP
          • PVC
          • EPDM
          • TPO
          • Acrylic
          • Polyurea
          • Polyurethane
          • PMMA
          • EVA
          • PE
            • HDPE
            • LDPE
        • UK Product Outlook (Volume, Million Square meters; Revenue, USD Million; 2018 - 2030)
          • Liquid Applied Membranes
            • Cementitious
            • Bituminous
            • Polyurethane
            • Acrylic
            • PMMA
            • Elastomeric
          • Sheet Membranes
            • Bituminous
            • Polyvinyl Chloride (PVC)
            • Ethylene Propylene Diene Monomer (EPDM)
            • Other
        • UK Application Outlook (Volume, Million Square meters; Revenue, USD Million; 2018 - 2030)
          • Roofing
          • Walls
          • Building Structure
            • Commercial
            • Residential
          • Tunnel & Landfills
          • Other
        • UK Construction Outlook (Volume, Million Square meters; Revenue, USD Million; 2018 - 2030)
          • New Construction
          • Refurbishment
      • France
        • France Raw Material Outlook (Volume, Million Square meters; Revenue, USD Million; 2018 - 2030)
          • Modified Bitumen
            • SBS
            • APP
          • PVC
          • EPDM
          • TPO
          • Acrylic
          • Polyurea
          • Polyurethane
          • PMMA
          • EVA
          • PE
            • HDPE
            • LDPE
        • France Product Outlook (Volume, Million Square meters; Revenue, USD Million; 2018 - 2030)
          • Liquid Applied Membranes
            • Cementitious
            • Bituminous
            • Polyurethane
            • Acrylic
            • PMMA
            • Elastomeric
          • Sheet Membranes
            • Bituminous
            • Polyvinyl Chloride (PVC)
            • Ethylene Propylene Diene Monomer (EPDM)
            • Other
        • France Application Outlook (Volume, Million Square meters; Revenue, USD Million; 2018 - 2030)
          • Roofing
          • Walls
          • Building Structure
            • Commercial
            • Residential
          • Tunnel & Landfills
          • Other
        • France Construction Outlook (Volume, Million Square meters; Revenue, USD Million; 2018 - 2030)
          • New Construction
          • Refurbishment
      • Spain
        • Spain Raw Material Outlook (Volume, Million Square meters; Revenue, USD Million; 2018 - 2030)
          • Modified Bitumen
            • SBS
            • APP
          • PVC
          • EPDM
          • TPO
          • Acrylic
          • Polyurea
          • Polyurethane
          • PMMA
          • EVA
          • PE
            • HDPE
            • LDPE
        • Spain Product Outlook (Volume, Million Square meters; Revenue, USD Million; 2018 - 2030)
          • Liquid Applied Membranes
            • Cementitious
            • Bituminous
            • Polyurethane
            • Acrylic
            • PMMA
            • Elastomeric
          • Sheet Membranes
            • Bituminous
            • Polyvinyl Chloride (PVC)
            • Ethylene Propylene Diene Monomer (EPDM)
            • Other
        • Spain Application Outlook (Volume, Million Square meters; Revenue, USD Million; 2018 - 2030)
          • Roofing
          • Walls
          • Building Structure
            • Commercial
            • Residential
          • Tunnel & Landfills
          • Other
        • Spain Construction Outlook (Volume, Million Square meters; Revenue, USD Million; 2018 - 2030)
          • New Construction
          • Refurbishment
      • Russia
        • Russia Raw Material Outlook (Volume, Million Square meters; Revenue, USD Million; 2018 - 2030)
          • Modified Bitumen
            • SBS
            • APP
          • PVC
          • EPDM
          • TPO
          • Acrylic
          • Polyurea
          • Polyurethane
          • PMMA
          • EVA
          • PE
            • HDPE
            • LDPE
        • Russia Product Outlook (Volume, Million Square meters; Revenue, USD Million; 2018 - 2030)
          • Liquid Applied Membranes
            • Cementitious
            • Bituminous
            • Polyurethane
            • Acrylic
            • PMMA
            • Elastomeric
          • Sheet Membranes
            • Bituminous
            • Polyvinyl Chloride (PVC)
            • Ethylene Propylene Diene Monomer (EPDM)
            • Other
        • Russia Application Outlook (Volume, Million Square meters; Revenue, USD Million; 2018 - 2030)
          • Roofing
          • Walls
          • Building Structure
            • Commercial
            • Residential
          • Tunnel & Landfills
          • Other
        • Russia Construction Outlook (Volume, Million Square meters; Revenue, USD Million; 2018 - 2030)
          • New Construction
          • Refurbishment
      • The Netherlands
        • The Netherlands Raw Material Outlook (Volume, Million Square meters; Revenue, USD Million; 2018 - 2030)
          • Modified Bitumen
            • SBS
            • APP
          • PVC
          • EPDM
          • TPO
          • Acrylic
          • Polyurea
          • Polyurethane
          • PMMA
          • EVA
          • PE
            • HDPE
            • LDPE
        • The Netherlands Product Outlook (Volume, Million Square meters; Revenue, USD Million; 2018 - 2030)
          • Liquid Applied Membranes
            • Cementitious
            • Bituminous
            • Polyurethane
            • Acrylic
            • PMMA
            • Elastomeric
          • Sheet Membranes
            • Bituminous
            • Polyvinyl Chloride (PVC)
            • Ethylene Propylene Diene Monomer (EPDM)
            • Other
        • The Netherlands Application Outlook (Volume, Million Square meters; Revenue, USD Million; 2018 - 2030)
          • Roofing
          • Walls
          • Building Structure
            • Commercial
            • Residential
          • Tunnel & Landfills
          • Other
        • The Netherlands Construction Outlook (Volume, Million Square meters; Revenue, USD Million; 2018 - 2030)
          • New Construction
          • Refurbishment
    • Asia Pacific
      • Asia Pacific Raw Material Outlook (Volume, Million Square meters; Revenue, USD Million; 2018 - 2030)
        • Modified Bitumen
          • SBS
          • APP
        • PVC
        • EPDM
        • TPO
        • Acrylic
        • Polyurea
        • Polyurethane
        • PMMA
        • EVA
        • PE
          • HDPE
          • LDPE
      • Asia Pacific Product Outlook (Volume, Million Square meters; Revenue, USD Million; 2018 - 2030)
        • Liquid Applied Membranes
          • Cementitious
          • Bituminous
          • Polyurethane
          • Acrylic
          • PMMA
          • Elastomeric
        • Sheet Membranes
          • Bituminous
          • Polyvinyl Chloride (PVC)
          • Ethylene Propylene Diene Monomer (EPDM)
          • Other
      • Asia Pacific Application Outlook (Volume, Million Square meters; Revenue, USD Million; 2018 - 2030)
        • Roofing
        • Walls
        • Building Structure
          • Commercial
          • Residential
        • Tunnel & Landfills
        • Other
      • Asia Pacific Construction Outlook (Volume, Million Square meters; Revenue, USD Million; 2018 - 2030)
        • New Construction
        • Refurbishment
      • China
        • China Raw Material Outlook (Volume, Million Square meters; Revenue, USD Million; 2018 - 2030)
          • Modified Bitumen
            • SBS
            • APP
          • PVC
          • EPDM
          • TPO
          • Acrylic
          • Polyurea
          • Polyurethane
          • PMMA
          • EVA
          • PE
            • HDPE
            • LDPE
        • China Product Outlook (Volume, Million Square meters; Revenue, USD Million; 2018 - 2030)
          • Liquid Applied Membranes
            • Cementitious
            • Bituminous
            • Polyurethane
            • Acrylic
            • PMMA
            • Elastomeric
          • Sheet Membranes
            • Bituminous
            • Polyvinyl Chloride (PVC)
            • Ethylene Propylene Diene Monomer (EPDM)
            • Other
        • China Application Outlook (Volume, Million Square meters; Revenue, USD Million; 2018 - 2030)
          • Roofing
          • Walls
          • Building Structure
            • Commercial
            • Residential
          • Tunnel & Landfills
          • Other
        • China Construction Outlook (Volume, Million Square meters; Revenue, USD Million; 2018 - 2030)
          • New Construction
          • Refurbishment
      • Japan
        • Japan Raw Material Outlook (Volume, Million Square meters; Revenue, USD Million; 2018 - 2030)
          • Modified Bitumen
            • SBS
            • APP
          • PVC
          • EPDM
          • TPO
          • Acrylic
          • Polyurea
          • Polyurethane
          • PMMA
          • EVA
          • PE
            • HDPE
            • LDPE
        • Japan Product Outlook (Volume, Million Square meters; Revenue, USD Million; 2018 - 2030)
          • Liquid Applied Membranes
            • Cementitious
            • Bituminous
            • Polyurethane
            • Acrylic
            • PMMA
            • Elastomeric
          • Sheet Membranes
            • Bituminous
            • Polyvinyl Chloride (PVC)
            • Ethylene Propylene Diene Monomer (EPDM)
            • Other
        • Japan Application Outlook (Volume, Million Square meters; Revenue, USD Million; 2018 - 2030)
          • Roofing
          • Walls
          • Building Structure
            • Commercial
            • Residential
          • Tunnel & Landfills
          • Other
        • Japan Construction Outlook (Volume, Million Square meters; Revenue, USD Million; 2018 - 2030)
          • New Construction
          • Refurbishment
      • India
        • India Raw Material Outlook (Volume, Million Square meters; Revenue, USD Million; 2018 - 2030)
          • Modified Bitumen
            • SBS
            • APP
          • PVC
          • EPDM
          • TPO
          • Acrylic
          • Polyurea
          • Polyurethane
          • PMMA
          • EVA
          • PE
            • HDPE
            • LDPE
        • India Product Outlook (Volume, Million Square meters; Revenue, USD Million; 2018 - 2030)
          • Liquid Applied Membranes
            • Cementitious
            • Bituminous
            • Polyurethane
            • Acrylic
            • PMMA
            • Elastomeric
          • Sheet Membranes
            • Bituminous
            • Polyvinyl Chloride (PVC)
            • Ethylene Propylene Diene Monomer (EPDM)
            • Other
        • India Application Outlook (Volume, Million Square meters; Revenue, USD Million; 2018 - 2030)
          • Roofing
          • Walls
          • Building Structure
            • Commercial
            • Residential
          • Tunnel & Landfills
          • Other
        • India Construction Outlook (Volume, Million Square meters; Revenue, USD Million; 2018 - 2030)
          • New Construction
          • Refurbishment
      • South Korea
        • South Korea Raw Material Outlook (Volume, Million Square meters; Revenue, USD Million; 2018 - 2030)
          • Modified Bitumen
            • SBS
            • APP
          • PVC
          • EPDM
          • TPO
          • Acrylic
          • Polyurea
          • Polyurethane
          • PMMA
          • EVA
          • PE
            • HDPE
            • LDPE
        • South Korea Product Outlook (Volume, Million Square meters; Revenue, USD Million; 2018 - 2030)
          • Liquid Applied Membranes
            • Cementitious
            • Bituminous
            • Polyurethane
            • Acrylic
            • PMMA
            • Elastomeric
          • Sheet Membranes
            • Bituminous
            • Polyvinyl Chloride (PVC)
            • Ethylene Propylene Diene Monomer (EPDM)
            • Other
        • South Korea Application Outlook (Volume, Million Square meters; Revenue, USD Million; 2018 - 2030)
          • Roofing
          • Walls
          • Building Structure
            • Commercial
            • Residential
          • Tunnel & Landfills
          • Other
        • South Korea Construction Outlook (Volume, Million Square meters; Revenue, USD Million; 2018 - 2030)
          • New Construction
          • Refurbishment
      • Singapore
        • Singapore Raw Material Outlook (Volume, Million Square meters; Revenue, USD Million; 2018 - 2030)
          • Modified Bitumen
            • SBS
            • APP
          • PVC
          • EPDM
          • TPO
          • Acrylic
          • Polyurea
          • Polyurethane
          • PMMA
          • EVA
          • PE
            • HDPE
            • LDPE
        • Singapore Product Outlook (Volume, Million Square meters; Revenue, USD Million; 2018 - 2030)
          • Liquid Applied Membranes
            • Cementitious
            • Bituminous
            • Polyurethane
            • Acrylic
            • PMMA
            • Elastomeric
          • Sheet Membranes
            • Bituminous
            • Polyvinyl Chloride (PVC)
            • Ethylene Propylene Diene Monomer (EPDM)
            • Other
        • Singapore Application Outlook (Volume, Million Square meters; Revenue, USD Million; 2018 - 2030)
          • Roofing
          • Walls
          • Building Structure
            • Commercial
            • Residential
          • Tunnel & Landfills
          • Other
        • Singapore Construction Outlook (Volume, Million Square meters; Revenue, USD Million; 2018 - 2030)
          • New Construction
          • Refurbishment
      • Philippines
        • Philippines Raw Material Outlook (Volume, Million Square meters; Revenue, USD Million; 2018 - 2030)
          • Modified Bitumen
            • SBS
            • APP
          • PVC
          • EPDM
          • TPO
          • Acrylic
          • Polyurea
          • Polyurethane
          • PMMA
          • EVA
          • PE
            • HDPE
            • LDPE
        • Philippines Product Outlook (Volume, Million Square meters; Revenue, USD Million; 2018 - 2030)
          • Liquid Applied Membranes
            • Cementitious
            • Bituminous
            • Polyurethane
            • Acrylic
            • PMMA
            • Elastomeric
          • Sheet Membranes
            • Bituminous
            • Polyvinyl Chloride (PVC)
            • Ethylene Propylene Diene Monomer (EPDM)
            • Other
        • Philippines Application Outlook (Volume, Million Square meters; Revenue, USD Million; 2018 - 2030)
          • Roofing
          • Walls
          • Building Structure
            • Commercial
            • Residential
          • Tunnel & Landfills
          • Other
        • Philippines Construction Outlook (Volume, Million Square meters; Revenue, USD Million; 2018 - 2030)
          • New Construction
          • Refurbishment
      • Australia
        • Australia Raw Material Outlook (Volume, Million Square meters; Revenue, USD Million; 2018 - 2030)
          • Modified Bitumen
            • SBS
            • APP
          • PVC
          • EPDM
          • TPO
          • Acrylic
          • Polyurea
          • Polyurethane
          • PMMA
          • EVA
          • PE
            • HDPE
            • LDPE
        • Australia Product Outlook (Volume, Million Square meters; Revenue, USD Million; 2018 - 2030)
          • Liquid Applied Membranes
            • Cementitious
            • Bituminous
            • Polyurethane
            • Acrylic
            • PMMA
            • Elastomeric
          • Sheet Membranes
            • Bituminous
            • Polyvinyl Chloride (PVC)
            • Ethylene Propylene Diene Monomer (EPDM)
            • Other
        • Australia Application Outlook (Volume, Million Square meters; Revenue, USD Million; 2018 - 2030)
          • Roofing
          • Walls
          • Building Structure
            • Commercial
            • Residential
          • Tunnel & Landfills
          • Other
        • Australia Construction Outlook (Volume, Million Square meters; Revenue, USD Million; 2018 - 2030)
          • New Construction
          • Refurbishment
      • Malaysia
        • Malaysia Raw Material Outlook (Volume, Million Square meters; Revenue, USD Million; 2018 - 2030)
          • Modified Bitumen
            • SBS
            • APP
          • PVC
          • EPDM
          • TPO
          • Acrylic
          • Polyurea
          • Polyurethane
          • PMMA
          • EVA
          • PE
            • HDPE
            • LDPE
        • Malaysia Product Outlook (Volume, Million Square meters; Revenue, USD Million; 2018 - 2030)
          • Liquid Applied Membranes
            • Cementitious
            • Bituminous
            • Polyurethane
            • Acrylic
            • PMMA
            • Elastomeric
          • Sheet Membranes
            • Bituminous
            • Polyvinyl Chloride (PVC)
            • Ethylene Propylene Diene Monomer (EPDM)
            • Other
        • Malaysia Application Outlook (Volume, Million Square meters; Revenue, USD Million; 2018 - 2030)
          • Roofing
          • Walls
          • Building Structure
            • Commercial
            • Residential
          • Tunnel & Landfills
          • Other
        • Malaysia Construction Outlook (Volume, Million Square meters; Revenue, USD Million; 2018 - 2030)
          • New Construction
          • Refurbishment
      • Indonesia
        • Indonesia Raw Material Outlook (Volume, Million Square meters; Revenue, USD Million; 2018 - 2030)
          • Modified Bitumen
            • SBS
            • APP
          • PVC
          • EPDM
          • TPO
          • Acrylic
          • Polyurea
          • Polyurethane
          • PMMA
          • EVA
          • PE
            • HDPE
            • LDPE
        • Indonesia Product Outlook (Volume, Million Square meters; Revenue, USD Million; 2018 - 2030)
          • Liquid Applied Membranes
            • Cementitious
            • Bituminous
            • Polyurethane
            • Acrylic
            • PMMA
            • Elastomeric
          • Sheet Membranes
            • Bituminous
            • Polyvinyl Chloride (PVC)
            • Ethylene Propylene Diene Monomer (EPDM)
            • Other
        • Indonesia Application Outlook (Volume, Million Square meters; Revenue, USD Million; 2018 - 2030)
          • Roofing
          • Walls
          • Building Structure
            • Commercial
            • Residential
          • Tunnel & Landfills
          • Other
        • Indonesia Construction Outlook (Volume, Million Square meters; Revenue, USD Million; 2018 - 2030)
          • New Construction
          • Refurbishment
      • Thailand
        • Thailand Raw Material Outlook (Volume, Million Square meters; Revenue, USD Million; 2018 - 2030)
          • Modified Bitumen
            • SBS
            • APP
          • PVC
          • EPDM
          • TPO
          • Acrylic
          • Polyurea
          • Polyurethane
          • PMMA
          • EVA
          • PE
            • HDPE
            • LDPE
        • Thailand Product Outlook (Volume, Million Square meters; Revenue, USD Million; 2018 - 2030)
          • Liquid Applied Membranes
            • Cementitious
            • Bituminous
            • Polyurethane
            • Acrylic
            • PMMA
            • Elastomeric
          • Sheet Membranes
            • Bituminous
            • Polyvinyl Chloride (PVC)
            • Ethylene Propylene Diene Monomer (EPDM)
            • Other
        • Thailand Application Outlook (Volume, Million Square meters; Revenue, USD Million; 2018 - 2030)
          • Roofing
          • Walls
          • Building Structure
            • Commercial
            • Residential
          • Tunnel & Landfills
          • Other
        • Thailand Construction Outlook (Volume, Million Square meters; Revenue, USD Million; 2018 - 2030)
          • New Construction
          • Refurbishment
      • Vietnam
        • Vietnam Raw Material Outlook (Volume, Million Square meters; Revenue, USD Million; 2018 - 2030)
          • Modified Bitumen
            • SBS
            • APP
          • PVC
          • EPDM
          • TPO
          • Acrylic
          • Polyurea
          • Polyurethane
          • PMMA
          • EVA
          • PE
            • HDPE
            • LDPE
        • Vietnam Product Outlook (Volume, Million Square meters; Revenue, USD Million; 2018 - 2030)
          • Liquid Applied Membranes
            • Cementitious
            • Bituminous
            • Polyurethane
            • Acrylic
            • PMMA
            • Elastomeric
          • Sheet Membranes
            • Bituminous
            • Polyvinyl Chloride (PVC)
            • Ethylene Propylene Diene Monomer (EPDM)
            • Other
        • Vietnam Application Outlook (Volume, Million Square meters; Revenue, USD Million; 2018 - 2030)
          • Roofing
          • Walls
          • Building Structure
            • Commercial
            • Residential
          • Tunnel & Landfills
          • Other
        • Vietnam Construction Outlook (Volume, Million Square meters; Revenue, USD Million; 2018 - 2030)
          • New Construction
          • Refurbishment
    • Central & South America
      • Central & South America Raw Material Outlook (Volume, Million Square meters; Revenue, USD Million; 2018 - 2030)
        • Modified Bitumen
          • SBS
          • APP
        • PVC
        • EPDM
        • TPO
        • Acrylic
        • Polyurea
        • Polyurethane
        • PMMA
        • EVA
        • PE
          • HDPE
          • LDPE
      • Central & South America Product Outlook (Volume, Million Square meters; Revenue, USD Million; 2018 - 2030)
        • Liquid Applied Membranes
          • Cementitious
          • Bituminous
          • Polyurethane
          • Acrylic
          • PMMA
          • Elastomeric
        • Sheet Membranes
          • Bituminous
          • Polyvinyl Chloride (PVC)
          • Ethylene Propylene Diene Monomer (EPDM)
          • Other
      • Central & South America Application Outlook (Volume, Million Square meters; Revenue, USD Million; 2018 - 2030)
        • Roofing
        • Walls
        • Building Structure
          • Commercial
          • Residential
        • Tunnel & Landfills
        • Other
      • Central & South America Construction Outlook (Volume, Million Square meters; Revenue, USD Million; 2018 - 2030)
        • New Construction
        • Refurbishment
      • Brazil
        • Brazil Raw Material Outlook (Volume, Million Square meters; Revenue, USD Million; 2018 - 2030)
          • Modified Bitumen
            • SBS
            • APP
          • PVC
          • EPDM
          • TPO
          • Acrylic
          • Polyurea
          • Polyurethane
          • PMMA
          • EVA
          • PE
            • HDPE
            • LDPE
        • Brazil Product Outlook (Volume, Million Square meters; Revenue, USD Million; 2018 - 2030)
          • Liquid Applied Membranes
            • Cementitious
            • Bituminous
            • Polyurethane
            • Acrylic
            • PMMA
            • Elastomeric
          • Sheet Membranes
            • Bituminous
            • Polyvinyl Chloride (PVC)
            • Ethylene Propylene Diene Monomer (EPDM)
            • Other
        • Brazil Application Outlook (Volume, Million Square meters; Revenue, USD Million; 2018 - 2030)
          • Roofing
          • Walls
          • Building Structure
            • Commercial
            • Residential
          • Tunnel & Landfills
          • Other
        • Brazil Construction Outlook (Volume, Million Square meters; Revenue, USD Million; 2018 - 2030)
          • New Construction
          • Refurbishment
      • Argentina
        • Argentina Raw Material Outlook (Volume, Million Square meters; Revenue, USD Million; 2018 - 2030)
          • Modified Bitumen
            • SBS
            • APP
          • PVC
          • EPDM
          • TPO
          • Acrylic
          • Polyurea
          • Polyurethane
          • PMMA
          • EVA
          • PE
            • HDPE
            • LDPE
        • Argentina Product Outlook (Volume, Million Square meters; Revenue, USD Million; 2018 - 2030)
          • Liquid Applied Membranes
            • Cementitious
            • Bituminous
            • Polyurethane
            • Acrylic
            • PMMA
            • Elastomeric
          • Sheet Membranes
            • Bituminous
            • Polyvinyl Chloride (PVC)
            • Ethylene Propylene Diene Monomer (EPDM)
            • Other
        • Argentina Application Outlook (Volume, Million Square meters; Revenue, USD Million; 2018 - 2030)
          • Roofing
          • Walls
          • Building Structure
            • Commercial
            • Residential
          • Tunnel & Landfills
          • Other
        • Argentina Construction Outlook (Volume, Million Square meters; Revenue, USD Million; 2018 - 2030)
          • New Construction
          • Refurbishment
      • Chile
        • Chile Raw Material Outlook (Volume, Million Square meters; Revenue, USD Million; 2018 - 2030)
          • Modified Bitumen
            • SBS
            • APP
          • PVC
          • EPDM
          • TPO
          • Acrylic
          • Polyurea
          • Polyurethane
          • PMMA
          • EVA
          • PE
            • HDPE
            • LDPE
        • Chile Product Outlook (Volume, Million Square meters; Revenue, USD Million; 2018 - 2030)
          • Liquid Applied Membranes
            • Cementitious
            • Bituminous
            • Polyurethane
            • Acrylic
            • PMMA
            • Elastomeric
          • Sheet Membranes
            • Bituminous
            • Polyvinyl Chloride (PVC)
            • Ethylene Propylene Diene Monomer (EPDM)
            • Other
        • Chile Application Outlook (Volume, Million Square meters; Revenue, USD Million; 2018 - 2030)
          • Roofing
          • Walls
          • Building Structure
            • Commercial
            • Residential
          • Tunnel & Landfills
          • Other
        • Chile Construction Outlook (Volume, Million Square meters; Revenue, USD Million; 2018 - 2030)
          • New Construction
          • Refurbishment
    • Middle East & Africa
      • Middle East & Africa Raw Material Outlook (Volume, Million Square meters; Revenue, USD Million; 2018 - 2030)
        • Modified Bitumen
          • SBS
          • APP
        • PVC
        • EPDM
        • TPO
        • Acrylic
        • Polyurea
        • Polyurethane
        • PMMA
        • EVA
        • PE
          • HDPE
          • LDPE
      • Middle East & Africa Product Outlook (Volume, Million Square meters; Revenue, USD Million; 2018 - 2030)
        • Liquid Applied Membranes
          • Cementitious
          • Bituminous
          • Polyurethane
          • Acrylic
          • PMMA
          • Elastomeric
        • Sheet Membranes
          • Bituminous
          • Polyvinyl Chloride (PVC)
          • Ethylene Propylene Diene Monomer (EPDM)
          • Other
      • Middle East & Africa Application Outlook (Volume, Million Square meters; Revenue, USD Million; 2018 - 2030)
        • Roofing
        • Walls
        • Building Structure
          • Commercial
          • Residential
        • Tunnel & Landfills
        • Other
      • Middle East & Africa Construction Outlook (Volume, Million Square meters; Revenue, USD Million; 2018 - 2030)
        • New Construction
        • Refurbishment
      • Saudi Arabia
        • Saudi Arabia Raw Material Outlook (Volume, Million Square meters; Revenue, USD Million; 2018 - 2030)
          • Modified Bitumen
            • SBS
            • APP
          • PVC
          • EPDM
          • TPO
          • Acrylic
          • Polyurea
          • Polyurethane
          • PMMA
          • EVA
          • PE
            • HDPE
            • LDPE
        • Saudi Arabia Product Outlook (Volume, Million Square meters; Revenue, USD Million; 2018 - 2030)
          • Liquid Applied Membranes
            • Cementitious
            • Bituminous
            • Polyurethane
            • Acrylic
            • PMMA
            • Elastomeric
          • Sheet Membranes
            • Bituminous
            • Polyvinyl Chloride (PVC)
            • Ethylene Propylene Diene Monomer (EPDM)
            • Other
        • Saudi Arabia Application Outlook (Volume, Million Square meters; Revenue, USD Million; 2018 - 2030)
          • Roofing
          • Walls
          • Building Structure
            • Commercial
            • Residential
          • Tunnel & Landfills
          • Other
        • Saudi Arabia Construction Outlook (Volume, Million Square meters; Revenue, USD Million; 2018 - 2030)
          • New Construction
          • Refurbishment
      • UAE
        • UAE Raw Material Outlook (Volume, Million Square meters; Revenue, USD Million; 2018 - 2030)
          • Modified Bitumen
            • SBS
            • APP
          • PVC
          • EPDM
          • TPO
          • Acrylic
          • Polyurea
          • Polyurethane
          • PMMA
          • EVA
          • PE
            • HDPE
            • LDPE
        • UAE Product Outlook (Volume, Million Square meters; Revenue, USD Million; 2018 - 2030)
          • Liquid Applied Membranes
            • Cementitious
            • Bituminous
            • Polyurethane
            • Acrylic
            • PMMA
            • Elastomeric
          • Sheet Membranes
            • Bituminous
            • Polyvinyl Chloride (PVC)
            • Ethylene Propylene Diene Monomer (EPDM)
            • Other
        • UAE Application Outlook (Volume, Million Square meters; Revenue, USD Million; 2018 - 2030)
          • Roofing
          • Walls
          • Building Structure
            • Commercial
            • Residential
          • Tunnel & Landfills
          • Other
        • UAE Construction Outlook (Volume, Million Square meters; Revenue, USD Million; 2018 - 2030)
          • New Construction
          • Refurbishment
      • Bahrain
        • Bahrain Raw Material Outlook (Volume, Million Square meters; Revenue, USD Million; 2018 - 2030)
          • Modified Bitumen
            • SBS
            • APP
          • PVC
          • EPDM
          • TPO
          • Acrylic
          • Polyurea
          • Polyurethane
          • PMMA
          • EVA
          • PE
            • HDPE
            • LDPE
        • Bahrain Product Outlook (Volume, Million Square meters; Revenue, USD Million; 2018 - 2030)
          • Liquid Applied Membranes
            • Cementitious
            • Bituminous
            • Polyurethane
            • Acrylic
            • PMMA
            • Elastomeric
          • Sheet Membranes
            • Bituminous
            • Polyvinyl Chloride (PVC)
            • Ethylene Propylene Diene Monomer (EPDM)
            • Other
        • Bahrain Application Outlook (Volume, Million Square meters; Revenue, USD Million; 2018 - 2030)
          • Roofing
          • Walls
          • Building Structure
            • Commercial
            • Residential
          • Tunnel & Landfills
          • Other
        • Bahrain Construction Outlook (Volume, Million Square meters; Revenue, USD Million; 2018 - 2030)
          • New Construction
          • Refurbishment
      • Qatar
        • Qatar Raw Material Outlook (Volume, Million Square meters; Revenue, USD Million; 2018 - 2030)
          • Modified Bitumen
            • SBS
            • APP
          • PVC
          • EPDM
          • TPO
          • Acrylic
          • Polyurea
          • Polyurethane
          • PMMA
          • EVA
          • PE
            • HDPE
            • LDPE
        • Qatar Product Outlook (Volume, Million Square meters; Revenue, USD Million; 2018 - 2030)
          • Liquid Applied Membranes
            • Cementitious
            • Bituminous
            • Polyurethane
            • Acrylic
            • PMMA
            • Elastomeric
          • Sheet Membranes
            • Bituminous
            • Polyvinyl Chloride (PVC)
            • Ethylene Propylene Diene Monomer (EPDM)
            • Other
        • Qatar Application Outlook (Volume, Million Square meters; Revenue, USD Million; 2018 - 2030)
          • Roofing
          • Walls
          • Building Structure
            • Commercial
            • Residential
          • Tunnel & Landfills
          • Other
        • Qatar Construction Outlook (Volume, Million Square meters; Revenue, USD Million; 2018 - 2030)
          • New Construction
          • Refurbishment
      • South Africa
        • South Africa Raw Material Outlook (Volume, Million Square meters; Revenue, USD Million; 2018 - 2030)
          • Modified Bitumen
            • SBS
            • APP
          • PVC
          • EPDM
          • TPO
          • Acrylic
          • Polyurea
          • Polyurethane
          • PMMA
          • EVA
          • PE
            • HDPE
            • LDPE
        • South Africa Product Outlook (Volume, Million Square meters; Revenue, USD Million; 2018 - 2030)
          • Liquid Applied Membranes
            • Cementitious
            • Bituminous
            • Polyurethane
            • Acrylic
            • PMMA
            • Elastomeric
          • Sheet Membranes
            • Bituminous
            • Polyvinyl Chloride (PVC)
            • Ethylene Propylene Diene Monomer (EPDM)
            • Other
        • South Africa Application Outlook (Volume, Million Square meters; Revenue, USD Million; 2018 - 2030)
          • Roofing
          • Walls
          • Building Structure
            • Commercial
            • Residential
          • Tunnel & Landfills
          • Other
        • South Africa Construction Outlook (Volume, Million Square meters; Revenue, USD Million; 2018 - 2030)
          • New Construction
          • Refurbishment

Waterproofing Membranes Market Dynamics

Drivers: Growing Construction Industry

The Asia Pacific region is projected to see a rise in construction expenditure over the forecast period, driven by rapid urbanization and population growth. The capital project and infrastructure market in this region is anticipated to grow annually by 7.0% to 8.0% over the next decade, reaching nearly USD 5,300 billion by 2025, which would constitute almost 60.0% of the global market. The growth of the market is expected to be fueled by upcoming airport construction projects by CAPA in Asia, as well as the development of new construction and building projects in the region. The construction sector in China and India is predicted to experience significant growth due to increasing disposable income and government expenditure on large infrastructure projects. In 2011, the initiation of the 12th Five-Year Plan by the Civil Aviation Administration of China (CAAC) led to the construction of 56 new airports and the expansion of 16 existing ones, with a total investment of approximately USD 68.5 billion, thereby stimulating the construction sector in the country. The ongoing demand in China for industrial, residential, and infrastructure expansion has created the need for new construction projects.

Growing Water And Waste Management Industry

The irregular patterns of water precipitation, both in terms of location and time, necessitate the need for enhanced water conservation, transportation, and treatment measures. The water and waste management industry heavily relies on waterproofing membranes. China, in the Asia Pacific region, is the primary user of these membranes for waste management. The Asia Pacific region has seen a surge in industrial activities and waste production due to rapid urbanization and the relocation of industries to this area. This trend is expected to lead to significant investments in waste recycling and services, thereby increasing the demand for waterproofing membranes. Waterproof membranes, due to their cost-effectiveness and flexibility, present substantial market opportunities, making them an ideal choice for use in water and waste management systems. The developing markets in the Asia Pacific and Europe are projected to contribute to nearly half of the global revenues in the waste and water management industry, further boosting the demand for waterproofing membranes.

Restrains: Bitumen Price Volatility

Bitumen and polypropylene, derived from crude oil, are essential in the production of waterproofing membranes. The cost of these raw materials is influenced by fluctuations in crude oil prices, which in turn affects the usage of waterproofing membranes. In addition, fluctuating reseller margins coupled with raw material scarcity contribute to the price escalation of these raw materials. The wide supply-demand imbalance, especially for bitumen due to its diverse applications, also contributes to raw material price volatility. Refinery economics and bitumen production alternatives further add to these fluctuations. Consequently, sudden shifts in raw material prices have escalated production costs and widened the demand-supply gap for waterproof membranes in recent years. These factors have been obstacles to the overall growth of the waterproof membranes market. 

What Does This Report Include?

This section will provide insights into the contents included in this waterproofing membranes market report and help gain clarity on the structure of the report to assist readers in navigating smoothly.

Waterproofing membranes market qualitative analysis

  • Industry overview

  • Industry trends

  • Market drivers and restraints

  • Market size

  • Growth prospects

  • Porter’s analysis

  • PESTEL analysis

  • Key market opportunities prioritized

  • Competitive landscape

    • Company overview

    • Financial performance

    • Product benchmarking

    • Latest strategic developments

Waterproofing membranes market quantitative analysis

  • Market size, estimates, and forecast from 2018 to 2030

  • Market estimates and forecast for product segments up to 2030

  • Regional market size and forecast for product segments up to 2030

  • Market estimates and forecast for application segments up to 2030

  • Regional market size and forecast for application segments up to 2030

  • Company financial performance

What questions do you have? Get quick response from our industry experts. Request a Free Consultation

Research Methodology

A three-pronged approach was followed for deducing the waterproofing membranes market estimates and forecasts. The process has three steps: information procurement, analysis, and validation. The whole process is cyclical, and steps repeat until the estimates are validated. The three steps are explained in detail below:

Information procurement: Information procurement is one of the most extensive and important stages in our research process, and quality data is critical for accurate analysis. We followed a multi-channel data collection process for waterproofing membranes market to gather the most reliable and current information possible.

  • We buy access to paid databases such as Hoover’s and Factiva for company financials, industry information, white papers, industry journals, SME journals, and more.
  • We tap into Grand View’s proprietary database of data points and insights from active and archived monitoring and reporting.
  • We conduct primary research with industry experts through questionnaires and one-on-one phone interviews.
  • We pull from reliable secondary sources such as white papers and government statistics, published by organizations like WHO, NGOs, World Bank, etc., Key Opinion Leaders (KoL) publications, company filings, investor documents, and more.
  • We purchase and review investor analyst reports, broker reports, academic commentary, government quotes, and wealth management publications for insightful third-party perspectives.

Analysis: We mine the data collected to establish baselines for forecasting, identify trends and opportunities, gain insight into consumer demographics and drivers, and so much more. We utilized different methods of waterproofing membranes market data depending on the type of information we’re trying to uncover in our research.

  • Market Research Efforts: Bottom-up Approach for estimating and forecasting demand size and opportunity, top-down Approach for new product forecasting and penetration, and combined approach of both Bottom-up and Top-down for full coverage analysis.

  • Value-Chain-Based Sizing & Forecasting: Supply-side estimates for understanding potential revenue through competitive benchmarking, forecasting, and penetration modeling.

  • Demand-side estimates for identifying parent and ancillary markets, segment modeling, and heuristic forecasting.

  • Qualitative Functional Deployment (QFD) Modelling for market share assessment.

Market formulation and validation: We mine the data collected to establish baselines for forecasting, identify trends and opportunities, gain insight into consumer demographics and drivers, and so much more. We utilize different methods of data analysis depending on the type of information we’re trying to uncover in our research.

  • Market Formulation: This step involves the finalization of market numbers. This step on an internal level is designed to manage outputs from the Data Analysis step.

  • Data Normalization: The final market estimates and forecasts are then aligned and sent to industry experts, in-panel quality control managers for validation.

  • This step also entails the finalization of the report scope and data representation pattern.

  • Validation: The process entails multiple levels of validation. All these steps run in parallel, and the study is forwarded for publishing only if all three levels render validated results.

Waterproofing Membranes Market Categorization:

The waterproofing membranes market was categorized into three segments, namely product (Liquid Applied Membranes, Sheet Membranes), application (Roofing, Walls, Building Structure, Tunnel & Landfills), regions (North America, Europe, Asia Pacific, Central & South America, Middle East & Africa).

Segment Market Methodology:

The waterproofing membranes market was segmented into product, application, and regions. The demand at a segment level was deduced using a funnel method. Concepts like the TAM, SAM, SOM, etc., were put into practice to understand the demand. We at GVR deploy three methods to deduce market estimates and determine forecasts. These methods are explained below:

Market research approaches: Bottom-up

  • Demand estimation of each product across countries/regions summed up to from the total market.

  • Variable analysis for demand forecast.

  • Demand estimation via analyzing paid database, and company financials either via annual reports or paid database.

  • Primary interviews for data revalidation and insight collection.

Market research approaches: Top-down

  • Used extensively for new product forecasting or analyzing penetration levels.

  • Tool used invoice product flow and penetration models Use of regression multi-variant analysis for forecasting Involves extensive use of paid and public databases.

  • Primary interviews and vendor-based primary research for variable impact analysis.

Market research approaches: Combined

  • This is the most common method. We apply concepts from both the top-down and bottom-up approaches to arrive at a viable conclusion.

Regional Market Methodology:

The waterproofing membranes market was analyzed at a regional level. The globe was divided into North America, Europe, Asia Pacific, Central & South America, Middle East & Africa, keeping in focus variables like consumption patterns, export-import regulations, consumer expectations, etc. These regions were further divided into eight countries, namely, the U.S.; Canada; Mexico; Germany; the UK; China; Japan; Brazil.

All three above-mentioned market research methodologies were applied to arrive at regional-level conclusions. The regions were then summed up to form the global market.

Waterproofing membranes market companies & financials:

The waterproofing membranes market was analyzed via companies operating in the sector. Analyzing these companies and cross-referencing them to the demand equation helped us validate our assumptions and conclusions. Key market players analyzed include:

  • Sika AG - Established in 1910, Sika AG, a specialty chemical manufacturing company, is based in Baar, Switzerland. The company specializes in the production and supply of products used for sealing, bonding, reinforcing, damping, and protecting concrete structures and motor vehicles. As of December 2020, it had a global workforce of 24,848 employees. The business model of the Sika Group includes the manufacture and distribution of waterproofing membrane systems, made of either TPO or PVC sheets. These systems are used in various structures like tunnels, concrete buildings, water storage tanks, balconies, wet rooms, and swimming pools. In 2009, Sika AG acquired Lotech Group, a company based in England with subsidiaries in the UK, the U.S., and Belgium. Lotech specializes in the production and formulation of polyurethane liquid membranes and intermediates, primarily supplied to the refurbishment market for small to medium-sized roofs. This acquisition allowed Sika to expand its technology and establish a market position in polyurethane membranes for roofing applications. Besides liquid membranes, Lotech also formulates, produces, and supplies hygienic wall coatings for various applications.

  • Pidilite Industries Ltd. - Pidilite Industries Limited, founded in 1959 and based in Mumbai, India, manufactures and distributes consumer and specialty chemicals. Its product range includes adhesives & sealants, automotive chemicals, construction & paint chemicals, art materials, industrial & textile resins, industrial adhesives, and organic pigments & preparations. Its brand, Dr. Fixit, offers waterproofing membranes used predominantly in construction projects.

  • BASF SE - BASF SE, a company that manufactures and distributes chemicals for a variety of applications, was founded in 1865 and is based in Ludwigshafen, Germany. With 390 production sites spread across Europe, Asia, North America, Latin America, Africa, and Australia, it produces industrial chemicals for seven different business segments, serving a broad consumer base. The business segments of the company include chemicals, performance products, plastics, functional materials & solutions, biotechnology, oil & gas exploration, and agricultural solutions. Under its functional materials and solutions category, specifically the construction chemical department, BASF SE manufactures a waterproofing membrane system marketed as MasterSeal 6100 FX. In 2018, the company had over 110,302 employees. Through its subsidiary, BASF Polyurethane, the company manufactures polyurethane for various applications. Its comprehensive polyurethane portfolio includes polyols, polyether, TDI, MDI, and specialty elastomers.

  • Paul Bauder GmbH & Co. KG - Paul Bauder GmbH & Co. KG, founded in 1857 and based in Stuttgart, Germany, manufactures rooftop waterproofing systems. It has additional manufacturing and distribution facilities in Achim, Bernsdorf, Bochum, Landsberg/Halle, and Schwepnitz, and subsidiaries in 13 European countries. Its product portfolio includes reinforced bitumen membrane systems, single-ply systems, structural waterproofing, and cold liquid applied systems.

  • Kemper System America, Inc. - Founded in 1990 and based in New York, U.S., Kemper System America, Inc. specializes in the production of waterproofing, roofing, and surfacing systems. These systems are widely used in various applications such as plazas, new and existing roofs, green roofs, fountains, planters, metal roofs, flashings, gutter-ways, balconies, terraces, industrial and interior applications, and below-grade waterproofing. The company’s extensive product range includes Kemperol 2K-PUR, Kemperol V210, Kemperol BR/BRM, Kemperol AC, Kemperol 022, Kemperdur TC, and COELAN Systems. Kemper System America, Inc. operates as a subsidiary of Kemper System GmbH & Co. KG, which is part of the IBG Group located in Cologne, Germany.

  • DuPont de Nemours, Inc. - In April 2019, DuPont de Nemours, Inc. was formed following its separation from DowDuPont, Inc. The split resulted in three distinct entities focusing on specialty products (DuPont), material sciences (Dow, Inc.), and agricultural businesses (Corteva, Inc.). Headquartered in Wilmington, Delaware, U.S., DuPont operates four business segments. The Electronics & Imaging segment provides solutions for industries such as circuit board, semiconductor, display, and digital, industrial, and flexographic printing, with brands like Cyrel, Kapton, and IKONIC. The Transportation & Advanced Polymers segment offers engineering resins, lubricants, and adhesives for various applications including automotive, aerospace, and medical devices. The Nutrition & Biosciences segment primarily serves the beverage, food, pharmaceutical, and dietary supplements industries with products like ingredients, stabilizers, and probiotics. Lastly, the Safety & Construction segment offers a variety of products including high-performance foams, fibers, non-woven structures, aramid papers, and protective garments, waterproofing membranes, operating under major brands like Nomex, Kevlar, Tyvek, Corian, and Styrofoam.

  • GAF Materials Corporation - Founded in 1886, GAF Materials Corporation, with its headquarters in New Jersey, U.S., specializes in the production of roofing systems for both commercial and residential use. The company boasts a workforce of over 3,000 employees, operating out of its manufacturing and sales facilities located in Florida, California, North Carolina, Illinois, Texas, and Pennsylvania. The company’s business model is comprehensive, offering solutions in various areas of roofing such as single-ply roofing, liquid applied roofing, modified bitumen roofing, built-up roofing (BUR), and specialty roofing. A key focus for GAF Materials Corporation is the expansion of its business in the manufacturing of PVC & TPO single-ply roofing systems, and ISO insulation materials. This focus underscores the company’s commitment to innovation and quality in the roofing industry.

  • Johns Manville - Johns Manville, founded in 1858 and based in Colorado, U.S., is a leading manufacturer and marketer of high-quality building insulation, mechanical insulation, commercial roofing, roof insulation, and fibers and nonwovens. These products cater to commercial, industrial, and residential applications. The company serves a diverse range of markets, including aerospace, automotive/transportation, appliance, commercial/residential construction, HVAC, pipe and equipment, filtration, waterproofing, building, flooring, interiors, and wind energy. Johns Manville operates 45 manufacturing facilities across the U.S., Canada, Germany, Slovakia, and China, employing over 8,000 people. As of 2020, its products are marketed in more than 85 countries. Johns Manville’s business is structured into three strategic units: Engineered Products, Insulation Systems, and Roofing Systems. The Engineered Products division supplies glass fibers and nonwovens used in various markets, including building and construction, roofing, commercial interiors, automotive, filtration, and energy storage. Its clientele includes manufacturers of roofing and flooring products, automotive batteries, and filters, as well as plastic compounders seeking innovative materials with a low environmental impact over their lifecycle.

  • Fosroc International Ltd. - Founded in 1972 and based in Staffordshire, UK, Fosroc International Ltd. boasts a diverse portfolio of products used in the construction of buildings, airports, roads, railways, marine structures, power plants, oil & gas facilities, cement plants, chemical processes, and concrete structures. The company is also committed to providing solutions for a variety of needs such as adhesives, admixtures, cement additives, concrete repair, grouts & anchors, industrial flooring, joint sealants, protective coatings, and waterproofing. In the industry of waterproofing solutions, Fosroc has introduced a range of innovative products. These include Proofex Engage, Proofex PGP/Alkorplan, Proofex 3000/ GP/12/3000MR, the Nitoproof range, Proofex Torchseal, Proofex Sheetdrain/Cavitydrain, Proofex OGP/ORG/OFB, Polyurea WPE, and Nitoproof 800/600PF. All these products are equipped with advanced membrane systems, demonstrating the company’s commitment to innovation and quality in its offerings.

  • CICO Group - Founded in 1930, CICO Group is a New Delhi-based company that specializes in the provision of construction solutions and products. The company’s offerings encompass a wide range of products, including water sealers, waterproofers, construction aids, concrete admixtures, protective coatings, industrial flooring, concrete products, grouting compounds, repair compounds, sealants, waterproof coatings, and anchoring/bolting capsules. CICO Group is particularly known for two of its products: CICO Shield and CICO CORCHEM 206 I. The company’s reach extends beyond India, with a strong presence in South Asia, including countries like Bangladesh, Nepal, and Sri Lanka. CICO Group’s product portfolio is extensive, boasting approximately 86 distinct products. The company’s global distribution network is robust, with around 163 distributors spread across the world. This extensive network allows CICO Group to effectively cater to the diverse needs of its customers, providing them with high-quality construction solutions and products.

Value chain-based sizing & forecasting

Supply Side Estimates

  • Company revenue estimation via referring to annual reports, investor presentations, and Hoover’s.

  • Segment revenue determination via variable analysis and penetration modeling.

  • Competitive benchmarking to identify market leaders and their collective revenue shares.

  • Forecasting via analyzing commercialization rates, pipelines, market initiatives, distribution networks, etc.

Demand side estimates

  • Identifying parent markets and ancillary markets

  • Segment penetration analysis to obtain pertinent

  • revenue/volume

  • Heuristic forecasting with the help of subject matter experts

  • Forecasting via variable analysis

Waterproofing Membranes Market Report Objectives:

  • Understanding market dynamics (in terms of drivers, restraints, & opportunities) in the countries.

  • Understanding trends & variables in the individual countries & their impact on growth and using analytical tools to provide high-level insights into the market dynamics and the associated growth pattern.

  • Understanding market estimates and forecasts (with the base year as 2022, historic information from 2018 to 2021, and forecast from 2023 to 2030). Regional estimates & forecasts for each category are available and are summed up to form the global market estimates.

Waterproofing Membranes Market Report Assumptions:

  • The report provides market value for the base year 2022 and a yearly forecast till 2030 in terms of revenue/volume or both. The market for each of the segment outlooks has been provided on region & country basis for the above-mentioned forecast period.

  • The key industry dynamics, major technological trends, and application markets are evaluated to understand their impact on the demand for the forecast period. The growth rates were estimated using correlation, regression, and time-series analysis.

  • We have used the bottom-up approach for market sizing, analyzing key regional markets, dynamics, & trends for various products and end-users. The total market has been estimated by integrating the country markets.

  • All market estimates and forecasts have been validated through primary interviews with the key industry participants.

  • Inflation has not been accounted for to estimate and forecast the market.

  • Numbers may not add up due to rounding off.

  • Europe consists of EU-8, Central & Eastern Europe, along with the Commonwealth of Independent States (CIS).

  • Asia Pacific includes South Asia, East Asia, Southeast Asia, and Oceania (Australia & New Zealand).

  • Latin America includes Central American countries and the South American continent

  • Middle East includes Western Asia (as assigned by the UN Statistics Division) and the African continent.

Primary Research

GVR strives to procure the latest and unique information for reports directly from industry experts, which gives it a competitive edge. Quality is of utmost importance to us, therefore every year we focus on increasing our experts’ panel. Primary interviews are one of the critical steps in identifying recent market trends and scenarios. This process enables us to justify and validate our market estimates and forecasts to our clients. With more than 8,000 reports in our database, we have connected with some key opinion leaders across various domains, including healthcare, technology, consumer goods, and the chemical sector. Our process starts with identifying the right platform for a particular type of report, i.e., emails, LinkedIn, seminars, or telephonic conversation, as every report is unique and requires a differentiated approach.

We send out questionnaires to different experts from various regions/ countries, which is dependent on the following factors:

  • Report/Market scope: If the market study is global, we send questionnaires to industry experts across various regions, including North America, Europe, Asia Pacific, Latin America, and MEA.

  • Market Penetration: If the market is driven by technological advancements, population density, disease prevalence, or other factors, we identify experts and send out questionnaires based on region or country dominance.

The time to start receiving responses from industry experts varies based on how niche or well-penetrated the market is. Our reports include a detailed chapter on the KoL opinion section, which helps our clients understand the perspective of experts already in the market space.

What questions do you have? Get quick response from our industry experts. Request a Free Consultation
pdf icn

GET A FREE SAMPLE

arrow icn

This FREE sample includes data points, ranging from trend analyses to estimates and forecasts. See for yourself.

gvr icn

NEED A CUSTOM REPORT?

We can customize every report - free of charge - including purchasing stand-alone sections or country-level reports, as well as offer affordable discounts for start-ups & universities. Contact us now

Certified Icon

We are GDPR and CCPA compliant! Your transaction & personal information is safe and secure. For more details, please read our privacy policy.