The global genomics market size was valued at USD 32.65 billion in 2023 and is projected to witness a compound annual growth rate (CAGR) of 16.5% from 2024 to 2030. The growth of genomics market is attributed to factors such as growing demand for gene therapy, personalized medicine, drug discovery, increasing cancer incidence, and a significant increase in demand for consumer genomics in recent years. Moreover, increasing number of joint ventures and partnerships amongst market players is also expected to have a positive impact on the genomics market growth. For instance, in June 2022, Illumina, Inc., and Allegheny Health Network signed a collaboration for effective evaluation of the impact of in-house Comprehensive Genomic Profiling (CGP) to leverage patient care.
The COVID-19 pandemic outbreak had posed challenges to applications of genomics technology in terms of research and therapeutics. Nevertheless, some niche applications were of great use to mankind during the pandemic situation to facilitate immediate attention for designing effective diagnostics, effective therapeutics and steps to curb the spread of COVID-19. For example, the viral genome mutational rate (~1-2 bases per month) was gauged for validity of PCR cycle was estimated to understand the efficacy of the re-purposed anti-viral treatments and thereby the vaccine development process was streamlined.
Many genomic surveillance programs were launched country wise to understand the dynamics of pandemic situation and to effective preventive measures. For instance, in December 2020, the Indian SARS-CoV-2 Genomics Consortium (INSACOG) was launched by the joint efforts of Department of Biotechnology (DBT), Ministry of Health, and ICMR with an aim to screen the genomic variations in the SARS-CoV-2 by sequencing technologies. Furthermore, country specific companies are providing consumer genomics services which is also expected to fuel the market size in coming years. One such company being Mapmygenome which is one of the pioneers in India offers DTC genomics services.
The increasing prevalence of inherited cancers is expected create a high demand for cancer genomics. The substantial understanding of human genome have targeted focus on use of various gene therapies for treatment of cancers by modern gene editing techniques such as CRISPR-Cas gene technology. For instance, in September 2022, a group of researchers at the University of California introduced the applications of precision genome editing agents for management of inherited retinal diseases (IRDs).
The development of high-throughput sequencing technologies such as Next-Generation Sequencing (NGS) and microarrays has generated massive amounts of genomic data. However, the rapid accumulation of this data from DNA sequencing and Electronic Health Records (EHRs) poses significant challenges and opportunities for the extraction of biologically or clinically relevant information. Phenome-wide association study (PheWAS) & genome-wide association study (GWAS) are helping researchers to study correlations between genotype and phenotype.
The market players are extensively working towards collaborations, expansions, acquisitions and huge capital investments to advance in research to understand rare diseases and to aid drug discovery. For instance, PacBio declares a collaboration with the Genomics England society for the utility of PacBio’s technology to detect genetic variation in unexplained rare disorders. The study is intended to re-sequence a selection of samples collected during Genomics England’s 100,000 genomes project to discover potential operational and clinical benefits of long-read sequencing for the identification of mutations associated with rare diseases.
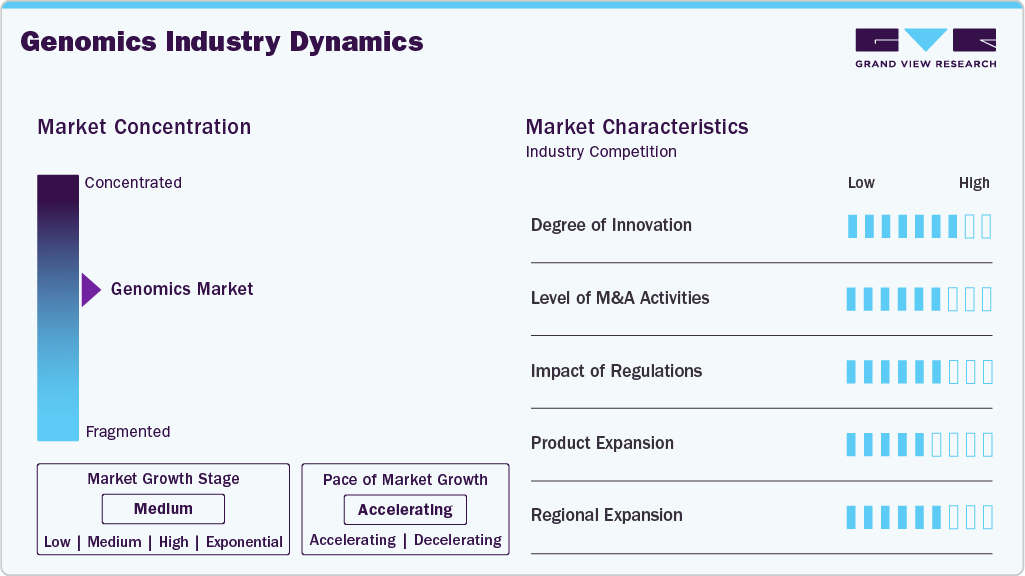
Market growth stage is moderate, and pace of the market growth is accelerating. The genomics market is characterized by a moderate-to-high degree of growth owing to increasing investment in R&D programs, advancements in technology, decreasing costs of sequencing, and increasing applications in various fields such as healthcare, agriculture, and personalized medicine. Furthermore, the market is also characterized by ongoing research and development activities, with companies investing in new technologies, methodologies, and applications. This included the development of cell genomics, proteomics, and advancements in bioinformatics. As per IQVIA, the number of genomes studied is predicted to increase to 52 million by 2025, bringing us new potential to treat chronic diseases and assess patient vulnerability to infections like COVID-19.
Key strategies implemented by players in genomics market are new product launches, expansion, acquisitions, partnerships, and other strategies. For instance, in January 2024, Veracyte has announced the acquisition of C2i Genomics to provide minimal residual disease capabilities to their novel diagnostic platform.
Growth of genomic data pool from research studies has helped biologists, patients, and physicians to investigate the genetic predisposition for some of the diseases. The clinical application of this data pool is expected to transform the healthcare system related to the provision of more effective, reliable, and accurate, disease management solutions. Although the clinical use of genomic data is still in the nascent stage, the industrial and healthcare communities are making efforts to successfully incorporate genetic data into clinical workflows.
The genomics market is dynamic and continues to witness constant innovation and translation of scientific knowledge to various applications. For instance, In January 2023, Prenetics Global Limited owned ACT Genomics received the U.S. FDA authorization for ACTOnco, a comprehensive genomic profiling test for solid cancers. It is beneficial for healthcare professionals to make informed clinical decisions related to professional guidelines for patients with solid cancers.
Furthermore, the use of AI-based software for understanding genomic data in various applications is another trend observed in this market and enabling cost-effective and rapid genome sequencing. Furthermore, AI speeds genomic research by automated data processing, enabling massive data integration, and allowing for faster & more accurate analysis. These benefits entice researchers, healthcare professionals, along with pharmaceutical firms, driving market expansion.
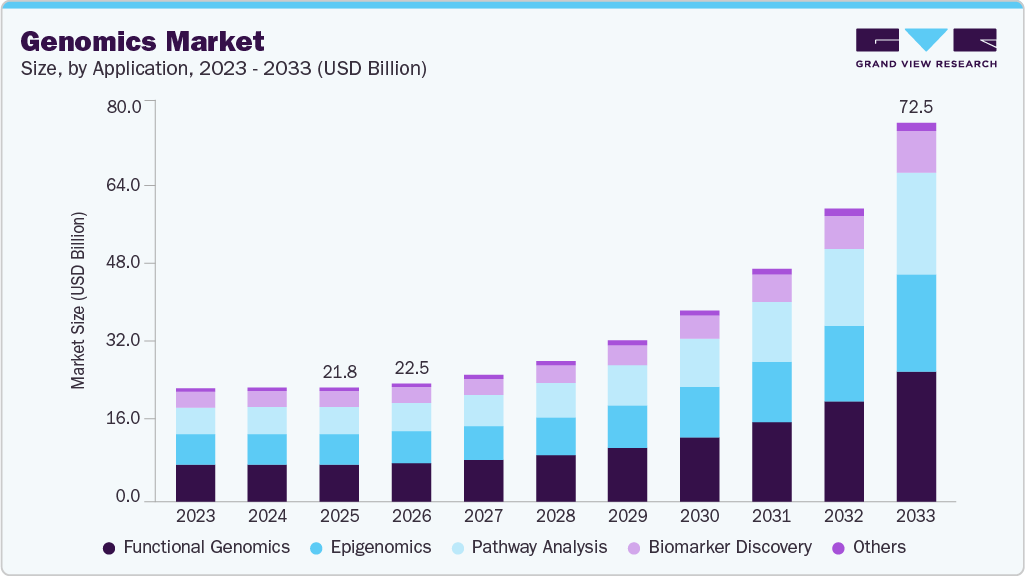
The functional genomics segment dominated the overall market with the largest revenue share of 32.1% in 2023. The dominance of the segment can be attributed to research studies aiming to understand a particular phenotypical expression of a given disease condition. Many gene therapies for cancers are designed on the basis of functional genomic technology. For instance, in June 2020, researchers at European Molecular Biology Laboratory (EMBL) at Heidelberg increased the scalability and precision metrics of functional genomics CRISPR/Cas9 gene-based screens through targeted single-cell RNA sequencing. Single-cell RNA sequencing gives deep insights into levels of gene expression in individual cells and can capably analyze CRISPR/Cas9 functional genomics screens.
Pathway analysis segment is predicted to emerge as the most lucrative of all by 2030. Usage of pathway analysis in developing next-generation therapeutics has emerged one of the most growing applications. Pathway-based analysis has gained more attention after the emergence of clinical genomics and personalized therapies. This is mainly because genomics and personalized therapies aid in the in-depth analysis of the ability to navigate signaling pathways and disease networks.
The product segment dominated the market in 2023. The products used in genomics are broadly segmented into two categories—instruments or systems that are required for the synthesis and sequencing of the nucleic acid sequences and consumables & reagents.
The increase in preference for personalized medicines and decline in costs of DNA sequencing owing to the launch of NGS technology resulted in the development of novel products or systems. The genomics market is gradually becoming more competitive with new product launches. For instance, in June 2022, PerkinElmer introduced an automated benchtop system for NGS, the research-use only BioQule NGS System to automate library preparation.
The service segment is expected to register a steady CAGR by 2030. The high cost of products, the demand for expertise required for genomics, and the focus on core operations by the end user are the major factors driving the services segment. NGS-based services held a major share in the genomics services segment due to the rapid adoption of Whole Genome Sequencing (WGS) and applications of sequence databases for disorder screening and prognosis. However, data processing and interpretation, rather than data production has become the need for current development and application.
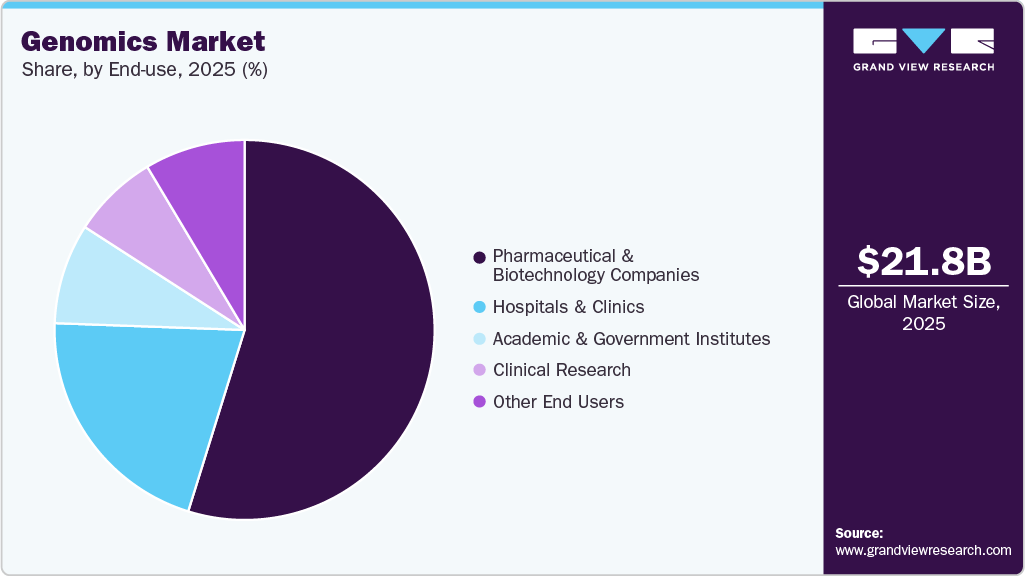
The pharmaceutical and biotechnology companies segment led the market in 2023. This is attributed to the increasing demand for use of genomics in drug discovery. Moreover, the market is driven by increasing adoption of spatial genomics & transcriptomics technologies. Numerous trials are underway for novel drug discovery using underlying knowledge from genomics. For instance, in June 2022, Illumina Inc., declares that it will present seven of their abstracts regarding the key oncology research at the American Society of Clinical Oncology (ASCO) 2022 in further to an event to discuss the transformational impact of comprehensive genomic profiling in precision medicine.
The hospital and clinic segment is estimated to grow at a substantial pace during the forecast period. Several hospitals and clinics are currently offering genomic sequencing services to patients and are using this technology in the daily practice of medicine. Stanford Medicine is one such facility that provides genomic sequencing services to patients with a rare or unidentified condition that is thought to be genetic. The first hospital system to offer the general public services for genetic sequencing, analysis, and interpretation is Partners HealthCare based in the U.S. It has enrolled over 200 patients and physicians in a study funded by NIH to study the integration of whole genome sequencing in clinical medicine.
North America accounted for the largest market share of 42.65% in 2023. This is attributed to the support of research institutes and pharmaceutical giants. Genomics is now an integral part of any disease research and drug discovery due to the implications of genetic expression on human health. There are emerging advancements in the region for the utility of genomics with collaborative efforts. For instance, in January 2022, Illumina, Inc. collaborated with Nashville Biosciences, LLC, (part of Vanderbilt University Medical Center at Tennesee), for drug development by using genomics and to establish a preeminent clinico-genomic resource.
Asia Pacific is estimated to be the fastest-growing segment over the forecast period due to increased demand for genomics applications in diagnostics and the growing demand for novel therapeutic drugs to fight the increased incidence of diseases in the region. Several major human genome sequencing projects are being performed, one of the most recent projects is Genome Asia 100K. Under this project, 100,000 Asian genomes would be sequenced and analyzed, which can help accelerate population-specific medical advances and precision medicine. With this project, GA 100K was expected to identify new possible therapeutic drugs and understand the biology of diseases.
Indian market is anticipated to grow at significant growth rate over the forecast period. Over the past few decades, India has become a hub for pharmaceutical and biotechnology and has gained global attention due to the presence of skilled & knowledgeable manpower and low capital investments. Owing to the presence of rich resources and a large pool of existing R&D institutions in the country, India has become one of the key areas for setting up research laboratories & manufacturing units by multinational companies. Thus, rapidly growing pharmaceutical & biotechnology industries and frequent government initiatives to boost R&D activities in the country are expected to create lucrative opportunities in India genomics market.
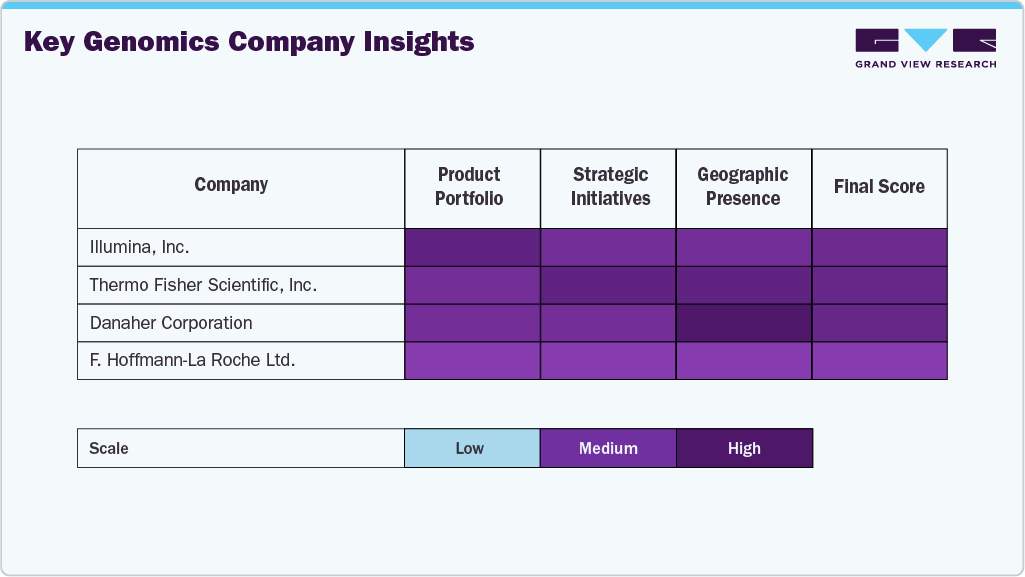
The market players operating in the genomics market are adopting product approval to increase the reach of their products in the market and improve the availability of their products & services in diverse geographical areas, along with expansion as a strategy to enhance production/research activities. In addition, several market players are acquiring smaller players to strengthen their market position. This strategy enables companies to increase their capabilities, expand their product portfolios, and improve their competencies.
In November 2023, Fabric Genomics collaborated with DNAnexus and Oxford Nanopore Technologies for deployment of CLIA/CAP labs in pediatric and neonatal ICU’s. The labs will use Oxford Nanopore’s platforms to study genetic disorders in infants.
in February 2023, Illumina, Inc. entered into a collaboration with African Centre of Excellence for Genomics of Infectious Diseases to start a training institute to increase genomic capabilities in African region
In January 2023, SOPHiA GENETIC collaborated with the Memorial Sloan Kettering Cancer Center (MSK), a U.S. Cancer Center, to offer researchers and clinicians solutions to expand analytical and testing capabilities.
In January 2023, Agilent Technologies, Inc. announced acquisition of Avida Biomed, a company that develops target enrichment workflows for clinical researchers utilizing NGS methods to study cancers.
In April 2022, QIAGEN launched the Biomedical Knowledge Base in Europe, Japan, North America, and Australia to support data science applications in biotech companies
Report Attribute |
Details |
Market size value in 2024 |
USD 37.89 billion |
Revenue forecast in 2030 |
USD 94.86 billion |
Growth rate |
CAGR of 16.5% from 2024 to 2030 |
Actual data |
2018 - 2023 |
Forecast period |
2024 - 2030 |
Quantitative units |
Revenue in USD million and CAGR from 2024 to 2030 |
Report coverage |
Revenue forecast, company ranking, competitive landscape, growth factors, and trends |
Segments covered |
Application, technology, deliverables, end-use, region |
Regional scope |
North America; Europe; Asia Pacific; Latin America; MEA |
Country scope |
U.S.; Canada; U.K.; Germany; France; Italy; Spain; Denmark; Sweden; Norway; Japan; China; India; Australia; Thailand;South Korea; Brazil; Mexico, Argentina; South Africa; Saudi Arabia, UAE; Kuwait |
Key companies profiled |
Agilent Technologies; Bio-Rad Laboratories, Inc.; BGI Genomics; Color Genomics, Inc.; Danaher Corporation; Eppendorf AG; Eurofins Scientific; F. Hoffmann-La Roche Ltd.; GE Healthcare; Illumina Inc.; Myriad Genetics, Inc.; Oxford Nanopore Technologies; Pacific Biosciences of California, Inc.; QIAGEN N.V.; Quest Diagnostics Incorporated; Thermo Fisher Scientific, Inc.; 23andMe, Inc. |
Customization scope |
Free report customization (equivalent up to 8 analyst's working days) with purchase. Addition or alteration to country, regional & segment scope. |
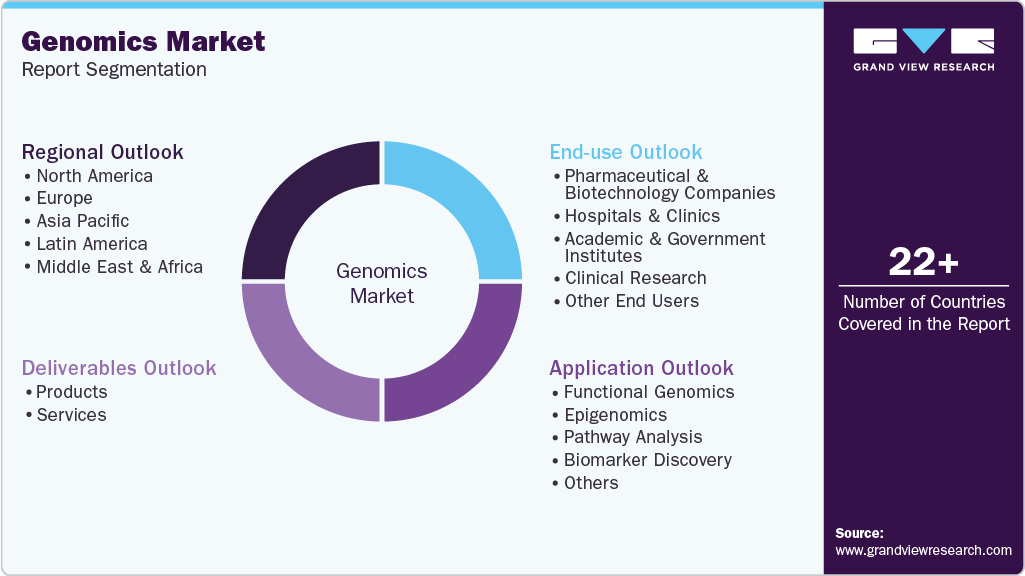
This report forecasts revenue growth and provides an analysis of the latest trends in each of the sub-segments from 2018 to 2030. For this report, Grand View Research has segmented the global genomics market based on application, technology, deliverables, end-use, and region:
Application & Technology Outlook (Revenue, USD Billion, 2018 - 2030)
Functional Genomics
Transfection
Real-Time PCR
RNA Interference
Mutational Analysis
SNP Analysis
Microarray Analysis
Epigenomics
Bisulfite Sequencing
Chromatin Immunoprecipitation (ChIP & ChIP-Seq)
Methylated DNA Immunoprecipitation (MeDIP)
High-Resolution Melt (HRM)
Chromatin Accessibility Assays
Microarray Analysis
Pathway Analysis
Bead-Based Analysis
Microarray Analysis
Real-time PCR
Proteomics Tools (2-D PAGE; yeast 2-hybrid studies)
Biomarker Discovery
Mass Spectrometry
Real-time PCR
Microarray Analysis
Statistical Analysis
Bioinformatics
Others
Sequencing
PCR
Flow Cytometry
Microarrays
Other technologies
Deliverables Outlook (Revenue, USD Billion, 2018 - 2030)
Products
Instruments/Systems/Software
Consumables & Reagents
Services
NGS-based Services
Core Genomics Services
Biomarker Translation Services
Computational Services
Others
End-use Outlook (Revenue, USD Billion, 2018 - 2030)
Clinical Research
Academic & Government Institutes
Hospitals & Clinics
Pharmaceutical & Biotechnology Companies
Other End Users
Regional Outlook (Revenue, USD Billion, 2018 - 2030)
North America
U.S.
Canada
Europe
Germany
U.K.
France
Italy
Spain
Denmark
Sweden
Norway
Asia Pacific
China
India
Japan
South Korea
Australia
Latin America
Brazil
Mexico
Argentina
Middle East & Africa
South Africa
Saudi Arabia
UAE
b. The global genomics market size was estimated at USD 32.65 billion in 2023 and is expected to reach USD 37.89 billion in 2024.
b. The global genomics market is expected to witness a compound annual growth rate of 16.5% from 2024 to 2030 to reach USD 94.86 billion by 2030.
b. The pharmaceutical and biotechnology companies segment accounted for the major revenue share owing to the increasing number of genetic research studies aimed at the development of efficacious drugs with fewer side effects and improving the drug discovery process.
b. Major players in the genomics market include F. Hoffmann-La Roche Ltd..; Agilent Technologies, Thermo Fisher Scientific, Inc.; Bio-Rad Laboratories, Inc.; 23andMe, Inc.; Illumina, Inc.; Myriad Genetics, Inc.; Foundation Medicine, Inc.; Danaher, Pacific Biosciences; Oxford Nanopore Technologies; and BGI.
b. Technological advancements in genetic tools, as well as molecular diagnostics, is one of the key driving force that has accelerated investment by genomic companies in the market.
Table of Contents
Chapter 1. Genomics Market: Methodology and Scope
1.1. Market Segmentation and Scope
1.2. Market Definitions
1.2.1. Application & Technology
1.2.2. Deliverables
1.2.3. End use
1.3. Information analysis
1.4. Market formulation & data visualization
1.5. Data validation & publishing
1.6. Information Procurement
1.6.1. Primary Research
1.7. Information or Data Analysis
1.8. Market Formulation & Validation
1.9. Market Model
1.10. Objectives
Chapter 2. Genomics Market: Executive Summary
2.1. Market Snapshot
2.2. Segment Snapshot
2.3. Competitive Landscape Snapshot
Chapter 3. Genomics Market: Market Variables, Trends, & Scope
3.1. Market Segmentation and Scope
3.2. Market Lineage Outlook
3.2.1. Parent Market Outlook
3.2.2. Related/Ancillary Market Outlook
3.3. Market Dynamics
3.3.1. Market Driver Analysis
3.3.1.1. Growing integration of genomics data into clinical workflows
3.3.1.1.1. More targeted and personalized healthcare
3.3.1.1.2. Growth of newborn genetic screening programs
3.3.1.1.3. Advancements in noninvasive cancer screening
3.3.1.1.4. Military genomics
3.3.1.2. Technological advances to facilitate genomic R&D
3.3.1.2.1. Emergence of advanced genome editing techniques
3.3.1.2.2. Integration of new data streams
3.3.1.2.3. RNA biology
3.3.1.2.4. Single-cell biology
3.3.1.3. Rising adoption of DIRECT-TO-CONSUMER genomics
3.3.1.4. Success of genetic tools in agrigenomics
3.3.1.5. Increasing participation of different companies
3.3.1.6. Increase in government role and funding in genomics
3.3.2. Market Restraint Analysis
3.3.2.1. Issues regarding intellectual property protection, data management, and public policies
3.3.2.2. Dearth of Public databases and personnel knowledge on machine learning algorithms
3.4. Industry Analysis Tools
3.4.1. SWOT Analysis; By Factor (Political & Legal, Economic And Technological)
3.4.2. Porter's Five Forces Analysis
3.5. COVID-19 Impact Analysis
Chapter 4. Genomics Market: Application & Technology Business Analysis
4.1. Genomics Market: Application & Technology Market Share Analysis
4.2. Genomics Market Estimates & Forecast, By Application & Technology (USD Million)
4.3. Functional Genomics
4.3.1. Global Functional Genomics Market, 2018 - 2030 (USD Million)
4.3.2. Transfection
4.3.2.1. Global Transfection Market, 2018 - 2030 (USD Million)
4.3.3. Real-Time PCR
4.3.3.1. Global Real-Time PCR Market, 2018 - 2030 (USD Million)
4.3.4. RNA Interference
4.3.4.1. Global RNA Interference Market, 2018 - 2030 (USD Million)
4.3.5. Mutational Analysis
4.3.5.1. Global Mutational Analysis Market, 2018 - 2030 (USD Million)
4.3.6. SNP Analysis
4.3.6.1. Global SNP Analysis Market, 2018 - 2030 (USD Million)
4.3.7. Microarray Analysis
4.3.7.1. Global Microarray Analysis Market, 2018 - 2030 (USD Million)
4.4. Epigenomics
4.4.1. Global Epigenomics Market, 2018 - 2030 (USD Million)
4.4.2. Bisulfite Sequencing
4.4.2.1. Global Bisulfite Sequencing Market, 2018 - 2030 (USD Million)
4.4.3. Chromatin Immunoprecipitation (ChIP & ChIP-Seq)
4.4.3.1. Global Chromatin Immunoprecipitation (ChIP & ChIP-Seq) Market, 2018 - 2030 (USD Million)
4.4.4. Methylated DNA Immunoprecipitation (MeDIP)
4.4.4.1. Global Methylated DNA Immunoprecipitation (MeDIP) Market, 2018 - 2030 (USD Million)
4.4.5. High-Resolution Melt (HRM)
4.4.5.1. Global High-Resolution Melt (HRM) Market, 2018 - 2030 (USD Million)
4.4.6. Chromatin Accessibility Assays
4.4.6.1. Global Chromatin Accessibility Assays Market, 2018 - 2030 (USD Million)
4.4.7. Microarray Analysis
4.4.7.1. Global Microarray Analysis Market, 2018 - 2030 (USD Million)
4.5. Pathway Analysis
4.5.1. Global Pathway Analysis Market, 2018 - 2030 (USD Million)
4.5.2. Bead-Based Analysis
4.5.2.1. Global Bead-Based Analysis Market, 2018 - 2030 (USD Million)
4.5.3. Microarray Analysis
4.5.3.1. Global Microarray Analysis Market, 2018 - 2030 (USD Million)
4.5.4. Real-time PCR
4.5.4.1. Global Real-time PCR Market, 2018 - 2030 (USD Million)
4.5.5. Proteomics Tools (2-D PAGE; yeast 2-hybrid studies)
4.5.5.1. Global Proteomics Tools (2-D PAGE; yeast 2-hybrid studies) Market, 2018 - 2030 (USD Million)
4.6. Biomarker Discovery
4.6.1. Global Biomarker Discovery Market, 2018 - 2030 (USD Million)
4.6.2. Mass Spectrometry
4.6.2.1. Global Mass Spectrometry Market, 2018 - 2030 (USD Million)
4.6.3. Real-time PCR
4.6.3.1. Global Real-time PCR Market, 2018 - 2030 (USD Million)
4.6.4. Microarray Analysis
4.6.4.1. Global Microarray Analysis Market, 2018 - 2030 (USD Million)
4.6.5. Statistical Analysis
4.6.5.1. Global Statistical Analysis Market, 2018 - 2030 (USD Million)
4.6.6. Bioinformatics
4.6.6.1. Global Bioinformatics Market, 2018 - 2030 (USD Million)
4.6.7. DNA Sequencing
4.6.7.1. Global DNA Sequencing Market, 2018 - 2030 (USD Million)
4.7. Others
4.7.1. Global Others Market, 2018 - 2030 (USD Million)
Chapter 5. Genomics Market: Deliverables Business Analysis
5.1. Genomics Market: Deliverables Market Share Analysis
5.2. Genomics Market Estimates & Forecast, By Deliverables (USD Million)
5.3. Products
5.3.1. Global Products Market, 2018 - 2030 (USD Million)
5.3.2. Instruments/Systems/Software
5.3.2.1. Global Instruments/Systems/Software Market, 2018 - 2030 (USD Million)
5.3.3. Consumables & Reagents
5.3.3.1. Global Consumables & Reagents Market, 2018 - 2030 (USD Million)
5.4. Services
5.4.1. Global Services Market, 2018 - 2030 (USD Million)
5.4.2. NGS-based Services
5.4.2.1. Global NGS-based Services Market, 2018 - 2030 (USD Million)
5.4.3. Core Genomics Services
5.4.3.1. Global Core Genomics Services Market, 2018 - 2030 (USD Million)
5.4.4. Biomarker Translation Services
5.4.4.1. Global Biomarker Translation Services Market, 2018 - 2030 (USD Million)
5.4.5. Computational Services
5.4.5.1. Global Computational Services Market, 2018 - 2030 (USD Million)
5.4.6. Others
5.4.6.1. Global Others Market, 2018 - 2030 (USD Million)
Chapter 6. Genomics Market: End-use business Analysis
6.1. Genomics Market: End-use Market Share Analysis
6.2. Genomics Market Estimates & Forecast, By End-use (USD Million)
6.3. Clinical Research
6.3.1. Global Clinical Research Market, 2018 - 2030 (USD Million)
6.4. Academic & Government Institutes
6.4.1. Global Academic & Government Institutes Market, 2018 - 2030 (USD Million)
6.5. Hospitals & Clinics
6.5.1. Global Hospitals & Clinics Market, 2018 - 2030 (USD Million)
6.6. Pharmaceutical & Biotechnology Companies
6.6.1. Global Pharmaceutical & Biotechnology Companies Market, 2018 - 2030 (USD Million)
6.7. Others
6.7.1. Global Others Market, 2018 - 2030 (USD Million)
Chapter 7. Genomics Market: Regional Business Analysis
7.1. Genomics Market Share By Region, 2022 & 2030
7.2. North America
7.2.1. North America Genomics Market, 2018 - 2030 (USD Million)
7.2.2. U.S.
7.2.2.1. Key Country Dynamics
7.2.2.2. Competitive Scenario
7.2.2.3. Regulatory Framework
7.2.2.4. U.S. Genomics Market, 2018 - 2030 (USD Million)
7.2.3. Canada
7.2.3.1. Key Country Dynamics
7.2.3.2. Competitive Scenario
7.2.3.3. Regulatory Framework
7.2.3.4. Canada Genomics Market, 2018 - 2030 (USD Million)
7.3. Europe
7.3.1. Europe Genomics Market, 2018 - 2030 (USD Million)
7.3.2. UK
7.3.2.1. Key Country Dynamics
7.3.2.2. Competitive Scenario
7.3.2.3. Regulatory Framework
7.3.2.4. UK Genomics Market, 2018 - 2030 (USD Million)
7.3.3. Germany
7.3.3.1. Key Country Dynamics
7.3.3.2. Competitive Scenario
7.3.3.3. Regulatory Framework
7.3.3.4. Germany Genomics Market, 2018 - 2030 (USD Million)
7.3.4. France
7.3.4.1. Key Country Dynamics
7.3.4.2. Competitive Scenario
7.3.4.3. Regulatory Framework
7.3.4.4. France Genomics Market, 2018 - 2030 (USD Million)
7.3.5. Italy
7.3.5.1. Key Country Dynamics
7.3.5.2. Competitive Scenario
7.3.5.3. Regulatory Framework
7.3.5.4. Italy Genomics Market, 2018 - 2030 (USD Million)
7.3.6. Spain
7.3.6.1. Key Country Dynamics
7.3.6.2. Competitive Scenario
7.3.6.3. Regulatory Framework
7.3.6.4. Spain Genomics Market, 2018 - 2030 (USD Million)
7.3.7. Denmark
7.3.7.1. Key Country Dynamics
7.3.7.2. Competitive Scenario
7.3.7.3. Regulatory Framework
7.3.7.4. Denmark Genomics Market, 2018 - 2030 (USD Million)
7.3.8. Sweden
7.3.8.1. Key Country Dynamics
7.3.8.2. Competitive Scenario
7.3.8.3. Regulatory Framework
7.3.8.4. Sweden Genomics Market, 2018 - 2030 (USD Million)
7.3.9. Norway
7.3.9.1. Key Country Dynamics
7.3.9.2. Competitive Scenario
7.3.9.3. Regulatory Framework
7.3.9.4. Norway Genomics Market, 2018 - 2030 (USD Million)
7.4. Asia Pacific
7.4.1. Asia Pacific Genomics Market, 2018 - 2030 (USD Million)
7.4.2. Japan
7.4.2.1. Key Country Dynamics
7.4.2.2. Competitive Scenario
7.4.2.3. Regulatory Framework
7.4.2.4. Japan Genomics Market, 2018 - 2030 (USD Million)
7.4.3. China
7.4.3.1. Key Country Dynamics
7.4.3.2. Competitive Scenario
7.4.3.3. Regulatory Framework
7.4.3.4. China Genomics Market, 2018 - 2030 (USD Million)
7.4.4. India
7.4.4.1. Key Country Dynamics
7.4.4.2. Competitive Scenario
7.4.4.3. Regulatory Framework
7.4.4.4. India Genomics Market, 2018 - 2030 (USD Million)
7.4.5. Australia
7.4.5.1. Key Country Dynamics
7.4.5.2. Competitive Scenario
7.4.5.3. Regulatory Framework
7.4.5.4. Australia Genomics Market, 2018 - 2030 (USD Million)
7.4.6. Thailand
7.4.6.1. Key Country Dynamics
7.4.6.2. Competitive Scenario
7.4.6.3. Regulatory Framework
7.4.6.4. Thailand Genomics Market, 2018 - 2030 (USD Million)
7.4.7. South Korea
7.4.7.1. Key Country Dynamics
7.4.7.2. Competitive Scenario
7.4.7.3. Regulatory Framework
7.4.7.4. South Korea Genomics Market, 2018 - 2030 (USD Million)
7.5. Latin America
7.5.1. Latin America Genomics Market, 2018 - 2030 (USD Million)
7.5.2. Brazil
7.5.2.1. Key Country Dynamics
7.5.2.2. Competitive Scenario
7.5.2.3. Regulatory Framework
7.5.2.4. Brazil Genomics Market, 2018 - 2030 (USD Million)
7.5.3. Mexico
7.5.3.1. Key Country Dynamics
7.5.3.2. Competitive Scenario
7.5.3.3. Regulatory Framework
7.5.3.4. Mexico Genomics Market, 2018 - 2030 (USD Million)
7.5.4. Argentina
7.5.4.1. Key Country Dynamics
7.5.4.2. Competitive Scenario
7.5.4.3. Regulatory Framework
7.5.4.4. Argentina Genomics Market, 2018 - 2030 (USD Million)
7.6. MEA
7.6.1. MEA Genomics Market, 2018 - 2030 (USD Million)
7.6.2. South Africa
7.6.2.1. Key Country Dynamics
7.6.2.2. Competitive Scenario
7.6.2.3. Regulatory Framework
7.6.2.4. South Africa Genomics Market, 2018 - 2030 (USD Million)
7.6.3. Saudi Arabia
7.6.3.1. Key Country Dynamics
7.6.3.2. Competitive Scenario
7.6.3.3. Regulatory Framework
7.6.3.4. Saudi Arabia Genomics Market, 2018 - 2030 (USD Million)
7.6.4. UAE
7.6.4.1. Key Country Dynamics
7.6.4.2. Competitive Scenario
7.6.4.3. Regulatory Framework
7.6.4.4. UAE Genomics Market, 2018 - 2030 (USD Million)
7.6.5. Kuwait
7.6.5.1. Key Country Dynamics
7.6.5.2. Competitive Scenario
7.6.5.3. Regulatory Framework
7.6.5.4. Kuwait Genomics Market, 2018 - 2030 (USD Million)
Chapter 8. Competitive Landscape
8.1. Financial Performance
8.2. Participant Categorization
8.2.1. Market Leaders
8.2.1.1. Market share analysis, 2023
8.3. Participant’s Overview
8.3.1. Agilent Technologies
8.3.1.1. Overview
8.3.1.2. Financial Performance (Net Revenue/Sales/EBITDA/Gross Profit)
8.3.1.3. Technology Benchmarking
8.3.1.4. Strategic Initiatives
8.3.2. Bio-Rad Laboratories, Inc
8.3.2.1. Overview
8.3.2.2. Financial Performance (Net Revenue/Sales/EBITDA/Gross Profit)
8.3.2.3. Technology Benchmarking
8.3.2.4. Strategic Initiatives
8.3.3. BGI Genomics
8.3.3.1. Overview
8.3.3.2. Financial Performance (Net Revenue/Sales/EBITDA/Gross Profit)
8.3.3.3. Technology Benchmarking
8.3.3.4. Strategic Initiatives
8.3.4. Color Genomics, Inc
8.3.4.1. Overview
8.3.4.2. Financial Performance (Net Revenue/Sales/EBITDA/Gross Profit)
8.3.4.3. Technology Benchmarking
8.3.4.4. Strategic Initiatives
8.3.5. Danaher Corporation
8.3.5.1. Overview
8.3.5.2. Financial Performance (Net Revenue/Sales/EBITDA/Gross Profit)
8.3.5.3. Technology Benchmarking
8.3.5.4. Strategic Initiatives
8.3.6. Eppendorf AG
8.3.6.1. Overview
8.3.6.2. Financial Performance (Net Revenue/Sales/EBITDA/Gross Profit)
8.3.6.3. Technology Benchmarking
8.3.6.4. Strategic Initiatives
8.3.7. Eurofins Scientific
8.3.7.1. Overview
8.3.7.2. Financial Performance (Net Revenue/Sales/EBITDA/Gross Profit)
8.3.7.3. Technology Benchmarking
8.3.7.4. Strategic Initiatives
8.3.8. F. Hoffmann-La Roche Ltd.
8.3.8.1. Overview
8.3.8.2. Financial Performance (Net Revenue/Sales/EBITDA/Gross Profit)
8.3.8.3. Technology Benchmarking
8.3.8.4. Strategic Initiatives
8.3.9. GE Healthcare
8.3.9.1. Overview
8.3.9.2. Financial Performance (Net Revenue/Sales/EBITDA/Gross Profit)
8.3.9.3. Technology Benchmarking
8.3.9.4. Strategic Initiatives
8.3.10. Illumina, Inc.
8.3.10.1. Overview
8.3.10.2. Financial Performance (Net Revenue/Sales/EBITDA/Gross Profit)
8.3.10.3. Technology Benchmarking
8.3.10.4. Strategic Initiatives
8.3.11. Myriad Genetics, Inc
8.3.11.1. Overview
8.3.11.2. Financial Performance (Net Revenue/Sales/EBITDA/Gross Profit)
8.3.11.3. Technology Benchmarking
8.3.11.4. Strategic Initiatives
8.3.12. Oxford Nanopore Technologies
8.3.12.1. Overview
8.3.12.2. Financial Performance (Net Revenue/Sales/EBITDA/Gross Profit)
8.3.12.3. Technology Benchmarking
8.3.12.4. Strategic Initiatives
8.3.13. Pacific Biosciences of California, Inc
8.3.13.1. Overview
8.3.13.2. Financial Performance (Net Revenue/Sales/EBITDA/Gross Profit)
8.3.13.3. Technology Benchmarking
8.3.13.4. Strategic Initiatives
8.3.14. QIAGEN N.V.
8.3.14.1. Overview
8.3.14.2. Financial Performance (Net Revenue/Sales/EBITDA/Gross Profit)
8.3.14.3. Technology Benchmarking
8.3.14.4. Strategic Initiatives
8.3.15. Quest Diagnostics Incorporated
8.3.15.1. Overview
8.3.15.2. Financial Performance (Net Revenue/Sales/EBITDA/Gross Profit)
8.3.15.3. Technology Benchmarking
8.3.15.4. Strategic Initiatives
8.3.16. Thermo Fisher Scientific, Inc
8.3.16.1. Overview
8.3.16.2. Financial Performance (Net Revenue/Sales/EBITDA/Gross Profit)
8.3.16.3. Technology Benchmarking
8.3.16.4. Strategic Initiatives
8.3.17. 23andMe, Inc
8.3.17.1. Overview
8.3.17.2. Financial Performance (Net Revenue/Sales/EBITDA/Gross Profit)
8.3.17.3. Technology Benchmarking
8.3.17.4. Strategic Initiatives
8.4. Strategy Mapping
8.4.1. Expansion
8.4.2. Acquisition
8.4.3. Collaborations
8.4.4. Product/service launch
8.4.5. Partnerships
8.4.6. Others
List of Tables
Table 1 List of secondary sources
Table 2 List of abbreviations
Table 3 Global genomics market, by technology & application, 2018 - 2030 (USD Million)
Table 4 Global genomics market, by deliverables, 2018 - 2030 (USD Million)
Table 5 Global genomics market, by End-use, 2018 - 2030 (USD Million)
Table 6 Global genomics market, by region, 2018 - 2030 (USD Million)
Table 7 North America genomics market, by country, 2018 - 2030 (USD Million)
Table 8 North America genomics market, by technology & application, 2018 - 2030 (USD Million)
Table 9 North America genomics market, by deliverables, 2018 - 2030 (USD Million)
Table 10 North America genomics market, by End-use, 2018 - 2030 (USD Million)
Table 11 U.S. genomics market, by technology & application, 2018 - 2030 (USD Million)
Table 12 U.S. genomics market, by deliverables, 2018 - 2030 (USD Million)
Table 13 U.S. genomics market, by End-use, 2018 - 2030 (USD Million)
Table 14 Canada genomics market, by technology & application, 2018 - 2030 (USD Million)
Table 15 Canada genomics market, by deliverables, 2018 - 2030 (USD Million)
Table 16 Canada genomics market, by End-use, 2018 - 2030 (USD Million)
Table 17 Europe genomics market, by country, 2018 - 2030 (USD Million)
Table 18 Europe genomics market, by technology & application, 2018 - 2030 (USD Million)
Table 19 Europe genomics market, by deliverables, 2018 - 2030 (USD Million)
Table 20 Europe genomics market, by End-use, 2018 - 2030 (USD Million)
Table 21 UK genomics market, by technology & application, 2018 - 2030 (USD Million)
Table 22 UK genomics market, by deliverables, 2018 - 2030 (USD Million)
Table 23 UK genomics market, by End-use, 2018 - 2030 (USD Million)
Table 24 Germany genomics market, by technology & application, 2018 - 2030 (USD Million)
Table 25 Germany genomics market, by deliverables, 2018 - 2030 (USD Million)
Table 26 Germany genomics market, by End-use, 2018 - 2030 (USD Million)
Table 27 France genomics market, by technology & application, 2018 - 2030 (USD Million)
Table 28 France genomics market, by deliverables, 2018 - 2030 (USD Million)
Table 29 France genomics market, by End-use, 2018 - 2030 (USD Million)
Table 30 Italy genomics market, by technology & application, 2018 - 2030 (USD Million)
Table 31 Italy genomics market, by deliverables, 2018 - 2030 (USD Million)
Table 32 Italy genomics market, by End-use, 2018 - 2030 (USD Million)
Table 33 Spain genomics market, by technology & application, 2018 - 2030 (USD Million)
Table 34 Spain genomics market, by deliverables, 2018 - 2030 (USD Million)
Table 35 Spain genomics market, by End-use, 2018 - 2030 (USD Million)
Table 36 Denmark genomics market, by technology & application, 2018 - 2030 (USD Million)
Table 37 Denmark genomics market, by deliverables, 2018 - 2030 (USD Million)
Table 38 Denmark genomics market, by End-use, 2018 - 2030 (USD Million)
Table 39 Sweden genomics market, by technology & application, 2018 - 2030 (USD Million)
Table 40 Sweden genomics market, by deliverables, 2018 - 2030 (USD Million)
Table 41 Sweden genomics market, by End-use, 2018 - 2030 (USD Million)
Table 42 Norway genomics market, by technology & application, 2018 - 2030 (USD Million)
Table 43 Norway genomics market, by deliverables, 2018 - 2030 (USD Million)
Table 44 Norway genomics market, by End-use, 2018 - 2030 (USD Million)
Table 45 Asia Pacific genomics market, by country, 2018 - 2030 (USD Million)
Table 46 Asia Pacific genomics market, by technology & application, 2018 - 2030 (USD Million)
Table 47 Asia Pacific genomics market, by deliverables, 2018 - 2030 (USD Million)
Table 48 Asia Pacific genomics market, by End-use, 2018 - 2030 (USD Million)
Table 49 Japan genomics market, by technology & application, 2018 - 2030 (USD Million)
Table 50 Japan genomics market, by deliverables, 2018 - 2030 (USD Million)
Table 51 Japan genomics market, by End-use, 2018 - 2030 (USD Million)
Table 52 China genomics market, by technology & application, 2018 - 2030 (USD Million)
Table 53 China genomics market, by deliverables, 2018 - 2030 (USD Million)
Table 54 China genomics market, by End-use, 2018 - 2030 (USD Million)
Table 55 India genomics market, by technology & application, 2018 - 2030 (USD Million)
Table 56 India genomics market, by deliverables, 2018 - 2030 (USD Million)
Table 57 India genomics market, by End-use, 2018 - 2030 (USD Million)
Table 58 Australia genomics market, by technology & application, 2018 - 2030 (USD Million)
Table 59 Australia genomics market, by deliverables, 2018 - 2030 (USD Million)
Table 60 Australia genomics market, by End-use, 2018 - 2030 (USD Million)
Table 61 Thailand genomics market, by technology & application, 2018 - 2030 (USD Million)
Table 62 Thailand genomics market, by deliverables, 2018 - 2030 (USD Million)
Table 63 Thailand genomics market, by End-use, 2018 - 2030 (USD Million)
Table 64 South Korea genomics market, by technology & application, 2018 - 2030 (USD Million)
Table 65 South Korea genomics market, by deliverables, 2018 - 2030 (USD Million)
Table 66 South Korea genomics market, by End-use, 2018 - 2030 (USD Million)
Table 67 Latin America genomics market, by country, 2018 - 2030 (USD Million)
Table 68 Latin America genomics market, by technology & application, 2018 - 2030 (USD Million)
Table 69 Latin America genomics market, by deliverables, 2018 - 2030 (USD Million)
Table 70 Latin America genomics market, by End-use, 2018 - 2030 (USD Million)
Table 71 Brazil genomics market, by technology & application, 2018 - 2030 (USD Million)
Table 72 Brazil genomics market, by deliverables, 2018 - 2030 (USD Million)
Table 73 Brazil genomics market, by End-use, 2018 - 2030 (USD Million)
Table 74 Mexico genomics market, by technology & application, 2018 - 2030 (USD Million)
Table 75 Mexico genomics market, by deliverables, 2018 - 2030 (USD Million)
Table 76 Mexico genomics market, by End-use, 2018 - 2030 (USD Million)
Table 77 Argentina genomics market, by technology & application, 2018 - 2030 (USD Million)
Table 78 Argentina genomics market, by deliverables, 2018 - 2030 (USD Million)
Table 79 Argentina genomics market, by End-use, 2018 - 2030 (USD Million)
Table 80 Middle East & Africa genomics market, by country, 2018 - 2030 (USD Million)
Table 81 Middle East & Africa genomics market, by technology & application, 2018 - 2030 (USD Million)
Table 82 Middle East & Africa genomics market, by deliverables, 2018 - 2030 (USD Million)
Table 83 Middle East & Africa genomics market, by End-use, 2018 - 2030 (USD Million)
Table 84 South Africa genomics market, by technology & application, 2018 - 2030 (USD Million)
Table 85 South Africa genomics market, by deliverables, 2018 - 2030 (USD Million)
Table 86 South Africa genomics market, by End-use, 2018 - 2030 (USD Million)
Table 87 Saudi Arabia genomics market, by technology & application, 2018 - 2030 (USD Million)
Table 88 Saudi Arabia genomics market, by deliverables, 2018 - 2030 (USD Million)
Table 89 Saudi Arabia genomics market, by End-use, 2018 - 2030 (USD Million)
Table 90 UAE genomics market, by technology & application, 2018 - 2030 (USD Million)
Table 91 UAE genomics market, by deliverables, 2018 - 2030 (USD Million)
Table 92 UAE genomics market, by End-use, 2018 - 2030 (USD Million)
Table 93 Kuwait genomics market, by technology & application, 2018 - 2030 (USD Million)
Table 94 Kuwait genomics market, by deliverables, 2018 - 2030 (USD Million)
Table 95 Kuwait genomics market, by End-use, 2018 - 2030 (USD Million)
Table 96 Participant's overview
Table 97 Financial performance
Table 98 Key companies undergoing expansions
Table 99 Key companies undergoing acquisitions
Table 100 Key companies undergoing collaborations
Table 101 Key companies launching new products/services
Table 102 Key companies undertaking other strategies
List of Figures
Fig. 1 Genomics market segmentation
Fig. 2 Market research process
Fig. 3 Data triangulation techniques
Fig. 4 Primary research pattern
Fig. 5 Market research approaches
Fig. 6 Value-chain-based sizing & forecasting
Fig. 7 QFD modeling for market share assessment
Fig. 8 Market formulation & validation
Fig. 9 Market snapshot
Fig. 10 Segment snapshot
Fig. 11 Competitive landscape snapshot
Fig. 12 Parent market outlook
Fig. 13 Related/ancillary market outlook
Fig. 14 Genomics - Industry value chain analysis
Fig. 15 Genomics market driver analysis
Fig. 16 Genomics market restraint analysis
Fig. 17 Genomics market: Porter's analysis
Fig. 18 Genomics market: application & technology outlook and key takeaways
Fig. 19 Genomics market: Application & technology market share analysis, 2022 - 2030
Fig. 20 Global sequencing by Functional Genomics market, 2018 - 2030 (USD Million)
Fig. 21 Global sequencing by Real-time PCR market, 2018 - 2030 (USD Million)
Fig. 22 Global sequencing by Transfection market, 2018 - 2030 (USD Million)
Fig. 23 Global sequencing by SNP analysis market, 2018 - 2030 (USD Million)
Fig. 24 Global sequencing by Mutational analysis market, 2018 - 2030 (USD Million)
Fig. 25 Global sequencing by Microarray analysis market, 2018 - 2030 (USD Million)
Fig. 26 Global sequencing by RNA interference market, 2018 - 2030 (USD Million)
Fig. 27 Global sequencing by Epigenomics market, 2018 - 2030 (USD Million)
Fig. 28 Global sequencing by Bisulfite sequencing market, 2018 - 2030 (USD Million)
Fig. 29 Global sequencing by Microarray analysis market, 2018 - 2030 (USD Million)
Fig. 30 Global sequencing by Chromatin immunoprecipitation (ChIP & ChIP-Seq) market, 2018 - 2030 (USD Million)
Fig. 31 Global sequencing by Methylated DNA immunoprecipitation (MeDIP) market, 2018 - 2030 (USD Million)
Fig. 32 Global sequencing by High resolution melt (HRM) market, 2018 - 2030 (USD Million)
Fig. 33 Global sequencing by Chromatin accessibility assays market, 2018 - 2030 (USD Million)
Fig. 34 Global sequencing by Pathway Analysis market, 2018 - 2030 (USD Million)
Fig. 35 Global sequencing by Microarray analysis market, 2018 - 2030 (USD Million)
Fig. 36 Global sequencing by Bead-based analysis market, 2018 - 2030 (USD Million)
Fig. 37 Global sequencing by Proteomics tools (2-D PAGE; yeast 2-hybrid studies) market, 2018 - 2030 (USD Million)
Fig. 38 Global sequencing by Real-time PCR market, 2018 - 2030 (USD Million)
Fig. 39 Global sequencing by Biomarker Discovery market, 2018 - 2030 (USD Million)
Fig. 40 Global sequencing by DNA sequencing market, 2018 - 2030 (USD Million)
Fig. 41 Global sequencing by Microarray analysis market, 2018 - 2030 (USD Million)
Fig. 42 Global sequencing by Real-time PCR market, 2018 - 2030 (USD Million)
Fig. 43 Global sequencing by Mass spectrometry market, 2018 - 2030 (USD Million)
Fig. 44 Global sequencing by Statistical analysis market, 2018 - 2030 (USD Million)
Fig. 45 Global sequencing by Bioinformatics market, 2018 - 2030 (USD Million)
Fig. 46 Global sequencing by Products market, 2018 - 2030 (USD Million)
Fig. 47 Global sequencing by Services market, 2018 - 2030 (USD Million)
Fig. 48 Global sequencing by Instruments/Systems/Softwares market, 2018 - 2030 (USD Million)
Fig. 49 Global sequencing by Consumables & Reagents market, 2018 - 2030 (USD Million)
Fig. 50 Global sequencing by NGS-based Services market, 2018 - 2030 (USD Million)
Fig. 51 Global sequencing by Core Genomics Services market, 2018 - 2030 (USD Million)
Fig. 52 Global sequencing by Biomarker Translation Services market, 2018 - 2030 (USD Million)
Fig. 53 Global sequencing by Computational Services market, 2018 - 2030 (USD Million)
Fig. 54 Global sequencing by Others market, 2018 - 2030 (USD Million)
Fig. 55 Global sequencing by Pharmaceutical and Biotechnology Companies market, 2018 - 2030 (USD Million)
Fig. 56 Global sequencing by Hospitals and Clinics market, 2018 - 2030 (USD Million)
Fig. 57 Global sequencing by Academic and Government Institutes market, 2018 - 2030 (USD Million)
Fig. 58 Global sequencing by Clinical Research market, 2018 - 2030 (USD Million)
Fig. 59 Global sequencing by Other End-uses market, 2018 - 2030 (USD Million)
Fig. 60 Regional marketplace: Key takeaways
Fig. 61 Regional marketplace: Key takeaways
Fig. 62 North America genomics market estimates and forecast, 2018 - 2030 (USD Million)
Fig. 63 U.S. key country dynamics
Fig. 64 U.S. genomics market estimates and forecast, 2018 - 2030 (USD Million)
Fig. 65 Canada key country dynamics
Fig. 66 Canada genomics market, 2018 - 2030 (USD Million)
Fig. 67 Europe genomics market estimates and forecast, 2018 - 2030 (USD Million)
Fig. 68 UK key country dynamics
Fig. 69 UK genomics market estimates and forecast, 2018 - 2030 (USD Million)
Fig. 70 Germany key country dynamics
Fig. 71 Germany genomics market estimates and forecast, 2018 - 2030 (USD Million)
Fig. 72 France key country dynamics
Fig. 73 France genomics market estimates and forecast, 2018 - 2030 (USD Million)
Fig. 74 Italy key country dynamics
Fig. 75 Italy genomics market estimates and forecast, 2018 - 2030 (USD Million)
Fig. 76 Spain key country dynamics
Fig. 77 Spain genomics market estimates and forecast, 2018 - 2030 (USD Million)
Fig. 78 Denmark key country dynamics
Fig. 79 Denmark genomics market estimates and forecast, 2018 - 2030 (USD Million)
Fig. 80 Sweden key country dynamics
Fig. 81 Sweden genomics market estimates and forecast, 2018 - 2030 (USD Million)
Fig. 82 Norway key country dynamics
Fig. 83 Norway genomics market estimates and forecast, 2018 - 2030 (USD Million)
Fig. 84 Asia-Pacific genomics market estimates and forecast, 2018 - 2030 (USD Million)
Fig. 85 Japan key country dynamics
Fig. 86 Japan genomics market estimates and forecast, 2018 - 2030 (USD Million)
Fig. 87 China key country dynamics
Fig. 88 China genomics market estimates and forecast, 2018 - 2030 (USD Million)
Fig. 89 India key country dynamics
Fig. 90 India genomics market estimates and forecast, 2018 - 2030 (USD Million)
Fig. 91 Australia key country dynamics
Fig. 92 Australia genomics market estimates and forecast, 2018 - 2030 (USD Million)
Fig. 93 Thailand key country dynamics
Fig. 94 Thailand genomics market estimates and forecast, 2018 - 2030 (USD Million)
Fig. 95 South Korea key country dynamics
Fig. 96 South Korea genomics market estimates and forecast, 2018 - 2030 (USD Million)
Fig. 97 Latin America genomics market estimates and forecast, 2018 - 2030 (USD Million)
Fig. 98 Brazil key country dynamics
Fig. 99 Brazil genomics market estimates and forecast, 2018 - 2030 (USD Million)
Fig. 100 Mexico key country dynamics
Fig. 101 Mexico genomics market estimates and forecast, 2018 - 2030 (USD Million)
Fig. 102 Argentina key country dynamics
Fig. 103 Argentina genomics market estimates and forecast, 2018 - 2030 (USD Million)
Fig. 104 MEA genomics market estimates and forecast, 2018 - 2030 (USD Million)
Fig. 105 South Africa key country dynamics
Fig. 106 South Africa genomics market estimates and forecast, 2018 - 2030 (USD Million)
Fig. 107 Saudi Arabia key country dynamics
Fig. 108 Saudi Arabia genomics market estimates and forecast, 2018 - 2030 (USD Million)
Fig. 109 UAE key country dynamics
Fig. 110 UAE genomics market estimates and forecast, 2018 - 2030 (USD Million)
Fig. 111 Kuwait key country dynamics
Fig. 112 Kuwait genomics market estimates and forecast, 2018 - 2030 (USD Million)
Fig. 113 Key company categorization
Fig. 114 Company market positioning
Fig. 115 Market participant categorization
Fig. 116 Strategy framework
Market Segmentation
The growth of genomic data pool from research studies has helped in the investigation of genetic predisposition for some of the diseases. The clinical application of this data pool is expected to transform the healthcare system related to the provision of more effective, reliable, and accurate, disease management solutions. Clinical centers like Stanford Health Care have begun using available genomic information to devise personalized treatment regimes which can help bridge the gap between clinical diagnosis & treatment and translational research. Various health fields hold important health data in a variety of different formats and systems such as pathology, genomics, and radiology, CT & MRI scans, etc.
Prenatal genetic screening programs can help pregnant women recognize genetic abnormalities in the fetus. Every newborn's genome can be sequenced and saved in an electronic medical record for the next 10 years. To maintain their competitive edge in the market, emerging companies have introduced a variety of genetic tests after assessing the potential market of genomics in newborn screening. The combined approach of pharmacogenomics and newborn screening programs is expected to support the improvement of evidence-based disease treatment. Since the information will be stored within a newborn’s medical record, it can be utilized at any point in their lifetime.
The amount of data produced due to genomic studies poses formidable challenges for its storage, interpretation, transfer, and security. Conversion of the obtained sequenced data into conclusive biological insights is of utmost importance. It can be carried out by the use of efficient data management tools. Declining sequencing costs and increasing number of sequence reads are boosting the demand for computational tools. For the market to grow worldwide, proper and scalable storage solutions are required. The major concern about this is the privacy and security of the genetic information. Genetic information about an individual provides presumptive information about other blood relatives. Such genomic data causes legal, ethical, and social challenges.
This section will provide insights into the contents included in this genomics market report and help gain clarity on the structure of the report to assist readers in navigating smoothly.
Industry overview
Industry trends
Market drivers and restraints
Market size
Growth prospects
Porter’s analysis
PESTEL analysis
Key market opportunities prioritized
Competitive landscape
Company overview
Financial performance
Product benchmarking
Latest strategic developments
Market size, estimates, and forecast from 2018 to 2030
Market estimates and forecast for product segments up to 2030
Regional market size and forecast for product segments up to 2030
Market estimates and forecast for application segments up to 2030
Regional market size and forecast for application segments up to 2030
Company financial performance
A three-pronged approach was followed for deducing the genomics market estimates and forecasts. The process has three steps: information procurement, analysis, and validation. The whole process is cyclical, and steps repeat until the estimates are validated. The three steps are explained in detail below:
Information procurement: Information procurement is one of the most extensive and important stages in our research process, and quality data is critical for accurate analysis. We followed a multi-channel data collection process for genomics market to gather the most reliable and current information possible.
Analysis: We mine the data collected to establish baselines for forecasting, identify trends and opportunities, gain insight into consumer demographics and drivers, and so much more. We utilized different methods of genomics market data depending on the type of information we’re trying to uncover in our research.
Market Research Efforts: Bottom-up Approach for estimating and forecasting demand size and opportunity, top-down Approach for new product forecasting and penetration, and combined approach of both Bottom-up and Top-down for full coverage analysis.
Value-Chain-Based Sizing & Forecasting: Supply-side estimates for understanding potential revenue through competitive benchmarking, forecasting, and penetration modeling.
Demand-side estimates for identifying parent and ancillary markets, segment modeling, and heuristic forecasting.
Qualitative Functional Deployment (QFD) Modelling for market share assessment.
Market formulation and validation: We mine the data collected to establish baselines for forecasting, identify trends and opportunities, gain insight into consumer demographics and drivers, and so much more. We utilize different methods of data analysis depending on the type of information we’re trying to uncover in our research.
Market Formulation: This step involves the finalization of market numbers. This step on an internal level is designed to manage outputs from the Data Analysis step.
Data Normalization: The final market estimates and forecasts are then aligned and sent to industry experts, in-panel quality control managers for validation.
This step also entails the finalization of the report scope and data representation pattern.
Validation: The process entails multiple levels of validation. All these steps run in parallel, and the study is forwarded for publishing only if all three levels render validated results.
The genomics market was categorized into four segments, namely application & technology (Functional Genomics, Epigenomics, Pathway Analysis, Biomarker Discovery), technology (Sequencing, PCR, Flow Cytometry, Microarrays), deliverables (Products, Services), end-use (Clinical Research, Academic & Government Institutes, Hospitals & Clinics, Pharmaceutical & Biotechnology Companies) and region (North America, Europe, Asia Pacific, Latin America, Middle East & Africa).
The genomics market was segmented into application & technology, technology, deliverables, end-use, and regions. The demand at a segment level was deduced using a funnel method. Concepts like the TAM, SAM, SOM, etc., were put into practice to understand the demand. We at GVR deploy three methods to deduce market estimates and determine forecasts. These methods are explained below:
Demand estimation of each product across countries/regions summed up to from the total market.
Variable analysis for demand forecast.
Demand estimation via analyzing paid database, and company financials either via annual reports or paid database.
Primary interviews for data revalidation and insight collection.
Used extensively for new product forecasting or analyzing penetration levels.
Tool used invoice product flow and penetration models Use of regression multi-variant analysis for forecasting Involves extensive use of paid and public databases.
Primary interviews and vendor-based primary research for variable impact analysis.
The genomics market was analyzed at a regional level. The global was divided into North America, Europe, Asia Pacific, Latin America, and Middle East & Africa, keeping in focus variables like consumption patterns, export-import regulations, consumer expectations, etc. These regions were further divided into twenty-three countries, namely, the U.S.; Canada; the UK.; Germany; France; Italy; Spain; Denmark; Sweden; Norway; Japan; China; India; Australia; Thailand; South Korea; Brazil; Mexico, Argentina; South Africa; Saudi Arabia, UAE; Kuwait.
All three above-mentioned market research methodologies were applied to arrive at regional-level conclusions. The regions were then summed up to form the global market.
The genomics market was analyzed via companies operating in the sector. Analyzing these companies and cross-referencing them to the demand equation helped us validate our assumptions and conclusions. Key market players analyzed include:
Agilent Technologies, Inc.: Agilent Technologies, Inc. provides analytical instruments & software for analytical scientists & clinical researchers. The company has operations in diagnostics, pharmaceuticals, food, chemical & energy, environmental & forensics, and research segments.
Bio-Rad Laboratories, Inc.: Bio-Rad Laboratories, Inc. is involved in the manufacturing of systems & products used in separating complex biological and chemical materials, as well as analyzing, identifying, and purifying their respective components.
BGI: BGI is one of the leading providers of integrated solutions in precision medicine. It offers proteomic and integrated genomic sequencing solutions to a range of pharmaceutical companies & academic institutes.
Color Health, Inc.: Color Health, Inc. is a leading healthcare company that provides genetic tests and analysis globally. The product focuses on genes that indicate risk for heart disease, cancer, and that affect medication response.
Danaher: Danaher is known for designing, manufacturing, and marketing products & services to industrial, professional, commercial, & medical customers. The company operates through three main business segments: life sciences, environmental & applied solutions, and diagnostics.
QIAGEN: QIAGEN provides samples and assay technologies for academic research, applied testing, molecular diagnostics, and pharmaceutical research. Its products include consumable kits and automation systems offered for NGS, cancer research, forensics, informatics, oncology, infectious diseases, and TB management.
Eppendorf SE: Eppendorf SE develops and distributes various systems for laboratory use such as instruments, consumables, and services for cell-, sample-, and liquid-handling laboratory requirements. Its products include dispensers, mixers, centrifuges, DNA amplification equipment, spectrometers, and pipette & automated pipetting systems.
F. Hoffmann-La Roche Ltd.F. Hoffmann-La Roche’s business operations are organized into pharmaceuticals and diagnostics. Its product portfolio includes blood glucose meters, point-of-care testing devices, high throughput analyzers for commercial & hospital diagnostic laboratories, and reagents & instruments for life sciences research.
Eurofins Scientific: Eurofins Scientific is a global leader in environment, discovery pharmacology, advanced material science, pharmaceutical & cosmetic product testing, agroscience contract research services, and genomics.
GE Healthcare: GE Healthcare operates as a subsidiary of GE. General Electric (GE) is a multinational conglomerate and a provider of technology and financial services in the areas of power generating, aviation engines, household appliances, water processing, medical imaging, and corporate and consumer finance.
Supply Side Estimates
Company revenue estimation via referring to annual reports, investor presentations, and Hoover’s.
Segment revenue determination via variable analysis and penetration modeling.
Competitive benchmarking to identify market leaders and their collective revenue shares.
Forecasting via analyzing commercialization rates, pipelines, market initiatives, distribution networks, etc.
Demand side estimates
Identifying parent markets and ancillary markets
Segment penetration analysis to obtain pertinent
revenue/volume
Heuristic forecasting with the help of subject matter experts
Forecasting via variable analysis
Understanding market dynamics (in terms of drivers, restraints, & opportunities) in the countries.
Understanding trends & variables in the individual countries & their impact on growth and using analytical tools to provide high-level insights into the market dynamics and the associated growth pattern.
Understanding market estimates and forecasts (with the base year as 2023, historic information from 2018 to 2023, and forecast from 2024 to 2030). Regional estimates & forecasts for each category are available and are summed up to form the global market estimates.
The report provides market value for the base year 2023 and a yearly forecast till 2030 in terms of revenue/volume or both. The market for each of the segment outlooks has been provided on region & country basis for the above-mentioned forecast period.
The key industry dynamics, major technological trends, and application markets are evaluated to understand their impact on the demand for the forecast period. The growth rates were estimated using correlation, regression, and time-series analysis.
We have used the bottom-up approach for market sizing, analyzing key regional markets, dynamics, & trends for various products and end-users. The total market has been estimated by integrating the country markets.
All market estimates and forecasts have been validated through primary interviews with the key industry participants.
Inflation has not been accounted for to estimate and forecast the market.
Numbers may not add up due to rounding off.
Europe consists of EU-8, Central & Eastern Europe, along with the Commonwealth of Independent States (CIS).
Asia Pacific includes South Asia, East Asia, Southeast Asia, and Oceania (Australia & New Zealand).
Latin America includes Central American countries and the South American continent
Middle East includes Western Asia (as assigned by the UN Statistics Division) and the African continent.
GVR strives to procure the latest and unique information for reports directly from industry experts, which gives it a competitive edge. Quality is of utmost importance to us, therefore every year we focus on increasing our experts’ panel. Primary interviews are one of the critical steps in identifying recent market trends and scenarios. This process enables us to justify and validate our market estimates and forecasts to our clients. With more than 8,000 reports in our database, we have connected with some key opinion leaders across various domains, including healthcare, technology, consumer goods, and the chemical sector. Our process starts with identifying the right platform for a particular type of report, i.e., emails, LinkedIn, seminars, or telephonic conversation, as every report is unique and requires a differentiated approach.
We send out questionnaires to different experts from various regions/ countries, which is dependent on the following factors:
Report/Market scope: If the market study is global, we send questionnaires to industry experts across various regions, including North America, Europe, Asia Pacific, Latin America, and MEA.
Market Penetration: If the market is driven by technological advancements, population density, disease prevalence, or other factors, we identify experts and send out questionnaires based on region or country dominance.
The time to start receiving responses from industry experts varies based on how niche or well-penetrated the market is. Our reports include a detailed chapter on the KoL opinion section, which helps our clients understand the perspective of experts already in the market space.
"The quality of research they have done for us has been excellent."