- Home
- »
- Biotechnology
- »
-
Gene Therapy Market Size, Share & Trends Report, 2030GVR Report cover
![Gene Therapy Market Size, Share & Trends Report]()
Gene Therapy Market (2024 - 2030) Size, Share & Trends Analysis Report By Indication (Acute Lymphoblastic Leukemia, Large B-cell Lymphoma), By Vector Type (Lentivirus), By Route Of Administration, By Region, And Segment Forecasts
- Report ID: GVR-2-68038-179-5
- Number of Report Pages: 120
- Format: PDF
- Historical Range: 2018 - 2023
- Forecast Period: 2024 - 2030
- Industry: Healthcare
- Report Summary
- Table of Contents
- Segmentation
- Methodology
- Download FREE Sample
-
Download Sample Report
Gene Therapy Market Summary
The global gene therapy market size was estimated at USD 5.54 billion in 2023 and is projected to reach USD 18.20 billion by 2030, growing at a CAGR of 18.88% from 2024 to 2030. The market growth is attributed to many factors such as the expanding area of advanced therapies along with gene delivery technologies and progressive competition among key players focused on commercialization of their therapies.
Key Market Trends & Insights
- North America dominated the market in 2023 with the largest revenue share of 18.95% in 2023.
- The U.S. is the largest market for clinical trials related to gene therapy, as around 50% of all clinical trials.
- The Asia Pacific gene therapy market held a significant CAGR of 18.40% over the forecast period.
- By indication, the spinal muscular atrophy (SMA) segment dominated the market in 2023.
- By route of administration, the intravenous segment dominated the global gene therapy market in 2023.
Market Size & Forecast
- 2023 Market Size: USD 5.54 Billion
- 2030 Projected Market Size: USD 18.20 Billion
- CAGR (2024-2030): 18.88%
- North America: Largest market in 2023
- Asia Pacific: Fastest growing market
The biotechnology companies are investing in acquisitions, mergers/collaborations, and deals as a key strategy to increase in-house expertise and strengthen the product pipelines. The COVID-19 outbreak has negatively impacted the market growth. This sector has experienced severe disruption due to COVID-19, which has historically presented significant challenges in the supply of materials, manufacturing, and logistics operations. For instance, companies had lengthy delivery times for specific components. They later discovered that it was short on clinical trial supplies when a partner contract manufacturing company was compelled to shut down.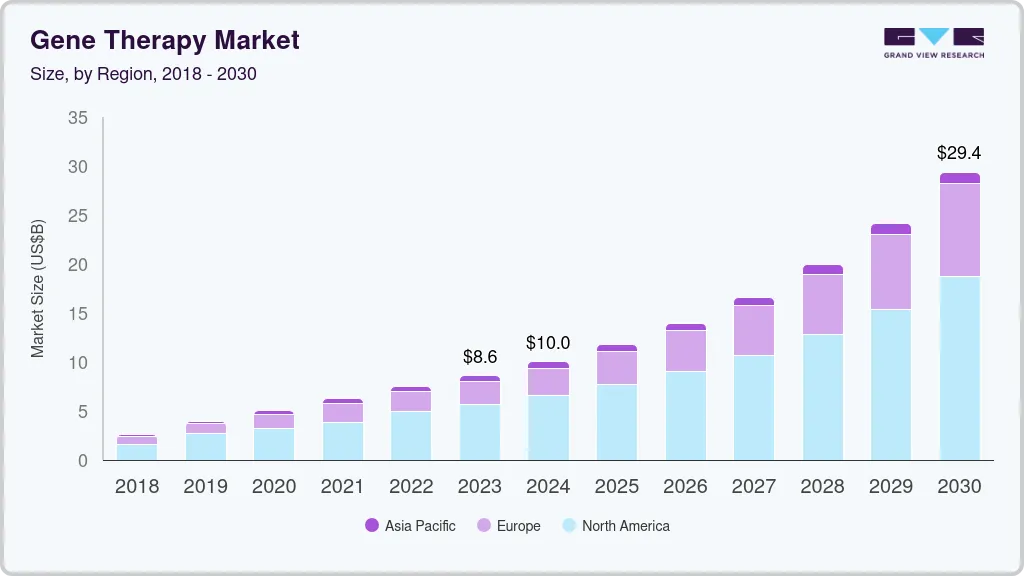
The COVID-19 outbreak has negatively impacted the market growth. This sector has experienced severe disruption due to COVID-19, which has historically presented significant challenges in the supply of materials, manufacturing, and logistics operations. For instance, companies had lengthy delivery times for specific components. They later discovered that it was short on clinical trial supplies when a partner contract manufacturing company was compelled to shut down.
The robust pipeline is expected to boost the market growth over the forecast period. Researchers are working to make gene therapy available at clinics. Various universities and institutes exhibit a broad portfolio of products in the pipeline which is expected to boost revenue generation over the forecast period. Clinical trials for gene therapy increased significantly from 2017 to 2018, after the FDA approved the first gene therapy. According to the American Society of Gene & Cell Therapy (ASGCT), around 1,986 products, including CAR T-cell therapies and other genetically modified cell therapies, are currently under development.
Moreover, improving regulatory support creates growth opportunities for the market over the forecast period. Several positive changes have been made by many international regulatory organizations to promote therapies. Support for CAR-T technology from the FDA is one of the examples. In phase II and III studies, in particular, regulators allow flexibility in the usual hierarchy of how clinical trials are conducted. Moreover, the FDA expects 10 to 20 new therapies to be approved annually by 2025.
Furthermore, an increase in funding and investments in this sector is expected to provide lucrative growth opportunities to market players. Several biopharma companies are investing in this sector for novel product launches. For instance, in January 2022, Ori Biotech raised more than USD 100.0 million in Series B funding to introduce a novel cell & gene therapy developing platform. This funding allowed for a rapid transition from pre-commercialization to market launch.
Market Concentration & Characteristics
Market growth of gene therapy is exponential and market growth is accelerating. The increasing number of approvals of gene therapies within North America and Europe are the major reasons for market growth. Furthermore, a strong pipeline of numerous companies is anticipated to bring new therapies to the market.
Some of the major strategies opted by the companies include increased spending on R&D and new product launches. For instance, in December 2023, the U.S. FDA approved a gene therapy for treating sickle cell disease. This is the first gene therapy that is based on CRISPR gene editing. Such new launches are expected to fuel the market growth over the forecast period.
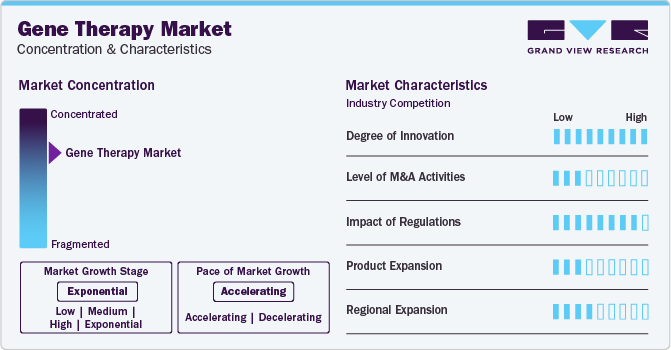
The gene therapy market is highly impacted by regulations. Regional regulatory bodies such as the U.S. Food and Drug Administration, European Medicines Agency, and more are responsible for all the approvals of therapies. Lengthy approval processes and clinical trials limit the entry of new players within the market.
The market’s low to moderate product expansion is driven by several factors: rigorous regulatory challenges, high development and manufacturing costs, technical complexities in delivery systems, niche markets targeting rare diseases, and competitive patent landscapes. Additionally, high treatment costs and reimbursement issues further slow market growth.
Currently, North America and Europe are the regions that have the most approved gene therapies as of January 2024. However, in countries such as India, South Korea, and Japan, a large number of clinical trials are being undertaken for various conditions. For instance, in July 2023, a team of researchers at the Narayana Nethralaya announced that they would be starting a clinical trial for a gene therapy for ocular diseases.
Vector Insights
The AAV segment shows a significant revenue contribution of 22% in 2023. Several biopharma companies are offering their viral vector platform for the development of AAV-based gene therapy products. For instance, in September 2016, Lonza signed an exclusive agreement with Massachusetts Eye and Ear to support its novel Anc-AAV gene therapy platform for the development and commercialization of next-generation gene therapies based on their AAV platform. Similarly, RegenxBio had made an agreement with companies AveXis & Biogen in March 2014 and May 2016, respectively, which would allow both companies to use RegenxBio’s AAV vector platform for the development of gene therapy molecules.
Furthermore, in May 2021, Biogen Inc. and Capsigen Inc. entered into a strategic research partnership to engineer novel AAV capsids that can deliver transformative gene therapies, which can address the fundamental genetic causes of numerous neuromuscular and CNS disorders. In July 2021, the U.S. Department of Commerce’s National Institute of Standards and Technology (NIST), National Institute for Innovation in Manufacturing Biopharmaceuticals (NIIMBL), and United States Pharmacopeia (USP) announced a collaboration to evaluate analytical methods and develop standards for AAV. As part of this partnership, NIST and USP will be conducting an interlaboratory study in which several laboratories will measure these serious quality attributes, and their results will be linked and examined. This collaboration will support the development of new promising gene therapies that will significantly advance people’s lives.
Indication Insights
The spinal muscular atrophy (SMA) segment dominated the market in 2023. Although SMA is a rare disorder, it is one of the most common fatal inherited diseases of infancy. The development of Zolgensma (AVXS-101), has proven its effectiveness in treating SMA and altering the phenotype of the illness. The FDA approved Novartis' Zolgensma approval in May 2019, which is aimed at treating the underlying cause of SMA. As of now, Zolgensma is the only gene treatment in this field to have been approved. The approval of this gene therapy is evidence of the growing use of therapies to treat serious hereditary illnesses like SMA.
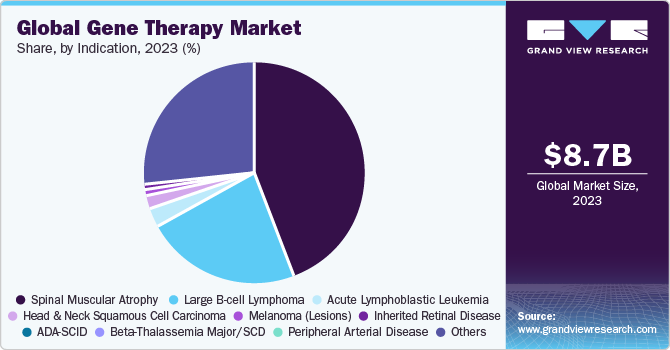
The Beta-Thalassemia Major/SCD segment is anticipated to register the fastest CAGR over the forecast period. Gene therapy for SCD and β-thalassemia is based on the transplantation of gene-modified hematopoietic stem cells. Clinical and preclinical studies have shown the efficacy and safety of this therapeutic modality. However, several other factors, such as suboptimal gene expression levels & gene transfer efficiency, limited stem-cell dose and quality, and toxicity of myeloablative regimens are still hampering its efficacy.
Despite these challenges, in June 2019, bluebird Bio’s Zynteglo (formerly LentiGlobin) received conditional approval in Europe for the treatment of β-thalassemia and is expected to receive U.S. FDA approval in August 2022. Moreover, the product has already received Orphan Drug status by the U.S. FDA for the treatment of patients with sickle cell disease (SCD). Furthermore, in April 2021, Vertex Pharmaceuticals and CRISPR Therapeutics amended the partnership for the development, production, and commercialization of CTX001 in sickle beta thalassemia and cell disease. These achievements in this segment are anticipated to significantly boost the adoption of the product in this segment.
Route of Administration Insights
The intravenous segment dominated the global gene therapy market in 2023, primarily due to its effectiveness in delivering treatments directly into the bloodstream, ensuring widespread distribution and rapid uptake by target cells. This method's ability to treat a wide range of conditions, coupled with advancements in vector design and delivery mechanisms, has made intravenous administration the preferred choice for many gene therapies, contributing significantly to its market leadership. The segment is also expected to emerge as the most lucrative over the forecast period.
Regional Insights
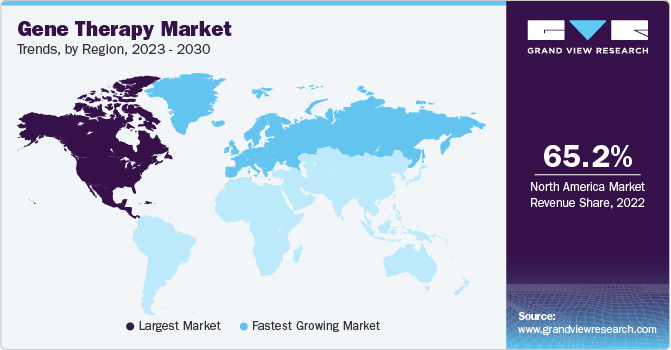
North America dominated the market in 2023 with the largest revenue share of 18.95% in 2023. This region is expected to become the largest routine manufacturer of gene therapy in terms of the number of approvals and revenue generated during the forecast period. Increasing investments in R&D from large and small companies in the development of ideal therapy drugs are anticipated to further boost the market.
U.S. Gene Therapy Market Trends
The U.S. is the largest market for clinical trials related to gene therapy, as around 50% of all clinical trials in the world are conducted in the country. As of March 2023, more than 2,500 clinical studies are under investigation in the U.S. alone.
Europe Gene Therapy Market Trends
Europe gene therapy market was identified as a lucrative region in this industry. This is attributed to its large population with unmet medical needs and increasing demand for novel technologies in the treatment of rare but increasingly prevalent diseases. Asia Pacific market for commercial application of genetic therapies is anticipated to witness significant growth in the forecast period, which can be attributed to the easy availability of resources, local presence of major companies, and increased investment, by the governments.
The UK gene therapy market is anticipated to witness accelerated growth over the forecast period, due to increased investments by various big companies and governments, including the NHS & research laboratories.
The gene therapy market in Germany is anticipated to grow significantly over the forecast period. In January 2020, a U.S.-based company-bluebird bio-launched its first gene therapy for transfusion-dependent beta-thalassemia (blood disorder) in Germany. apceth Biopharma- a German manufacturer-is working with bluebird for the production of Zynteglo, the gene therapy launched by bluebird.
Asia Pacific Gene Therapy Market Trends
The Asia Pacific gene therapy market held a significant CAGR of 18.40% over the forecast period. This upsurge is attributed to the high birth rate and high prevalence of genetic disorders because of various factors, such as consanguineous marriages and founder mutations.
The gene therapy market in China is expected to grow over the forecast period. In March 2019, Merck KgaA collaborated with GenScript- a Chinese biotech company-for the manufacturing of plasmids and viral vectors
Key Gene Therapy Company Insights
The market players operating in the gene therapy market are adopting product approval to increase the reach of their products in the market and improve the availability of their products in diverse geographical areas, along with expansion as a strategy to enhance production/research activities. In addition, several market players are acquiring smaller players to strengthen their market position. This strategy enables companies to increase their capabilities, expand their product portfolios, and improve their competencies.
Key Gene Therapy Companies:
The following are the leading companies in the gene therapy market. These companies collectively hold the largest market share and dictate industry trends.
- Amgen Inc.
- Novartis AG
- F. Hoffmann-La Roche
- Gilead Sciences, Inc.
- bluebird bio, Inc.
- Bristol-Myers Squibb Company
- Legend Biotech.
- BioMarin.
- uniQure N.V.
- Merck & Co.
- Sarepta Therapeutics, Inc.
- Krystal Biotech, Inc.
- CRISPR Therapeutics.
Recent Developments
-
In January 2024, Biogen and Ginkgo Bioworks announced the completion of their gene therapy collaboration involving AAV based vectors. This is expected to fuel the demand for gene therapies in the coming years.
-
In December 2023, the Swiss Agency for Therapeutic Products granted approval to Libmeldy for the treatment of early-onset metachromatic leukodystrophy.
-
In May 2023, Krystal Biotech was granted approval for VYJUVEK gene therapy for Dystrophic Epidermolysis Bullosa treatment
-
In June 2023, the U.S. FDA granted approval to Sarepta for ELEVIDYS gene therapy to treat DMD in children of age 4-5 years
-
In January 2023, Voyager Therapeutics and Neurocrine Biosciences entered into a strategic collaboration for the commercialization & development of Voyager’s GBA1 program and other next-generation gene therapies for neurological diseases
-
In January 2023, Spark Therapeutics and Neurochase established a strategic collaboration to develop Neurochase’s unique delivery technology for use with selected gene treatments for rare disorders in the CNS. In this agreement, Neurochase will contribute its extensive knowledge in direct drug delivery technology to Spark’s premier AAV platform.
-
In January 2022, 64x Bio, a U.S.-based biotech company, raised USD 55.0 million in funding to advance its gene therapy manufacturing platform. This initiative was expected to expand the company’s VectorSelect platform.
Gene Therapy Market Report Scope
Report Attribute
Details
Market size value in 2024
USD 6.45 billion
Revenue forecast in 2030
USD 18.20 billion
Growth rate
CAGR of 18.88% from 2024 to 2030
Actual data
2018 - 2023
Forecast period
2024 - 2030
Quantitative units
Revenue in USD million/billion, CAGR from 2024 to 2030
Report coverage
Revenue forecast, company ranking, competitive landscape, growth factors, trends
Segments covered
Vector type, indication, route of administration, region
Regional scope
North America; Europe; Asia Pacific; Rest of World
Country scope
U.S.; Canada; Mexico; UK; Germany; Switzerland; Japan; China; South Korea; Australia
Key companies profiled
Amgen Inc.; Novartis AG; F. Hoffmann-La Roche; Gilead Sciences, Inc.; bluebird bio, Inc.; Bristol-Myers Squibb Company; Legend Biotech.; BioMarin.; uniQure N.V.; Merck & Co.; Sarepta Therapeutics, Inc.; Krystal Biotech, Inc.; CRISPR Therapeutics.
Customization scope
Free report customization (equivalent up to 8 analyst’s working days) with purchase. Addition or alteration to country, regional & segment scope.
Global Gene Therapy Market Report Segmentation
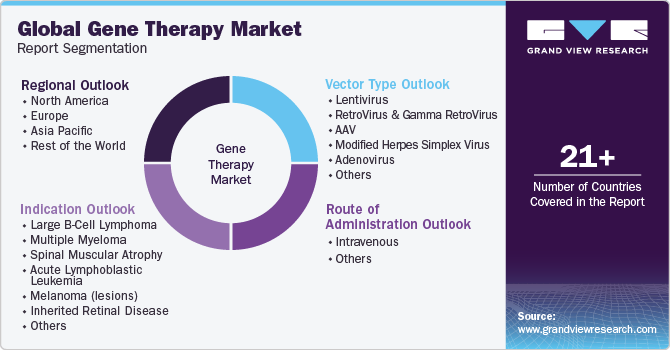
This report forecasts revenue growth at global, regional, and country levels in addition to provides an analysis of the latest industry trends in each of the subsegments from 2018 to 2030. For this study, Grand View Research has segmented the global gene therapy market report based on indication, vector type, route of administration, and region:
-
Indication Outlook (Revenue, USD Million, 2018 - 2030)
-
Large B-Cell Lymphoma
-
Multiple Myeloma
-
Spinal Muscular Atrophy (SMA)
-
Acute Lymphoblastic Leukemia (ALL)
-
Melanoma (lesions)
-
Inherited Retinal Disease
-
Beta-Thalassemia Major/SCD
-
Others
-
-
Vector Type Outlook (Revenue, USD Million, 2018 - 2030)
-
Lentivirus
-
RetroVirus & gamma RetroVirus
-
AAV
-
Modified Herpes Simplex Virus
-
Adenovirus
-
Others
-
-
Route of Administration Outlook (Revenue, USD Million, 2018 - 2030)
-
Intravenous
-
Others
-
-
Regional Outlook (Revenue, USD Million, 2018 - 2030)
-
North America
-
U.S.
-
Canada
-
Mexico
-
-
Europe
-
UK
-
Germany
-
Switzerland
-
-
Asia Pacific
-
Japan
-
China
-
South Korea
-
Australia
-
-
Rest of the world
-
Frequently Asked Questions About This Report
b. The global gene therapy market size was estimated at USD 5.54 billion in 2023 and is expected to reach USD 6.45 billion in 2024.
b. The global gene therapy market is expected to grow at a compound annual growth rate of 18.88% from 2024 to 2030 to reach USD 18.20 billion by 2030.
b. North America dominated the gene therapy market with a share of 18.95% in 2023. This is attributable to rising healthcare awareness coupled with the growing demand for robust therapeutics to treat chronic illness.
b. Some key players operating in the gene therapy market include Amgen Inc., Novartis AG, F. Hoffmann-La Roche, Gilead Sciences, Inc., bluebird bio, Inc., Bristol-Myers Squibb Company, and Legend Biotech among others
b. Key factors that are driving the gene therapy market growth include recent approval of products such as Zolgensma and Vyjuvek which has accelerated investment in clinical trials of pipeline programs.
Share this report with your colleague or friend.
Need a Tailored Report?
Customize this report to your needs — add regions, segments, or data points, with 20% free customization.

ISO 9001:2015 & 27001:2022 Certified
We are GDPR and CCPA compliant! Your transaction & personal information is safe and secure. For more details, please read our privacy policy.
Trusted market insights - try a free sample
See how our reports are structured and why industry leaders rely on Grand View Research. Get a free sample or ask us to tailor this report to your needs.


