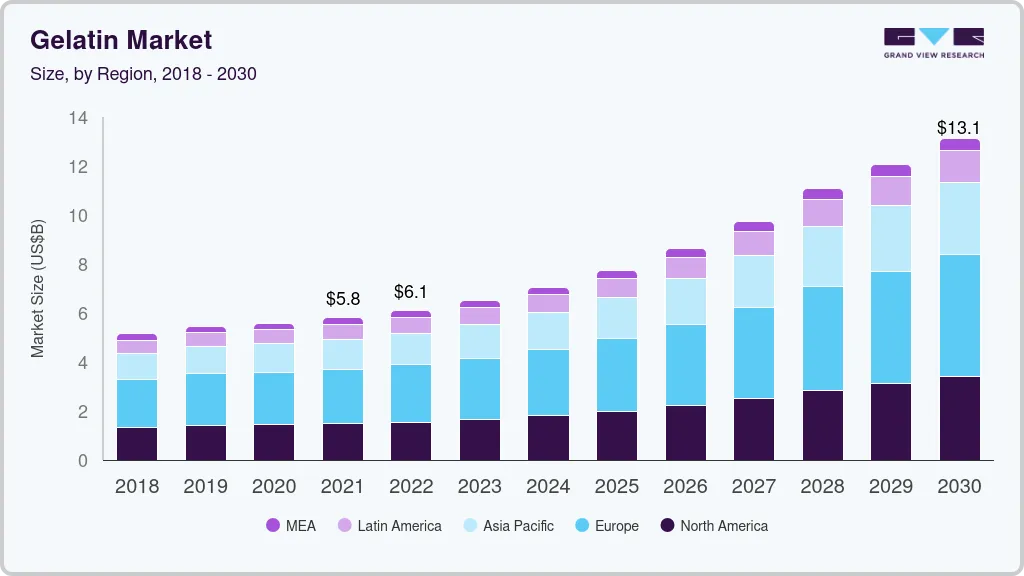
The global gelatin market size was valued at USD 6.51 billion in 2023 and is anticipated to grow at a compound annual growth rate (CAGR) of 10.1% from 2024 to 2030. Gelatin is anticipated to witness high demand from functional food application, due to its ability to prevent several diseases, improve food quality, and in food fortification. Gelatin is a highly viscous semi-solid gel; its composition includes 2% to 4% mineral salts, 85% to 90% protein, and 8% to 12% water. Its most common form commercially available is edible gelatin, which does not contain any other preservatives or additives. Non-edible products are mostly used in photography (nail photographic films & papers, glue, and polish) and cosmetics.
Gelatin is derived from collagen, which is a natural protein present in the skin and bones. Raw materials including pig skin, bovine hides, and bones are primarily obtained from slaughterhouses. As a protein, it contains numerous amino acids, which makes it useful in a wide range of applications including foods, beverages, pharmaceuticals, and cosmetics among others.
The prices of gelatin vary depending on the prices of its raw materials. It also depends on the region or country where the product is being manufactured. The prices of raw materials are rising at a moderate rate on the account of the growing demand from end-use industries, especially food & beverage, and healthcare. In addition, the rise in demand is likely to be catered to by new production facilities in countries such as the U.S. and India. Furthermore, improvements in the supply chain and an increase in production levels may lead to a stability in the prices of products in the coming years.
The key players in the global gelatin market comprise of GELITA AG, Rousselot Weishardt Holding SA, Nitta Gelatin Inc., and STERLING GELATIN among others. These companies dominate the market with their strong product portfolio and regional presence. In addition, manufacturers are focusing on sustainable production, in-house R&D, customized product offerings, and technology licensing to attain a competitive edge in the market space. For example, in January 2021, Nitta Gelatin India Ltd. launched premium gelatin product manufactured with Japanese technology of international standards for food application.
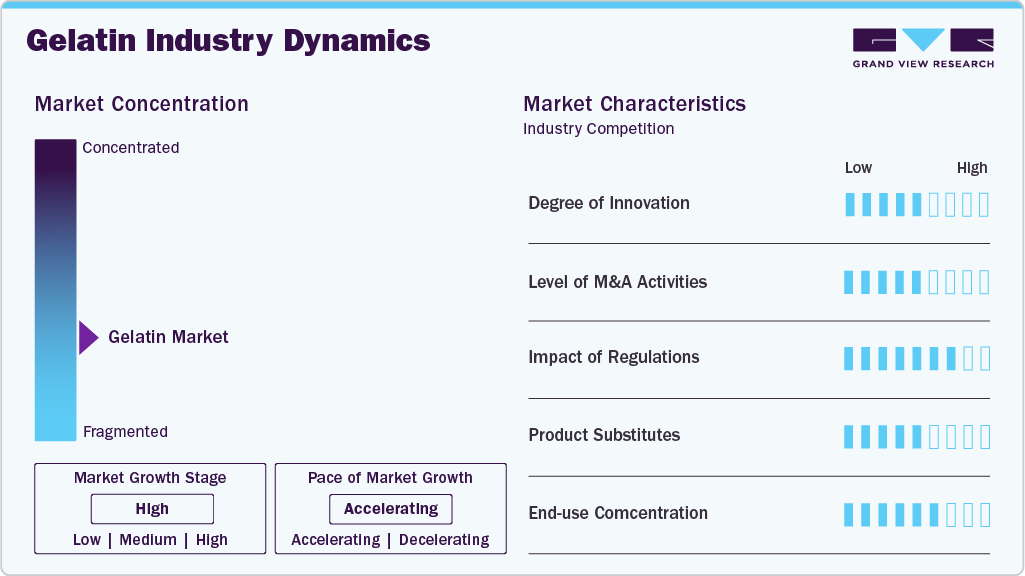
The gelatin market is concentrated in nature with top four players dominating the market. GELITA AG occupied largest market share of approximately 26.0% in 2023 and sells its pork and beef-derived product to buyers operating in the food, pharmaceutical, and cosmetic sectors. GELITA AG was followed by Netherlands-based company “Rousselot” with a market share of 22% in 2023.
The company had a global presence through its subsidiaries located in the U.S., Canada, Brazil, China, Australia, and New Zealand. Manufacturers are focused on product innovation to cater to niche applications with customized solutions in order to acquire market share. Increasing product development with a specific focus on nutraceutical and pharmaceutical applications is projected to be a critical factor in increasing market share.
The market has witnessed noteworthy expansion in terms of global manufacturers’ production capacity. The key market players are collaborating with distributors in order to gain more market penetration. New product development coupled with increasing R&D activities is likely to result in intense competition in the market space. Compliance with regulatory norms for raw material procurement, manufacturing, and distribution coupled with acquiring certifications has driven out as a notable winning factor for producers involved in domestic as well as offshore businesses. Integration across the value chain helps market players to negate the participation of external players and maximize profits. In addition, a significant focus on product innovation to cater to niche applications with customized solutions is projected to remain a critical success factor for market participants.
Food & beverages application dominated the market with the highest revenue share of 56.7% in 2023. Its high share is attributable to increasing demand for various food & beverages products such as desserts, functional food products, functional beverages, confectionery products, and meat products around the world.
Functional food products comprise of additional enhanced nutritional properties that helps in providing various health benefits like improved immunity and reduced fatigue. According to New Food Magazine, as a result of COVID-19, many people have evaluated their attitudes toward health, diet, and wellness during the past two years. More than ever, consumers are now making the connection between their eating habits and health. Furthermore, the demand for immunity booster products saw a sharp rise in the wake of COVID-19 pandemic. This trend is expected to continue and thus likely to positively impact the market growth for functional food in the coming years.
In addition, gelatin is used in pharmaceutical and healthcare industry for manufacturing capsules, emulsions, syrups, and tablets. It offers properties such as film forming, thermo-reversible gelling, and adhesiveness, which result in an increased preference among manufacturers for using gelatin in the manufacture of capsules. In addition, it is approved by the Food Drug Administration (FDA) for use in pharmaceutical and healthcare applications.
Bovine sourced gelatin dominated the animal source segment with the highest revenue share of 34.94% in 2023. This is attributed to the increasing usage of bovine based gelatin in various food & beverage applications. Moreover, the rise in demand for dietary supplements globally on the account of shifting inclination of consumers towards healthy and protein rich diet is expected to drive the market growth.
On the other hand, the increasing prevalence of vegan culture around the world coupled with the decrease in the slaughtering of animals like cows, buffalo, etc. is expected to hamper the growth of the bovine gelatin market. According to the U.S. Department of Agriculture (USDA), commercial cow slaughtering in the year 2020 witnessed a decline of 2% in numbers compared to 2019. In addition, according to OECD-FAO, bovine meat output among major producing countries like Australia, New Zealand, and European Union) fell due to the limited availability of animals. Such factors can hamper the overall market growth.
Bovine gelatin is a protein-based gelling agent and is produced usually by carrying out partial hydrolysis of collagen, which is extracted from hides, bone, skin, and animal tissues. The manufacturing process of bovine gelatin is Kosher as well as Halal certified, as a result, the products containing bovine gelatin are consumed by many Islamic countries. Such factors are some of the driving factors of bovine based products demand worldwide.
Porcine based gelatin is among the traditionally used products. These products are sourced from pork skin and bones. According to National Health Service (NHS), the usage of porcine based products in various vaccines and capsules as a stabilizer to ensure the effectiveness and safety, especially during and post storage, is expected to drive the market growth in the coming years.
Type A dominated the market with the highest revenue share of more than 55% in 2023. This high share is attributed to the product’s wide utilization in the food & beverages industry. Type A is procured from acid treated collagen and has an isoionic point of 6 to 9. Type A is usually derived from porcine skin; whereas type B from bovine skin and is obtained from alkali treated precursor with an isoionic point of 5.
Type A exhibits better storage stability as compared to type B and is thus preferred more in the food & beverage industry. Type B gelatin is mainly for industrial uses as it has lower bloom strength and higher viscosity.
Europe dominated the market with the highest revenue share of 38.39% in 2023. This is attributed to the high demand from end-use industries such as cosmetics, food & beverages, and healthcare. In addition, the growth in the demand for the product market is characterized by the presence of numerous manufacturing companies like Biogel AG, Prowico, Gelita, among others.
Gelatin used in the UK is commonly sourced from bovine or porcine sources due to the high consumption levels of pork and beef in the region. In addition, the demand for the product in the country can be attributed to the rising sales of cosmetic products. Moreover, the presence of a well-defined and established meat processing industry proves to be favorable for raw material sourcing. Presence of well-established players coupled with abundant raw material supply is expected to fuel the production in the country over the forecast period.
Furthermore, Brazil is one of the prominent producers of gelatin globally. Most of the products produced in the country is sourced from bovine hides and bones owing to the abundant availability of raw materials. In addition, the presence of international players such as JBS SA, Minerva, and BRF involved in meat processing is expected to ensure consistent raw material supply for the production. Thus, manufacturers are expected to open their production units in the country due to easy access to raw materials including bones and bovine hides at the domestic level.
The market growth in the country can be attributed to the rapidly developing pharmaceutical, cosmetics, and nutraceutical industries. Nitta Gelatin Inc. is the only major player involved in production and has three major production facilities located in Gujarat, Kerala, and Maharashtra. Other emerging players include Jellice Gelatin & Collagen, India Gelatine & Chemicals Ltd. (IGCL), Narmada Gelatines Limited, and Raymon Patel Gelatine Pvt. Ltd.
Cattle bones are used as a major source for gelatin production in the country owing to large-scale availability of raw materials. However, due to conflicting religious values of the consumers with respect to pork and meat consumption in the country, the demand for gelatin sourced from pork and beef skin and hides is relatively lower as compared to bone-derived. This is anticipated to be a major factor restraining the market growth.
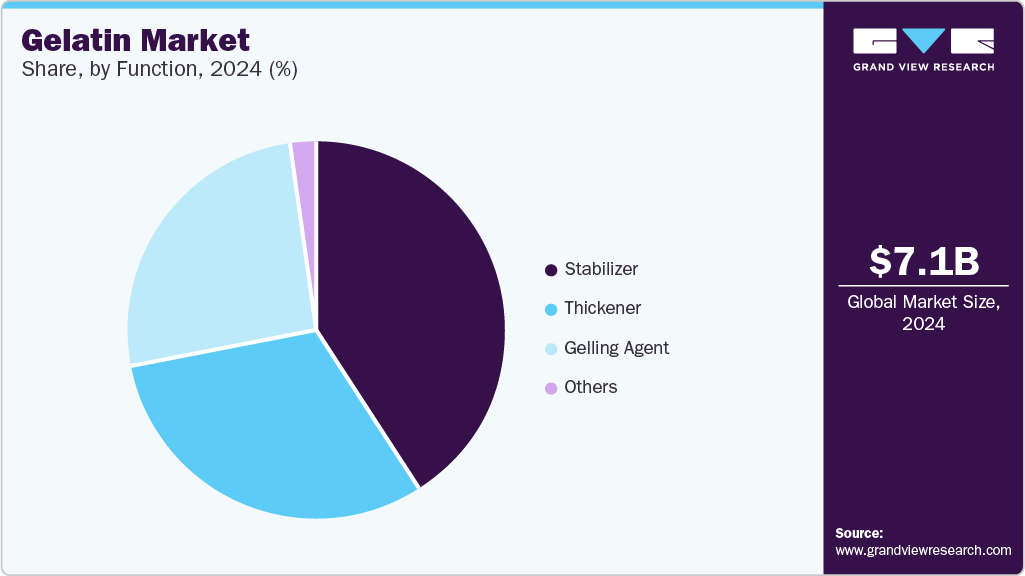
Stabilizer function dominated the market with the highest revenue share of more than 40% in 2023. This high share is attributed to the properties such as emulsifying effects. In addition, they help smoothen the food texture and provide body to the food. Moreover, they are responsible for giving a uniform nature or consistency to the product and retain the flavoring compounds in dispersions. Such properties of gelatin make it ideal for stabilizing ice creams, margarine, spreads, dairy products, salad dressings, and mayonnaise among others.
In addition, gelatin is also used as a thickener to increase the viscosity of a solution or mixture without altering its properties. Furthermore, it is often used as a food additive where the key attribute is taste. Additionally, it is used to improve the suspension of other ingredients that increase the stability of the product. Gelatin is added to various food types such as soups, salad dressings, sauces, and gravies. Moreover, the use of thickeners in cosmetics and personal care products is expected to fuel market growth over the coming years.
Other functions of gelatin include its use for texturing as well as a protective agent and emulsifier. Emulsifiers are substances that stabilize an emulsion. Increasing use of the product as an emulsifier in various food items such as bread, meat, chocolates, and ice creams is expected to fuel the market growth in the coming years.
The global gelatin market is concentrated in nature with the top four companies accounting for more than 65.0% of the total market share in 2023. Compared to other industry participants, these major companies have a higher penetration of their products in various end-use markets such as food & beverage, health & nutrition, and pharmaceuticals among others due to their exceptional distribution network and goodwill worldwide. Global expansion, production capacity expansion, and mergers & acquisitions are some of the key strategies adopted by the manufacturing companies throughout the world. For instance, in July 2022, Perfect Day, U.S. alt-dairy startup acquired Sterling Biotech, an Indian manufacturer to expand its network in the domestic market.
An extensive range of product portfolio for end-use markets have contributed to high-sales of gelatin for the above-mentioned companies. One of the major factors influencing the company's market share is a high level of integration in the value chain. In April 2023, GELITA AG, a leading player in the industry, launched a fast-setting gelatin which allows a breakthrough in the fortified gummy manufacturing. CONFIXX, the new gelatin brand, enables for the starch-free manufacture of gummies with a sensorial profile that was previously possible only with a starch-based production process. This innovation creates ample opportunities for producers of on-trend supplements to incorporate various active ingredients, make significant cost savings and streamline the production process.
Report Attribute |
Details |
Market size value in 2024 |
USD 7.05 billion |
Revenue forecast in 2030 |
USD 13.14 billion |
Growth rate |
CAGR of 10.1% from 2024 to 2030 |
Historic period |
2018 - 2022 |
Forecast period |
2024 - 2030 |
Quantitative Units |
Volume in kilotons, revenue in USD million, and CAGR from 2024 to 2030 |
Report coverage |
Volume forecast, revenue forecast, competitive landscape, growth factors, and trends |
Segments covered |
Source, function, type, application, region |
Regional scope |
North America; Europe; Asia Pacific; Latin America; Middle East & Africa |
Country scope |
U.S.; Canada; Germany; U.K.; France; Italy; Spain; Russia; Portugal; The Netherlands, Switzerland, Poland, China, Japan, India, Indonesia, Vietnam, Thailand, Philippines, Brazil, Mexico, Ecuador, Peru, Bolivia, Chile, Argentina, South Africa, Saudi Arabia, Turkey, UAE, Qatar, Israel |
Key companies profiled |
ELITA AG, Rousselot, PB Leiner, STERLING GELATIN, Weishardt Holding SA, Junca Gelatines SL, Nitta Gelatin, Inc., PAN Biotech GmbH, Shanghai Al-Amin Biotechnology Co., Ltd., Tessenderlo Group |
Customization scope |
Free report customization (equivalent up to 8 analysts working days) with purchase. Addition or alteration to country, regional & segment scope. |
Pricing and purchase options |
Avail customized purchase options to meet your exact research needs. Explore purchase options |
This report forecasts revenue and volume growth at the global, regional, and country levels and provides an analysis of the latest industry trends and opportunities in each of the sub-segments from 2018 to 2030. For this study, Grand View Research has segmented the global gelatin market report based on source, function, type, application, and region:
Source Outlook (Revenue, USD Million; Volume, Kilotons; 2018 - 2030)
Animal Source
Bovine
Porcine
Poultry
Marine
Others
Plant Source
Agar-Agar
Carrageenan
Locust Bean Gum
Others
Function Outlook (Revenue, USD Million; Volume, Kilotons; 2018 - 2030)
Stabilizer
Thickener
Gelling Agent
Others
Type Outlook (Revenue, USD Million; Volume, Kilotons; 2018 - 2030)
Type A
Type B
Application Outlook (Revenue, USD Million; Volume, Kilotons; 2018 - 2030)
Food & Beverages
Functional Foods
Meat Processing
Functional Beverages
Dietary Supplements
Confectionery
Desserts
Healthcare
Cosmetics
Others
Regional Outlook (Revenue, USD Million; Volume, Kilotons; 2018 - 2030)
North America
U.S.
Canada
Europe
Germany
U.K.
France
Italy
Spain
Russia
Portugal
The Netherlands
Switzerland
Poland
Asia Pacific
China
Japan
India
Indonesia
Vietnam
Thailand
Philippines
Australia
New Zealand
Latin America
Brazil
Mexico
Ecuador
Peru
Bolivia
Chile
Argentina
Middle East & Africa
South Africa
Saudi Arabia
Turkey
UAE
Qatar
Israel
b. The global gelatin market size was estimated at USD 6.08 billion in 2022 and is expected to reach USD 6.51 billion in 2023.
b. The global gelatin market is expected to grow at a compound annual growth rate of 9.5% from 2023 to 2030 to reach USD 13.14 billion by 2030.
b. Bovine dominated the gelatin market with a share of over 34% in 2022. This is attributable to cheaper prices of bovine than the other raw materials.
b. Some key players operating in the gelatin market include Gelita AG; Darling Ingredients Inc.; Nitta Gelatin Inc.; Sterling Gelatin; and Tessenderlo Group. Gelita AG and Nitta Gelatin Inc.
b. Key factors that are driving the gelatin market growth include increasing demand for convenience and functional food and beverage products, coupled with its augmented use in the pharmaceutical application.
Table of Contents
Chapter 1. Gelatin Market: Methodology and Scope
1.1. Market Segmentation & Scope
1.2. Market Definition
1.3. Information Procurement
1.3.1. Purchased Database
1.3.2. GVR’s Internal Database
1.3.3. Secondary Sources & Third-Party Perspectives
1.3.4. Primary Research
1.4. Information Analysis
1.4.1. Data Analysis Models
1.5. Market Formulation & Data Visualization
1.6. Data Validation & Publishing
Chapter 2. Gelatin Market: Executive Summary
2.1. Market Snapshot
2.2. Segment Snapshot
2.3. Competitive Landscape Snapshot
Chapter 3. Gelatin Market: Variables, Trends & Scope
3.1. Market Lineage Outlook
3.1.1. Global Collagen Market Outlook
3.2. Industry Value Chain Analysis
3.2.1. Manufacturing/Technology Trends
3.2.2. Sales Channel Analysis
3.2.3. List of Potential End-users
3.3. Regulatory Framework
3.4. Price Trend Analysis, 2018 - 2030 (USD/Kg)
3.4.1. Factors Influencing Prices
3.5. Market Dynamics
3.5.1. Market Driver Analysis
3.5.2. Market Restraint Analysis
3.5.3. Industry Challenges
3.5.4. Industry Opportunities
3.6. Industry Analysis Tools
3.6.1. Porter’s Five Forces Analysis
3.6.2. Macro-environmental Analysis
Chapter 4. Gelatin Market: Supplier Portfolio Analysis
4.1. List of Key Raw Material Suppliers
4.2. Raw Material Trends
4.3. Portfolio Analysis/Kraljic Matrix
4.4. Engagement Model
4.5. Negotiation Strategies
4.6. Sourcing Best Practices
Chapter 5. Gelatin Market: Source Estimates & Trend Analysis
5.1. Source Movement Analysis & Market Share, 2023 & 2030
5.2. Gelatin Market Estimates & Forecast, By Source, 2018 to 2030 (Kilotons) (USD Million)
5.3. Animal Sourced
5.3.1. Animal Sourced Gelatin Market Estimates and Forecasts, 2018 - 2030 (Kilotons) (USD Million)
5.3.2. Bovine
5.3.2.1. Bovine Sourced Gelatin Market Estimates and Forecasts, 2018 - 2030 (Kilotons) (USD Million)
5.3.3. Porcine
5.3.3.1. Porcine Sourced Gelatin Market Estimates and Forecasts, 2018 - 2030 (Kilotons) (USD Million)
5.3.4. Poultry
5.3.4.1. Poultry Sourced Gelatin Market Estimates and Forecasts, 2018 - 2030 (Kilotons) (USD Million)
5.3.5. Marine
5.3.5.1. Marine Sourced Gelatin Market Estimates and Forecasts, 2018 - 2030 (Kilotons) (USD Million)
5.3.6. Other Animal Sources
5.3.6.1. Other Animal Sources Based Gelatin Market Estimates and Forecasts, 2018 - 2030 (Kilotons) (USD Million)
5.4. Plant Source
5.4.1. Plant Sourced Gelatin Market Estimates and Forecasts, 2018 - 2030 (Kilotons) (USD Million)
5.4.2. Agar Agar
5.4.2.1. Agar Agar Sourced Gelatin Market Estimates and Forecasts, 2018 - 2030 (Kilotons) (USD Million)
5.4.3. Carrageenan
5.4.3.1. Carrageenan Sourced Gelatin Market Estimates and Forecasts, 2018 - 2030 (Kilotons) (USD Million)
5.4.4. Locust Bean Gum
5.4.4.1. Locust Bean Gum Sourced Gelatin Market Estimates and Forecasts, 2018 - 2030 (Kilotons) (USD Million)
5.4.5. Other Plant Sources
5.4.5.1. Other Plant Sources Based Gelatin Market Estimates and Forecasts, 2018 - 2030 (Kilotons) (USD Million)
Chapter 6. Gelatin Market: Function Estimates & Trend Analysis
6.1. Function Movement Analysis & Market Share, 2023 & 2030
6.2. Gelatin Market Estimates & Forecast, By Function, 2018 to 2030 (Kilotons) (USD Million)
6.3. Stabilizer
6.3.1. Gelatin Market Estimates and Forecasts, as Stabilizer, 2018 - 2030 (Kilotons) (USD Million)
6.4. Thickener
6.4.1. Gelatin Market Estimates and Forecasts, as Thickener, 2018 - 2030 (Kilotons) (USD Million)
6.5. Gelling Agent
6.5.1. Gelatin Market Estimates and Forecasts, as Gelling Agent, 2018 - 2030 (Kilotons) (USD Million)
6.6. Other Functions
6.6.1. Gelatin Market Estimates and Forecasts, as Other Functions, 2018 - 2030 (Kilotons) (USD Million)
Chapter 7. Gelatin Market: Type Estimates & Trend Analysis
7.1. Type Movement Analysis & Market Share, 2023 & 2030
7.2. Gelatin Market Estimates & Forecast, By Type, 2018 to 2030 (Kilotons) (USD Million)
7.3. Type 1
7.3.1. Type 1 Gelatin Market Estimates and Forecasts, 2018 - 2030 (Kilotons) (USD Million)
7.4. Type 2
7.4.1. Type 2 Gelatin Market Estimates and Forecasts, 2018 - 2030 (Kilotons) (USD Million)
Chapter 8. Gelatin Market: Application Estimates & Trend Analysis
8.1. Application Movement Analysis & Market Share, 2023 & 2030
8.2. Gelatin Market Estimates & Forecast, By Application, 2018 to 2030 (Kilotons) (USD Million)
8.3. Food & Beverages
8.3.1. Gelatin Market Estimates and Forecasts, in Food & Beverages, 2018 - 2030 (Kilotons) (USD Million)
8.3.2. Functional Food
8.3.2.1. Gelatin Market Estimates and Forecasts, in Functional Food, 2018 - 2030 (Kilotons) (USD Million)
8.3.3. Meat Processing
8.3.3.1. Gelatin Market Estimates and Forecasts, in Meat Processing, 2018 - 2030 (Kilotons) (USD Million)
8.3.4. Functional Beverages
8.3.4.1. Gelatin Market Estimates and Forecasts, in Functional Beverages, 2018 - 2030 (Kilotons) (USD Million)
8.3.5. Dietary Supplements
8.3.5.1. Gelatin Market Estimates and Forecasts, in Dietary Supplements, 2018 - 2030 (Kilotons) (USD Million)
8.3.6. Confectionery
8.3.6.1. Gelatin Market Estimates and Forecasts, in Confectionery, 2018 - 2030 (Kilotons) (USD Million)
8.3.7. Desserts
8.3.7.1. Gelatin Market Estimates and Forecasts, in Desserts, 2018 - 2030 (Kilotons) (USD Million)
8.4. Healthcare
8.4.1. Gelatin Market Estimates and Forecasts, in Healthcare, 2018 - 2030 (Kilotons) (USD Million)
8.5. Cosmetics
8.5.1. Gelatin Market Estimates and Forecasts, in Cosmetics, 2018 - 2030 (Kilotons) (USD Million)
8.6. Other Applications
8.6.1. Gelatin Market Estimates and Forecasts, in Other Applications, 2018 - 2030 (Kilotons) (USD Million)
Chapter 9. Gelatin Market: Regional Estimates & Trend Analysis
9.1. Regional Movement Analysis & Market Share, 2023 & 2030
9.2. North America
9.2.1. North America Gelatin Market Estimates & Forecast, 2018 - 2030 (Kilotons) (USD Million)
9.2.2. U.S.
9.2.2.1. Key country dynamics
9.2.2.2. U.S. gelatin market estimates & forecast, 2018 - 2030 (Kilotons) (USD Million)
9.2.3. Canada
9.2.3.1. Key country dynamics
9.2.3.2. Canada gelatin market estimates & forecast, 2018 - 2030 (Kilotons) (USD Million)
9.3. Europe
9.3.1. Europe gelatin Market Estimates & Forecast, 2018 - 2030 (Kilotons) (USD Million)
9.3.2. Germany
9.3.2.1. Key country dynamics
9.3.2.2. Germany gelatin market estimates & forecast, 2018 - 2030 (Kilotons) (USD Million)
9.3.3. UK
9.3.3.1. Key country dynamics
9.3.3.2. UK gelatin market estimates & forecast, 2018 - 2030 (Kilotons) (USD Million)
9.3.4. France
9.3.4.1. Key country dynamics
9.3.4.2. France gelatin market estimates & forecast, 2018 - 2030 (Kilotons) (USD Million)
9.3.5. Italy
9.3.5.1. Key country dynamics
9.3.5.2. Italy gelatin market estimates & forecast, 2018 - 2030 (Kilotons) (USD Million)
9.3.6. Spain
9.3.6.1. Key country dynamics
9.3.6.2. Spain gelatin market estimates & forecast, 2018 - 2030 (Kilotons) (USD Million)
9.3.7. Russia
9.3.7.1. Key country dynamics
9.3.7.2. Russia gelatin market estimates & forecast, 2018 - 2030 (Kilotons) (USD Million)
9.3.8. Portugal
9.3.8.1. Key country dynamics
9.3.8.2. Portugal gelatin market estimates & forecast, 2018 - 2030 (Kilotons) (USD Million)
9.3.9. Netherlands
9.3.9.1. Key country dynamics
9.3.9.2. Netherlands gelatin market estimates & forecast, 2018 - 2030 (Kilotons) (USD Million)
9.3.10. Switzerland
9.3.10.1. Key country dynamics
9.3.10.2. Switzerland gelatin market estimates & forecast, 2018 - 2030 (Kilotons) (USD Million)
9.3.11. Poland
9.3.11.1. Key country dynamics
9.3.11.2. Poland gelatin market estimates & forecast, 2018 - 2030 (Kilotons) (USD Million)
9.4. Asia Pacific
9.4.1. Asia Pacific gelatin Market Estimates & Forecast, 2018 - 2030 (Kilotons) (USD Million)
9.4.2. China
9.4.2.1. Key country dynamics
9.4.2.2. China gelatin market estimates & forecast, 2018 - 2030 (Kilotons) (USD Million)
9.4.3. Japan
9.4.3.1. Key country dynamics
9.4.3.2. Japan gelatin market estimates & forecast, 2018 - 2030 (Kilotons) (USD Million)
9.4.4. India
9.4.4.1. Key country dynamics
9.4.4.2. India Gelatin market estimates & forecast, 2018 - 2030 (Kilotons) (USD Million)
9.4.5. Vietnam
9.4.5.1. Key country dynamics
9.4.5.2. Vietnam gelatin market estimates & forecast, 2018 - 2030 (Kilotons) (USD Million)
9.4.6. Indonesia
9.4.6.1. Key country dynamics
9.4.6.2. Indonesia gelatin market estimates & forecast, 2018 - 2030 (Kilotons) (USD Million)
9.4.7. Thailand
9.4.7.1. Key country dynamics
9.4.7.2. Thailand gelatin market estimates & forecast, 2018 - 2030 (Kilotons) (USD Million)
9.4.8. Philippines
9.4.8.1. Key country dynamics
9.4.8.2. Philippines gelatin market estimates & forecast, 2018 - 2030 (Kilotons) (USD Million)
9.4.9. Australia
9.4.9.1. Key country dynamics
9.4.9.2. Australia gelatin market estimates & forecast, 2018 - 2030 (Kilotons) (USD Million)
9.4.10. New Zealand
9.4.10.1. Key country dynamics
9.4.10.2. New Zealand gelatin market estimates & forecast, 2018 - 2030 (Kilotons) (USD Million)
9.5. Latin America
9.5.1. Latin America gelatin Market Estimates & Forecast, 2018 - 2030 (Kilotons) (USD Million)
9.5.2. Brazil
9.5.2.1. Key country dynamics
9.5.2.2. Brazil gelatin market estimates & forecast, 2018 - 2030 (Kilotons) (USD Million)
9.5.3. Mexico
9.5.3.1. Key country dynamics
9.5.3.2. Mexico gelatin market estimates & forecast, 2018 - 2030 (Kilotons) (USD Million)
9.5.4. Ecuador
9.5.4.1. Key country dynamics
9.5.4.2. Ecuador gelatin market estimates & forecast, 2018 - 2030 (Kilotons) (USD Million)
9.5.5. Chile
9.5.5.1. Key country dynamics
9.5.5.2. Chile gelatin market estimates & forecast, 2018 - 2030 (Kilotons) (USD Million)
9.5.6. Peru
9.5.6.1. Key country dynamics
9.5.6.2. Peru gelatin market estimates & forecast, 2018 - 2030 (Kilotons) (USD Million)
9.5.7. Bolivia
9.5.7.1. Key country dynamics
9.5.7.2. Bolivia gelatin market estimates & forecast, 2018 - 2030 (Kilotons) (USD Million)
9.5.8. Argentina
9.5.8.1. Key country dynamics
9.5.8.2. Argentina gelatin market estimates & forecast, 2018 - 2030 (Kilotons) (USD Million)
9.6. Middle East & Africa
9.6.1. Middles East & Africa Chemical Market Estimates & Forecast, 2018 - 2030 (Kilotons) (USD Million)
9.6.2. Saudi Arabia
9.6.2.1. Key country dynamics
9.6.2.2. Saudi Arabia gelatin market estimates & forecast, 2018 - 2030 (Kilotons) (USD Million)
9.6.3. South Africa
9.6.3.1. Key country dynamics
9.6.3.2. South Africa gelatin market estimates & forecast, 2018 - 2030 (Kilotons) (USD Million)
Chapter 10. Gelatin Market - Competitive Landscape
10.1. Recent Development & Impact Analysis, By Key Market Participants
10.2. Company Categorization
10.3. Company Market Share Analysis, 2023
10.4. Company Heat Map Analysis
10.5. Strategy Mapping
10.6. Company Listing
10.6.1. GELITA AG
10.6.1.1. Participant’s overview
10.6.1.2. Financial performance
10.6.1.3. Product benchmarking
10.6.1.4. Recent developments
10.6.2. Rousselot
10.6.2.1. Participant’s overview
10.6.2.2. Financial performance
10.6.2.3. Product benchmarking
10.6.2.4. Recent developments
10.6.3. PB Leiner
10.6.3.1. Participant’s overview
10.6.3.2. Financial performance
10.6.3.3. Product benchmarking
10.6.3.4. Recent developments
10.6.4. STERLING GELATIN
10.6.4.1. Participant’s overview
10.6.4.2. Financial performance
10.6.4.3. Product benchmarking
10.6.4.4. Recent developments
10.6.5. Weishardt Holding SA
10.6.5.1. Participant’s overview
10.6.5.2. Financial performance
10.6.5.3. Product benchmarking
10.6.5.4. Recent developments
10.6.6. Junca Gelatines SL
10.6.6.1. Participant’s overview
10.6.6.2. Financial performance
10.6.6.3. Product benchmarking
10.6.6.4. Recent developments
10.6.7. Nitta Gelatin, Inc.
10.6.7.1. Participant’s overview
10.6.7.2. Financial performance
10.6.7.3. Product benchmarking
10.6.7.4. Recent developments
10.6.8. PAN Biotech GmbH
10.6.8.1. Participant’s overview
10.6.8.2. Financial performance
10.6.8.3. Product benchmarking
10.6.8.4. Recent developments
10.6.9. Shanghai Al-Amin Biotechnology Co., Ltd.
10.6.9.1. Participant’s overview
10.6.9.2. Financial performance
10.6.9.3. Product benchmarking
10.6.9.4. Recent developments
10.6.10. Tessenderlo Group
10.6.10.1. Participant’s overview
10.6.10.2. Financial performance
10.6.10.3. Product benchmarking
10.6.10.4. Recent developments
List of Tables
Table 1 List of abbreviations
Table 2 List of Key End-users
Table 3 Global gelatin market estimates and forecasts by region, 2018 - 2030 (Kilotons)
Table 4 Global gelatin market estimates and forecasts by region, 2018 - 2030 (USD Million)
Table 5 Global gelatin market estimates and forecasts by source, 2018 - 2030 (Kilotons)
Table 6 Global gelatin market estimates and forecasts by source, 2018 - 2030 (USD Million)
Table 7 Global gelatin market estimates and forecasts by function, 2018 - 2030 (Kilotons)
Table 8 Global gelatin market estimates and forecasts by function, 2018 - 2030 (USD Million)
Table 9 Global gelatin market estimates and forecasts by type, 2018 - 2030 (Kilotons)
Table 10 Global gelatin market estimates and forecasts by type, 2018 - 2030 (USD Million)
Table 11 Global gelatin market estimates and forecasts by application, 2018 - 2030 (Kilotons)
Table 12 Global gelatin market estimates and forecasts by application, 2018 - 2030 (USD Million)
Table 13 North America gelatin market estimates and forecasts by source, 2018 - 2030 (Kilotons)
Table 14 North America gelatin market estimates and forecasts by source, 2018 - 2030 (USD Million)
Table 15 North America gelatin market estimates and forecasts by function, 2018 - 2030 (Kilotons)
Table 16 North America gelatin market estimates and forecasts by function, 2018 - 2030 (USD Million)
Table 17 North America gelatin market estimates and forecasts by type, 2018 - 2030 (Kilotons)
Table 18 North America gelatin market estimates and forecasts by type, 2018 - 2030 (USD Million)
Table 19 North America gelatin market estimates and forecasts by application, 2018 - 2030 (Kilotons)
Table 20 North America gelatin market estimates and forecasts by application, 2018 - 2030 (USD Million)
Table 21 U.S. Macroeconomic Outlay
Table 22 U.S. gelatin market estimates and forecasts by source, 2018 - 2030 (Kilotons)
Table 23 U.S. gelatin market estimates and forecasts by source, 2018 - 2030 (USD Million)
Table 24 U.S. gelatin market estimates and forecasts by function, 2018 - 2030 (Kilotons)
Table 25 U.S. gelatin market estimates and forecasts by function, 2018 - 2030 (USD Million)
Table 26 U.S. gelatin market estimates and forecasts by type, 2018 - 2030 (Kilotons)
Table 27 U.S. gelatin market estimates and forecasts by type, 2018 - 2030 (USD Million)
Table 28 U.S. gelatin market estimates and forecasts by application, 2018 - 2030 (Kilotons)
Table 29 U.S. gelatin market estimates and forecasts by application, 2018 - 2030 (USD Million)
Table 30 Canada Macroeconomic Outlay
Table 31 Canada gelatin market estimates and forecasts by source, 2018 - 2030 (Kilotons)
Table 32 Canada gelatin market estimates and forecasts by source, 2018 - 2030 (USD Million)
Table 33 Canada gelatin market estimates and forecasts by function, 2018 - 2030 (Kilotons)
Table 34 Canada gelatin market estimates and forecasts by function, 2018 - 2030 (USD Million)
Table 35 Canada gelatin market estimates and forecasts by type, 2018 - 2030 (Kilotons)
Table 36 Canada gelatin market estimates and forecasts by type, 2018 - 2030 (USD Million)
Table 37 Canada gelatin market estimates and forecasts by application, 2018 - 2030 (Kilotons)
Table 38 Canada gelatin market estimates and forecasts by application, 2018 - 2030 (USD Million)
Table 39 Europe gelatin market estimates and forecasts by source, 2018 - 2030 (Kilotons)
Table 40 Europe gelatin market estimates and forecasts by source, 2018 - 2030 (USD Million)
Table 41 Europe gelatin market estimates and forecasts by function, 2018 - 2030 (Kilotons)
Table 42 Europe gelatin market estimates and forecasts by function, 2018 - 2030 (USD Million)
Table 43 Europe gelatin market estimates and forecasts by type, 2018 - 2030 (Kilotons)
Table 44 Europe gelatin market estimates and forecasts by type, 2018 - 2030 (USD Million)
Table 45 Europe gelatin market estimates and forecasts by application, 2018 - 2030 (Kilotons)
Table 46 Europe gelatin market estimates and forecasts by application, 2018 - 2030 (USD Million)
Table 47 Germany Macroeconomic Outlay
Table 48 Germany gelatin market estimates and forecasts by source, 2018 - 2030 (Kilotons)
Table 49 Germany gelatin market estimates and forecasts by source, 2018 - 2030 (USD Million)
Table 50 Germany gelatin market estimates and forecasts by function, 2018 - 2030 (Kilotons)
Table 51 Germany gelatin market estimates and forecasts by function, 2018 - 2030 (USD Million)
Table 52 Germany gelatin market estimates and forecasts by type, 2018 - 2030 (Kilotons)
Table 53 Germany gelatin market estimates and forecasts by type, 2018 - 2030 (USD Million)
Table 54 Germany gelatin market estimates and forecasts by application, 2018 - 2030 (Kilotons)
Table 55 Germany gelatin market estimates and forecasts by application, 2018 - 2030 (USD Million)
Table 56 UK Macroeconomic Outlay
Table 57 UK gelatin market estimates and forecasts by source, 2018 - 2030 (Kilotons)
Table 58 UK gelatin market estimates and forecasts by source, 2018 - 2030 (USD Million)
Table 59 UK gelatin market estimates and forecasts by function, 2018 - 2030 (Kilotons)
Table 60 UK gelatin market estimates and forecasts by function, 2018 - 2030 (USD Million)
Table 61 UK gelatin market estimates and forecasts by type, 2018 - 2030 (Kilotons)
Table 62 UK gelatin market estimates and forecasts by type, 2018 - 2030 (USD Million)
Table 63 UK gelatin market estimates and forecasts by application, 2018 - 2030 (Kilotons)
Table 64 UK gelatin market estimates and forecasts by application, 2018 - 2030 (USD Million)
Table 65 France Macroeconomic Outlay
Table 66 France gelatin market estimates and forecasts by source, 2018 - 2030 (Kilotons)
Table 67 France gelatin market estimates and forecasts by source, 2018 - 2030 (USD Million)
Table 68 France gelatin market estimates and forecasts by function, 2018 - 2030 (Kilotons)
Table 69 France gelatin market estimates and forecasts by function, 2018 - 2030 (USD Million)
Table 70 France gelatin market estimates and forecasts by type, 2018 - 2030 (Kilotons)
Table 71 France gelatin market estimates and forecasts by type, 2018 - 2030 (USD Million)
Table 72 France gelatin market estimates and forecasts by application, 2018 - 2030 (Kilotons)
Table 73 France gelatin market estimates and forecasts by application, 2018 - 2030 (USD Million)
Table 74 Italy Macroeconomic Outlay
Table 75 Italy gelatin market estimates and forecasts by source, 2018 - 2030 (Kilotons)
Table 76 Italy gelatin market estimates and forecasts by source, 2018 - 2030 (USD Million)
Table 77 Italy gelatin market estimates and forecasts by function, 2018 - 2030 (Kilotons)
Table 78 Italy gelatin market estimates and forecasts by function, 2018 - 2030 (USD Million)
Table 79 Italy gelatin market estimates and forecasts by type, 2018 - 2030 (Kilotons)
Table 80 Italy gelatin market estimates and forecasts by type, 2018 - 2030 (USD Million)
Table 81 Italy gelatin market estimates and forecasts by application, 2018 - 2030 (Kilotons)
Table 82 Italy gelatin market estimates and forecasts by application, 2018 - 2030 (USD Million)
Table 83 Spain Macroeconomic Outlay
Table 84 Spain gelatin market estimates and forecasts by source, 2018 - 2030 (Kilotons)
Table 85 Spain gelatin market estimates and forecasts by source, 2018 - 2030 (USD Million)
Table 86 Spain gelatin market estimates and forecasts by function, 2018 - 2030 (Kilotons)
Table 87 Spain gelatin market estimates and forecasts by function, 2018 - 2030 (USD Million)
Table 88 Spain gelatin market estimates and forecasts by type, 2018 - 2030 (Kilotons)
Table 89 Spain gelatin market estimates and forecasts by type, 2018 - 2030 (USD Million)
Table 90 Spain gelatin market estimates and forecasts by application, 2018 - 2030 (Kilotons)
Table 91 Spain gelatin market estimates and forecasts by application, 2018 - 2030 (USD Million)
Table 92 Russia Macroeconomic Outlay
Table 93 Russia gelatin market estimates and forecasts by source, 2018 - 2030 (Kilotons)
Table 94 Russia gelatin market estimates and forecasts by source, 2018 - 2030 (USD Million)
Table 95 Russia gelatin market estimates and forecasts by function, 2018 - 2030 (Kilotons)
Table 96 Russia gelatin market estimates and forecasts by function, 2018 - 2030 (USD Million)
Table 97 Russia gelatin market estimates and forecasts by type, 2018 - 2030 (Kilotons)
Table 98 Russia gelatin market estimates and forecasts by type, 2018 - 2030 (USD Million)
Table 99 Russia gelatin market estimates and forecasts by application, 2018 - 2030 (Kilotons)
Table 100 Russia gelatin market estimates and forecasts by application, 2018 - 2030 (USD Million)
Table 101 Portugal Macroeconomic Outlay
Table 102 Portugal gelatin market estimates and forecasts by source, 2018 - 2030 (Kilotons)
Table 103 Portugal gelatin market estimates and forecasts by source, 2018 - 2030 (USD Million)
Table 104 Portugal gelatin market estimates and forecasts by function, 2018 - 2030 (Kilotons)
Table 105 Portugal gelatin market estimates and forecasts by function, 2018 - 2030 (USD Million)
Table 106 Portugal gelatin market estimates and forecasts by type, 2018 - 2030 (Kilotons)
Table 107 Portugal gelatin market estimates and forecasts by type, 2018 - 2030 (USD Million)
Table 108 Portugal gelatin market estimates and forecasts by application, 2018 - 2030 (Kilotons)
Table 109 Portugal gelatin market estimates and forecasts by application, 2018 - 2030 (USD Million)
Table 110 Netherlands Macroeconomic Outlay
Table 111 Netherlands gelatin market estimates and forecasts by source, 2018 - 2030 (Kilotons)
Table 112 Netherlands gelatin market estimates and forecasts by source, 2018 - 2030 (USD Million)
Table 113 Netherlands gelatin market estimates and forecasts by function, 2018 - 2030 (Kilotons)
Table 114 Netherlands gelatin market estimates and forecasts by function, 2018 - 2030 (USD Million)
Table 115 Netherlands gelatin market estimates and forecasts by type, 2018 - 2030 (Kilotons)
Table 116 Netherlands gelatin market estimates and forecasts by type, 2018 - 2030 (USD Million)
Table 117 Netherlands gelatin market estimates and forecasts by application, 2018 - 2030 (Kilotons)
Table 118 Netherlands gelatin market estimates and forecasts by application, 2018 - 2030 (USD Million)
Table 119 Switzerland Macroeconomic Outlay
Table 120 Switzerland gelatin market estimates and forecasts by source, 2018 - 2030 (Kilotons)
Table 121 Switzerland gelatin market estimates and forecasts by source, 2018 - 2030 (USD Million)
Table 122 Switzerland gelatin market estimates and forecasts by function, 2018 - 2030 (Kilotons)
Table 123 Switzerland gelatin market estimates and forecasts by function, 2018 - 2030 (USD Million)
Table 124 Switzerland gelatin market estimates and forecasts by type, 2018 - 2030 (Kilotons)
Table 125 Switzerland gelatin market estimates and forecasts by type, 2018 - 2030 (USD Million)
Table 126 Switzerland gelatin market estimates and forecasts by application, 2018 - 2030 (Kilotons)
Table 127 Switzerland gelatin market estimates and forecasts by application, 2018 - 2030 (USD Million)
Table 128 Poland Macroeconomic Outlay
Table 129 Poland gelatin market estimates and forecasts by source, 2018 - 2030 (Kilotons)
Table 130 Poland gelatin market estimates and forecasts by source, 2018 - 2030 (USD Million)
Table 131 Poland gelatin market estimates and forecasts by function, 2018 - 2030 (Kilotons)
Table 132 Poland gelatin market estimates and forecasts by function, 2018 - 2030 (USD Million)
Table 133 Poland gelatin market estimates and forecasts by type, 2018 - 2030 (Kilotons)
Table 134 Poland gelatin market estimates and forecasts by type, 2018 - 2030 (USD Million)
Table 135 Poland gelatin market estimates and forecasts by application, 2018 - 2030 (Kilotons)
Table 136 Poland gelatin market estimates and forecasts by application, 2018 - 2030 (USD Million)
Table 137 Asia Pacific gelatin market estimates and forecasts by source, 2018 - 2030 (Kilotons)
Table 138 Asia Pacific gelatin market estimates and forecasts by source, 2018 - 2030 (USD Million)
Table 139 Asia Pacific gelatin market estimates and forecasts by function, 2018 - 2030 (Kilotons)
Table 140 Asia Pacific gelatin market estimates and forecasts by function, 2018 - 2030 (USD Million)
Table 141 Asia Pacific gelatin market estimates and forecasts by type, 2018 - 2030 (Kilotons)
Table 142 Asia Pacific gelatin market estimates and forecasts by type, 2018 - 2030 (USD Million)
Table 143 Asia Pacific gelatin market estimates and forecasts by application, 2018 - 2030 (Kilotons)
Table 144 Asia Pacific gelatin market estimates and forecasts by application, 2018 - 2030 (USD Million)
Table 145 China Macroeconomic Outlay
Table 146 China gelatin market estimates and forecasts by source, 2018 - 2030 (Kilotons)
Table 147 China gelatin market estimates and forecasts by source, 2018 - 2030 (USD Million)
Table 148 China gelatin market estimates and forecasts by function, 2018 - 2030 (Kilotons)
Table 149 China gelatin market estimates and forecasts by function, 2018 - 2030 (USD Million)
Table 150 China gelatin market estimates and forecasts by type, 2018 - 2030 (Kilotons)
Table 151 China gelatin market estimates and forecasts by type, 2018 - 2030 (USD Million)
Table 152 China gelatin market estimates and forecasts by application, 2018 - 2030 (Kilotons)
Table 153 China gelatin market estimates and forecasts by application, 2018 - 2030 (USD Million)
Table 154 Japan Macroeconomic Outlay
Table 155 Japan gelatin market estimates and forecasts by source, 2018 - 2030 (Kilotons)
Table 156 Japan gelatin market estimates and forecasts by source, 2018 - 2030 (USD Million)
Table 157 Japan gelatin market estimates and forecasts by function, 2018 - 2030 (Kilotons)
Table 158 Japan gelatin market estimates and forecasts by function, 2018 - 2030 (USD Million)
Table 159 Japan gelatin market estimates and forecasts by type, 2018 - 2030 (Kilotons)
Table 160 Japan gelatin market estimates and forecasts by type, 2018 - 2030 (USD Million)
Table 161 Japan gelatin market estimates and forecasts by application, 2018 - 2030 (Kilotons)
Table 162 Japan gelatin market estimates and forecasts by application, 2018 - 2030 (USD Million)
Table 163 India Macroeconomic Outlay
Table 164 India gelatin market estimates and forecasts by source, 2018 - 2030 (Kilotons)
Table 165 India gelatin market estimates and forecasts by source, 2018 - 2030 (USD Million)
Table 166 India gelatin market estimates and forecasts by function, 2018 - 2030 (Kilotons)
Table 167 India gelatin market estimates and forecasts by function, 2018 - 2030 (USD Million)
Table 168 India gelatin market estimates and forecasts by type, 2018 - 2030 (Kilotons)
Table 169 India gelatin market estimates and forecasts by type, 2018 - 2030 (USD Million)
Table 170 India gelatin market estimates and forecasts by application, 2018 - 2030 (Kilotons)
Table 171 India gelatin market estimates and forecasts by application, 2018 - 2030 (USD Million)
Table 172 Indonesia Macroeconomic Outlay
Table 173 Indonesia gelatin market estimates and forecasts by source, 2018 - 2030 (Kilotons)
Table 174 Indonesia gelatin market estimates and forecasts by source, 2018 - 2030 (USD Million)
Table 175 Indonesia gelatin market estimates and forecasts by function, 2018 - 2030 (Kilotons)
Table 176 Indonesia gelatin market estimates and forecasts by function, 2018 - 2030 (USD Million)
Table 177 Indonesia gelatin market estimates and forecasts by type, 2018 - 2030 (Kilotons)
Table 178 Indonesia gelatin market estimates and forecasts by type, 2018 - 2030 (USD Million)
Table 179 Indonesia gelatin market estimates and forecasts by application, 2018 - 2030 (Kilotons)
Table 180 Indonesia gelatin market estimates and forecasts by application, 2018 - 2030 (USD Million)
Table 181 Vietnam Macroeconomic Outlay
Table 182 Vietnam gelatin market estimates and forecasts by source, 2018 - 2030 (Kilotons)
Table 183 Vietnam gelatin market estimates and forecasts by source, 2018 - 2030 (USD Million)
Table 184 Vietnam gelatin market estimates and forecasts by function, 2018 - 2030 (Kilotons)
Table 185 Vietnam gelatin market estimates and forecasts by function, 2018 - 2030 (USD Million)
Table 186 Vietnam gelatin market estimates and forecasts by type, 2018 - 2030 (Kilotons)
Table 187 Vietnam gelatin market estimates and forecasts by type, 2018 - 2030 (USD Million)
Table 188 Vietnam gelatin market estimates and forecasts by application, 2018 - 2030 (Kilotons)
Table 189 Vietnam gelatin market estimates and forecasts by application, 2018 - 2030 (USD Million)
Table 190 Thailand Macroeconomic Outlay
Table 191 Thailand gelatin market estimates and forecasts by source, 2018 - 2030 (Kilotons)
Table 192 Thailand gelatin market estimates and forecasts by source, 2018 - 2030 (USD Million)
Table 193 Thailand gelatin market estimates and forecasts by function, 2018 - 2030 (Kilotons)
Table 194 Thailand gelatin market estimates and forecasts by function, 2018 - 2030 (USD Million)
Table 195 Thailand gelatin market estimates and forecasts by type, 2018 - 2030 (Kilotons)
Table 196 Thailand gelatin market estimates and forecasts by type, 2018 - 2030 (USD Million)
Table 197 Thailand gelatin market estimates and forecasts by application, 2018 - 2030 (Kilotons)
Table 198 Thailand gelatin market estimates and forecasts by application, 2018 - 2030 (USD Million)
Table 199 Philippines Macroeconomic Outlay
Table 200 Philippines gelatin market estimates and forecasts by source, 2018 - 2030 (Kilotons)
Table 201 Philippines gelatin market estimates and forecasts by source, 2018 - 2030 (USD Million)
Table 202 Philippines gelatin market estimates and forecasts by function, 2018 - 2030 (Kilotons)
Table 203 Philippines gelatin market estimates and forecasts by function, 2018 - 2030 (USD Million)
Table 204 Philippines gelatin market estimates and forecasts by type, 2018 - 2030 (Kilotons)
Table 205 Philippines gelatin market estimates and forecasts by type, 2018 - 2030 (USD Million)
Table 206 Philippines gelatin market estimates and forecasts by application, 2018 - 2030 (Kilotons)
Table 207 Philippines gelatin market estimates and forecasts by application, 2018 - 2030 (USD Million)
Table 208 Australia gelatin market estimates and forecasts by source, 2018 - 2030 (Kilotons)
Table 209 Australia gelatin market estimates and forecasts by source, 2018 - 2030 (USD Million)
Table 210 Australia gelatin market estimates and forecasts by function, 2018 - 2030 (Kilotons)
Table 211 Australia gelatin market estimates and forecasts by function, 2018 - 2030 (USD Million)
Table 212 Australia gelatin market estimates and forecasts by type, 2018 - 2030 (Kilotons)
Table 213 Australia gelatin market estimates and forecasts by type, 2018 - 2030 (USD Million)
Table 214 Australia gelatin market estimates and forecasts by application, 2018 - 2030 (Kilotons)
Table 215 Australia gelatin market estimates and forecasts by application, 2018 - 2030 (USD Million)
Table 216 New Zealand Macroeconomic Outlay
Table 217 New Zealand gelatin market estimates and forecasts by source, 2018 - 2030 (Kilotons)
Table 218 New Zealand gelatin market estimates and forecasts by source, 2018 - 2030 (USD Million)
Table 219 New Zealand gelatin market estimates and forecasts by function, 2018 - 2030 (Kilotons)
Table 220 New Zealand gelatin market estimates and forecasts by function, 2018 - 2030 (USD Million)
Table 221 New Zealand gelatin market estimates and forecasts by type, 2018 - 2030 (Kilotons)
Table 222 New Zealand gelatin market estimates and forecasts by type, 2018 - 2030 (USD Million)
Table 223 New Zealand gelatin market estimates and forecasts by application, 2018 - 2030 (Kilotons)
Table 224 New Zealand gelatin market estimates and forecasts by application, 2018 - 2030 (USD Million)
Table 225 Latin America gelatin market estimates and forecasts by source, 2018 - 2030 (Kilotons)
Table 226 Latin America gelatin market estimates and forecasts by source, 2018 - 2030 (USD Million)
Table 227 Latin America gelatin market estimates and forecasts by function, 2018 - 2030 (Kilotons)
Table 228 Latin America gelatin market estimates and forecasts by function, 2018 - 2030 (USD Million)
Table 229 Latin America gelatin market estimates and forecasts by type, 2018 - 2030 (Kilotons)
Table 230 Latin America gelatin market estimates and forecasts by type, 2018 - 2030 (USD Million)
Table 231 Latin America gelatin market estimates and forecasts by application, 2018 - 2030 (Kilotons)
Table 232 Latin America gelatin market estimates and forecasts by application, 2018 - 2030 (USD Million)
Table 233 Brazil Macroeconomic Outlay
Table 234 Brazil gelatin market estimates and forecasts by source, 2018 - 2030 (Kilotons)
Table 235 Brazil gelatin market estimates and forecasts by source, 2018 - 2030 (USD Million)
Table 236 Brazil gelatin market estimates and forecasts by function, 2018 - 2030 (Kilotons)
Table 237 Brazil gelatin market estimates and forecasts by function, 2018 - 2030 (USD Million)
Table 238 Brazil gelatin market estimates and forecasts by type, 2018 - 2030 (Kilotons)
Table 239 Brazil gelatin market estimates and forecasts by type, 2018 - 2030 (USD Million)
Table 240 Brazil gelatin market estimates and forecasts by application, 2018 - 2030 (Kilotons)
Table 241 Brazil gelatin market estimates and forecasts by application, 2018 - 2030 (USD Million)
Table 242 Mexico Macroeconomic Outlay
Table 243 Mexico gelatin market estimates and forecasts by source, 2018 - 2030 (Kilotons)
Table 244 Mexico gelatin market estimates and forecasts by source, 2018 - 2030 (USD Million)
Table 245 Mexico gelatin market estimates and forecasts by function, 2018 - 2030 (Kilotons)
Table 246 Mexico gelatin market estimates and forecasts by function, 2018 - 2030 (USD Million)
Table 247 Mexico gelatin market estimates and forecasts by type, 2018 - 2030 (Kilotons)
Table 248 Mexico gelatin market estimates and forecasts by type, 2018 - 2030 (USD Million)
Table 249 Mexico gelatin market estimates and forecasts by application, 2018 - 2030 (Kilotons)
Table 250 Mexico gelatin market estimates and forecasts by application, 2018 - 2030 (USD Million)
Table 251 Ecuador Macroeconomic Outlay
Table 252 Ecuador gelatin market estimates and forecasts by source, 2018 - 2030 (Kilotons)
Table 253 Ecuador gelatin market estimates and forecasts by source, 2018 - 2030 (USD Million)
Table 254 Ecuador gelatin market estimates and forecasts by function, 2018 - 2030 (Kilotons)
Table 255 Ecuador gelatin market estimates and forecasts by function, 2018 - 2030 (USD Million)
Table 256 Ecuador gelatin market estimates and forecasts by type, 2018 - 2030 (Kilotons)
Table 257 Ecuador gelatin market estimates and forecasts by type, 2018 - 2030 (USD Million)
Table 258 Ecuador gelatin market estimates and forecasts by application, 2018 - 2030 (Kilotons)
Table 259 Ecuador gelatin market estimates and forecasts by application, 2018 - 2030 (USD Million)
Table 260 Peru Macroeconomic Outlay
Table 261 Peru gelatin market estimates and forecasts by source, 2018 - 2030 (Kilotons)
Table 262 Peru gelatin market estimates and forecasts by source, 2018 - 2030 (USD Million)
Table 263 Peru gelatin market estimates and forecasts by function, 2018 - 2030 (Kilotons)
Table 264 Peru gelatin market estimates and forecasts by function, 2018 - 2030 (USD Million)
Table 265 Peru gelatin market estimates and forecasts by type, 2018 - 2030 (Kilotons)
Table 266 Peru gelatin market estimates and forecasts by type, 2018 - 2030 (USD Million)
Table 267 Peru gelatin market estimates and forecasts by application, 2018 - 2030 (Kilotons)
Table 268 Peru gelatin market estimates and forecasts by application, 2018 - 2030 (USD Million)
Table 269 Bolivia Macroeconomic Outlay
Table 270 Bolivia gelatin market estimates and forecasts by source, 2018 - 2030 (Kilotons)
Table 271 Bolivia gelatin market estimates and forecasts by source, 2018 - 2030 (USD Million)
Table 272 Bolivia gelatin market estimates and forecasts by function, 2018 - 2030 (Kilotons)
Table 273 Bolivia gelatin market estimates and forecasts by function, 2018 - 2030 (USD Million)
Table 274 Bolivia gelatin market estimates and forecasts by type, 2018 - 2030 (Kilotons)
Table 275 Bolivia gelatin market estimates and forecasts by type, 2018 - 2030 (USD Million)
Table 276 Bolivia gelatin market estimates and forecasts by application, 2018 - 2030 (Kilotons)
Table 277 Bolivia gelatin market estimates and forecasts by application, 2018 - 2030 (USD Million)
Table 278 Chile Macroeconomic Outlay
Table 279 Chile gelatin market estimates and forecasts by source, 2018 - 2030 (Kilotons)
Table 280 Chile gelatin market estimates and forecasts by source, 2018 - 2030 (USD Million)
Table 281 Chile gelatin market estimates and forecasts by function, 2018 - 2030 (Kilotons)
Table 282 Chile gelatin market estimates and forecasts by function, 2018 - 2030 (USD Million)
Table 283 Chile gelatin market estimates and forecasts by type, 2018 - 2030 (Kilotons)
Table 284 Chile gelatin market estimates and forecasts by type, 2018 - 2030 (USD Million)
Table 285 Chile gelatin market estimates and forecasts by application, 2018 - 2030 (Kilotons)
Table 286 Chile gelatin market estimates and forecasts by application, 2018 - 2030 (USD Million)
Table 287 Argentina Macroeconomic Outlay
Table 288 Argentina gelatin market estimates and forecasts by source, 2018 - 2030 (Kilotons)
Table 289 Argentina gelatin market estimates and forecasts by source, 2018 - 2030 (USD Million)
Table 290 Argentina gelatin market estimates and forecasts by function, 2018 - 2030 (Kilotons)
Table 291 Argentina gelatin market estimates and forecasts by function, 2018 - 2030 (USD Million)
Table 292 Argentina gelatin market estimates and forecasts by type, 2018 - 2030 (Kilotons)
Table 293 Argentina gelatin market estimates and forecasts by type, 2018 - 2030 (USD Million)
Table 294 Argentina gelatin market estimates and forecasts by application, 2018 - 2030 (Kilotons)
Table 295 Argentina gelatin market estimates and forecasts by application, 2018 - 2030 (USD Million)
Table 296 Middle East & Africa gelatin market estimates and forecasts by source, 2018 - 2030 (Kilotons)
Table 297 Middle East & Africa gelatin market estimates and forecasts by source, 2018 - 2030 (USD Million)
Table 298 Middle East & Africa gelatin market estimates and forecasts by function, 2018 - 2030 (Kilotons)
Table 299 Middle East & Africa gelatin market estimates and forecasts by function, 2018 - 2030 (USD Million)
Table 300 Middle East & Africa gelatin market estimates and forecasts by type, 2018 - 2030 (Kilotons)
Table 301 Middle East & Africa gelatin market estimates and forecasts by type, 2018 - 2030 (USD Million)
Table 302 Middle East & Africa gelatin market estimates and forecasts by application, 2018 - 2030 (Kilotons)
Table 303 Middle East & Africa gelatin market estimates and forecasts by application, 2018 - 2030 (USD Million)
Table 304 South Africa Macroeconomic Outlay
Table 305 South Africa gelatin market estimates and forecasts by source, 2018 - 2030 (Kilotons)
Table 306 South Africa gelatin market estimates and forecasts by source, 2018 - 2030 (USD Million)
Table 307 South Africa gelatin market estimates and forecasts by function, 2018 - 2030 (Kilotons)
Table 308 South Africa gelatin market estimates and forecasts by function, 2018 - 2030 (USD Million)
Table 309 South Africa gelatin market estimates and forecasts by type, 2018 - 2030 (Kilotons)
Table 310 South Africa gelatin market estimates and forecasts by type, 2018 - 2030 (USD Million)
Table 311 South Africa gelatin market estimates and forecasts by application, 2018 - 2030 (Kilotons)
Table 312 South Africa gelatin market estimates and forecasts by application, 2018 - 2030 (USD Million)
Table 313 Saudi Arabia Macroeconomic Outlay
Table 314 Saudi Arabia gelatin market estimates and forecasts by source, 2018 - 2030 (Kilotons)
Table 315 Saudi Arabia gelatin market estimates and forecasts by source, 2018 - 2030 (USD Million)
Table 316 Saudi Arabia gelatin market estimates and forecasts by function, 2018 - 2030 (Kilotons)
Table 317 Saudi Arabia gelatin market estimates and forecasts by function, 2018 - 2030 (USD Million)
Table 318 Saudi Arabia gelatin market estimates and forecasts by type, 2018 - 2030 (Kilotons)
Table 319 Saudi Arabia gelatin market estimates and forecasts by type, 2018 - 2030 (USD Million)
Table 320 Saudi Arabia gelatin market estimates and forecasts by application, 2018 - 2030 (Kilotons)
Table 321 Saudi Arabia gelatin market estimates and forecasts by application, 2018 - 2030 (USD Million)
Table 322 Turkey Macroeconomic Outlay
Table 323 Turkey gelatin market estimates and forecasts by source, 2018 - 2030 (Kilotons)
Table 324 Turkey gelatin market estimates and forecasts by source, 2018 - 2030 (USD Million)
Table 325 Turkey gelatin market estimates and forecasts by function, 2018 - 2030 (Kilotons)
Table 326 Turkey gelatin market estimates and forecasts by function, 2018 - 2030 (USD Million)
Table 327 Turkey gelatin market estimates and forecasts by type, 2018 - 2030 (Kilotons)
Table 328 Turkey gelatin market estimates and forecasts by type, 2018 - 2030 (USD Million)
Table 329 Turkey gelatin market estimates and forecasts by application, 2018 - 2030 (Kilotons)
Table 330 Turkey gelatin market estimates and forecasts by application, 2018 - 2030 (USD Million)
Table 331 UAE Macroeconomic Outlay
Table 332 UAE gelatin market estimates and forecasts by source, 2018 - 2030 (Kilotons)
Table 333 UAE gelatin market estimates and forecasts by source, 2018 - 2030 (USD Million)
Table 334 UAE gelatin market estimates and forecasts by function, 2018 - 2030 (Kilotons)
Table 335 UAE gelatin market estimates and forecasts by function, 2018 - 2030 (USD Million)
Table 336 UAE gelatin market estimates and forecasts by type, 2018 - 2030 (Kilotons)
Table 337 UAE gelatin market estimates and forecasts by type, 2018 - 2030 (USD Million)
Table 338 UAE gelatin market estimates and forecasts by application, 2018 - 2030 (Kilotons)
Table 339 UAE gelatin market estimates and forecasts by application, 2018 - 2030 (USD Million)
Table 340 Qatar Macroeconomic Outlay
Table 341 Qatar gelatin market estimates and forecasts by source, 2018 - 2030 (Kilotons)
Table 342 Qatar gelatin market estimates and forecasts by source, 2018 - 2030 (USD Million)
Table 343 Qatar gelatin market estimates and forecasts by function, 2018 - 2030 (Kilotons)
Table 344 Qatar gelatin market estimates and forecasts by function, 2018 - 2030 (USD Million)
Table 345 Qatar gelatin market estimates and forecasts by type, 2018 - 2030 (Kilotons)
Table 346 Qatar gelatin market estimates and forecasts by type, 2018 - 2030 (USD Million)
Table 347 Qatar gelatin market estimates and forecasts by application, 2018 - 2030 (Kilotons)
Table 348 Qatar gelatin market estimates and forecasts by application, 2018 - 2030 (USD Million)
Table 349 Israel Macroeconomic Outlay
Table 350 Israel gelatin market estimates and forecasts by source, 2018 - 2030 (Kilotons)
Table 351 Israel gelatin market estimates and forecasts by source, 2018 - 2030 (USD Million)
Table 352 Israel gelatin market estimates and forecasts by function, 2018 - 2030 (Kilotons)
Table 353 Israel gelatin market estimates and forecasts by function, 2018 - 2030 (USD Million)
Table 354 Israel gelatin market estimates and forecasts by type, 2018 - 2030 (Kilotons)
Table 355 Israel gelatin market estimates and forecasts by type, 2018 - 2030 (USD Million)
Table 356 Israel gelatin market estimates and forecasts by application, 2018 - 2030 (Kilotons)
Table 357 Israel gelatin market estimates and forecasts by application, 2018 - 2030 (USD Million)
List of Figures
Fig. 1 Market research process
Fig. 2 Data triangulation techniques
Fig. 3 Primary research pattern
Fig. 4 Market research approaches
Fig. 5 QFD modeling for market share assessment
Fig. 6 Information Procurement
Fig. 7 Market Formulation and Validation
Fig. 8 Data Validating & Publishing
Fig. 9 Market Segmentation & Scope
Fig. 10 Gelatin Market Snapshot
Fig. 11 Segment Snapshot (1/2)
Fig. 12 Segment Snapshot (2/2)
Fig. 13 Competitive Landscape Snapshot
Fig. 14 Global Collagen Market Outlook
Fig. 15 Gelatin Market Value, 2023 (USD Million)
Fig. 16 Gelatin Market - Value Chain Analysis
Fig. 17 Gelatin Market - Price Trend Analysis 2018 - 2030 (USD/Kg)
Fig. 18 Gelatin Market - Market Dynamics
Fig. 19 Gelatin Market - PORTER’s Analysis
Fig. 20 Gelatin Market - PESTEL Analysis
Fig. 21 Gelatin Market Estimates & Forecasts, By Source: Key Takeaways
Fig. 22 Gelatin Market Share, By Source, 2023 & 2030
Fig. 23 Animal sourced gelatin Market Estimates & Forecasts, 2018 - 2030 (Kilotons) (USD Million)
Fig. 24 Plant sourced gelatin Market Estimates & Forecasts, 2018 - 2030 (Kilotons) (USD Million)
Fig. 25 Gelatin Market Estimates & Forecasts, By Function: Key Takeaways
Fig. 26 Gelatin Market Share, By Function, 2023 & 2030
Fig. 27 Gelatin Market Estimates & Forecasts, as Stabilizer, 2018 - 2030 (Kilotons) (USD Million)
Fig. 28 Gelatin Market Estimates & Forecasts, as Thickener, 2018 - 2030 (Kilotons) (USD Million)
Fig. 29 Gelatin Market Estimates & Forecasts, as Gelling Agents, 2018 - 2030 (Kilotons) (USD Million)
Fig. 30 Gelatin Market Estimates & Forecasts, as Other Functions, 2018 - 2030 (Kilotons) (USD Million)
Fig. 31 Gelatin Market Estimates & Forecasts, By Type: Key Takeaways
Fig. 32 Gelatin Market Share, By Type, 2023 & 2030
Fig. 33 Type 1 Gelatin Market Estimates & Forecasts, 2018 - 2030 (Kilotons) (USD Million)
Fig. 34 Type 2 Gelatin Market Estimates & Forecasts, 2018 - 2030 (Kilotons) (USD Million)
Fig. 35 Gelatin Market Estimates & Forecasts, By Application: Key Takeaways
Fig. 36 Gelatin Market Share, By Application, 2023 & 2030
Fig. 37 Gelatin Market Estimates & Forecasts, in Food & Beverages, 2018 - 2030 (Kilotons) (USD Million)
Fig. 38 Gelatin Market Estimates & Forecasts, in Healthcare, 2018 - 2030 (Kilotons) (USD Million)
Fig. 39 Gelatin Market Estimates & Forecasts, in Cosmetics, 2018 - 2030 (Kilotons) (USD Million)
Fig. 40 Gelatin Market Estimates & Forecasts, in Other Applications, 2018 - 2030 (Kilotons) (USD Million)
Fig. 41 Gelatin Market, By Region, 2023 & 2030 (USD Million)
Fig. 42 North America Gelatin Market Estimates & Forecasts, 2018 - 2030 (Kilotons) (USD Million)
Fig. 43 U.S. Gelatin Market Estimates & Forecasts, 2018 - 2030 (Kilotons) (USD Million)
Fig. 44 Canada Gelatin Market Estimates & Forecasts, 2018 - 2030 (Kilotons) (USD Million)
Fig. 45 Europe Gelatin Market Estimates & Forecasts, 2018 - 2030 (Kilotons) (USD Million)
Fig. 46 Germany Gelatin Market Estimates & Forecasts, 2018 - 2030 (Kilotons) (USD Million)
Fig. 47 UK Gelatin Market Estimates & Forecasts, 2018 - 2030 (Kilotons) (USD Million)
Fig. 48 France Gelatin Market Estimates & Forecasts, 2018 - 2030 (Kilotons) (USD Million)
Fig. 49 Italy Gelatin Market Estimates & Forecasts, 2018 - 2030 (Kilotons) (USD Million)
Fig. 50 Spain Gelatin Market Estimates & Forecasts, 2018 - 2030 (Kilotons) (USD Million)
Fig. 51 Russia Gelatin Market Estimates & Forecasts, 2018 - 2030 (Kilotons) (USD Million)
Fig. 52 Portugal Gelatin Market Estimates & Forecasts, 2018 - 2030 (Kilotons) (USD Million)
Fig. 53 Netherlands Gelatin Market Estimates & Forecasts, 2018 - 2030 (Kilotons) (USD Million)
Fig. 54 Switzerland Gelatin Market Estimates & Forecasts, 2018 - 2030 (Kilotons) (USD Million)
Fig. 55 Poland Gelatin Market Estimates & Forecasts, 2018 - 2030 (Kilotons) (USD Million)
Fig. 56 Asia Pacific Gelatin Market Estimates & Forecasts, 2018 - 2030 (Kilotons) (USD Million)
Fig. 57 China Gelatin Market Estimates & Forecasts, 2018 - 2030 (Kilotons) (USD Million)
Fig. 58 Japan Gelatin Market Estimates & Forecasts, 2018 - 2030 (Kilotons) (USD Million)
Fig. 59 India Gelatin Market Estimates & Forecasts, 2018 - 2030 (Kilotons) (USD Million)
Fig. 60 Indonesia Gelatin Market Estimates & Forecasts, 2018 - 2030 (Kilotons) (USD Million)
Fig. 61 Vietnam Gelatin Market Estimates & Forecasts, 2018 - 2030 (Kilotons) (USD Million)
Fig. 62 Thailand Gelatin Market Estimates & Forecasts, 2018 - 2030 (Kilotons) (USD Million)
Fig. 63 Philippines Gelatin Market Estimates & Forecasts, 2018 - 2030 (Kilotons) (USD Million)
Fig. 64 Latin America Gelatin Market Estimates & Forecasts, 2018 - 2030 (Kilotons) (USD Million)
Fig. 65 Brazil Gelatin Market Estimates & Forecasts, 2018 - 2030 (Kilotons) (USD Million)
Fig. 66 Mexico Gelatin Market Estimates & Forecasts, 2018 - 2030 (Kilotons) (USD Million)
Fig. 67 Ecuador Gelatin Market Estimates & Forecasts, 2018 - 2030 (Kilotons) (USD Million)
Fig. 68 Peru Gelatin Market Estimates & Forecasts, 2018 - 2030 (Kilotons) (USD Million)
Fig. 69 Bolivia Gelatin Market Estimates & Forecasts, 2018 - 2030 (Kilotons) (USD Million)
Fig. 70 Chile Gelatin Market Estimates & Forecasts, 2018 - 2030 (Kilotons) (USD Million)
Fig. 71 Argentina Gelatin Market Estimates & Forecasts, 2018 - 2030 (Kilotons) (USD Million)
Fig. 72 Middle East & Africa Gelatin Market Estimates & Forecasts, 2018 - 2030 (Kilotons) (USD Million)
Fig. 73 South Africa Gelatin Market Estimates & Forecasts, 2018 - 2030 (Kilotons) (USD Million)
Fig. 74 Saudi Arabia Gelatin Market Estimates & Forecasts, 2018 - 2030 (Kilotons) (USD Million)
Fig. 75 Turkey Gelatin Market Estimates & Forecasts, 2018 - 2030 (Kilotons) (USD Million)
Fig. 76 UAE Gelatin Market Estimates & Forecasts, 2018 - 2030 (Kilotons) (USD Million)
Fig. 77 Qatar Gelatin Market Estimates & Forecasts, 2018 - 2030 (Kilotons) (USD Million)
Fig. 78 Israel Gelatin Market Estimates & Forecasts, 2018 - 2030 (Kilotons) (USD Million)
Fig. 79 Key Company Categorization
Fig. 80 Company Market Positioning
Fig. 81 Key Company Market Share Analysis, 2023
Fig. 82 Strategy Mapping
Market Segmentation
Gelatin is a multifunctional ingredient that can function as a gelling, film-forming agent, water-binding, emulsifying, thickening, and foaming agent, making it useful in a broad range of food applications. It is used in fruit snacks, jellies, marshmallows, candy corn, cream cheese, yogurt, margarine, and bakery & confectionary products. Gelatin formulations utilize aqueous polyhydric alcohols in the form of solvents in foods such as desserts, candies, and marshmallows among others. Gelatin is fat & cholesterol free, high in protein content, and has a low calorific value, which makes it a suitable option in low-sugar and fat-free foods including mayonnaise, yogurt, and candies. Gelatin is typically used in convenience foods including frozen foods, ready-to-eat and packed foods along with confectionaries. Growing demand for packed foods on account of changing consumer lifestyles including eating habits, long working hours, and the increasing workforce of women is expected to drive the product demand.
Gelatin is used as encapsulation material for nutraceuticals including omega 3, coconut oil, garlic oil, lutein, lycopene, and oregano oil which are beneficial to human health. . It is used to manufacture soft and hard capsules which encapsulate the active ingredient. Rising consumer awareness regarding general well-being, prevention of future health risks, existing health issues, and bodybuilding are some of the key factors influencing the growth of the nutraceuticals industry over the forecast period. Gelatin is also used in a wide range of pharmaceutical products to manufacture hard & soft capsules, syrups, tablets, and plasma substitutes for medicines. Moreover, support by regulatory authorities such as the Scientific Steering Committee (SSC) of Europe and the U.S. FDA for the consumption of gelatin-based products for human consumption has positively impacted market growth over the past few years.
Hydrocolloids including agar, xanthan gum, carrageen, pectin, guar gum, and gum Arabic can substitute gelatin in numerous applications. Majority of these products have emulsification and gelling properties; qualities exhibited by gelatin. Low cost of these products coupled with increasing supply-demand gap of gelatin is expected to result in increasing the demand for hydrocolloids. Agar is a better gelling agent than gelatin as a lesser quantity of the product can be employed in order to get the same strength. Carrageenan is a better substitute to gelatin than agar, however, it is difficult to find and obtain the right kind. The closest hydrocolloid which can be used as a substitute to gelatin in terms of its properties is iota type carrageenan. Such factors are expected to hamper the gelatin market in the coming years.
This section will provide insights into the contents included in this gelatin market report and help gain clarity on the structure of the report to assist readers in navigating smoothly.
Industry overview
Industry trends
Market drivers and restraints
Market size
Growth prospects
Porter’s analysis
PESTEL analysis
Key market opportunities prioritized
Competitive landscape
Company overview
Financial performance
Product benchmarking
Latest strategic developments
Market size, estimates, and forecast from 2018 to 2030
Market estimates and forecast for product segments up to 2030
Regional market size and forecast for product segments up to 2030
Market estimates and forecast for application segments up to 2030
Regional market size and forecast for application segments up to 2030
Company financial performance
A three-pronged approach was followed for deducing the gelatin market estimates and forecasts. The process has three steps: information procurement, analysis, and validation. The whole process is cyclical, and steps repeat until the estimates are validated. The three steps are explained in detail below:
Information procurement: Information procurement is one of the most extensive and important stages in our research process, and quality data is critical for accurate analysis. We followed a multi-channel data collection process for gelatin market to gather the most reliable and current information possible.
Analysis: We mine the data collected to establish baselines for forecasting, identify trends and opportunities, gain insight into consumer demographics and drivers, and so much more. We utilized different methods of gelatin market data depending on the type of information we’re trying to uncover in our research.
Market Research Efforts: Bottom-up Approach for estimating and forecasting demand size and opportunity, top-down Approach for new product forecasting and penetration, and combined approach of both Bottom-up and Top-down for full coverage analysis.
Value-Chain-Based Sizing & Forecasting: Supply-side estimates for understanding potential revenue through competitive benchmarking, forecasting, and penetration modeling.
Demand-side estimates for identifying parent and ancillary markets, segment modeling, and heuristic forecasting.
Qualitative Functional Deployment (QFD) Modelling for market share assessment.
Market formulation and validation: We mine the data collected to establish baselines for forecasting, identify trends and opportunities, gain insight into consumer demographics and drivers, and so much more. We utilize different methods of data analysis depending on the type of information we’re trying to uncover in our research.
Market Formulation: This step involves the finalization of market numbers. This step on an internal level is designed to manage outputs from the Data Analysis step.
Data Normalization: The final market estimates and forecasts are then aligned and sent to industry experts, in-panel quality control managers for validation.
This step also entails the finalization of the report scope and data representation pattern.
Validation: The process entails multiple levels of validation. All these steps run in parallel, and the study is forwarded for publishing only if all three levels render validated results.
The gelatin market was categorized into five segments, namely source (Animal Source, Plant Source), function (Stabilizer, Thickener, Gelling Agent), type (Type A and B), application (Food & Beverages, Healthcare, Cosmetics), and region (North America, Europe, Asia Pacific, Latin America, and Middle East & Africa).
The gelatin market was segmented into source, function, type, application, and regions. The demand at a segment level was deduced using a funnel method. Concepts like the TAM, SAM, SOM, etc., were put into practice to understand the demand. We at GVR deploy three methods to deduce market estimates and determine forecasts. These methods are explained below:
Demand estimation of each product across countries/regions summed up to from the total market.
Variable analysis for demand forecast.
Demand estimation via analyzing paid database, and company financials either via annual reports or paid database.
Primary interviews for data revalidation and insight collection.
Used extensively for new product forecasting or analyzing penetration levels.
Tool used invoice product flow and penetration models Use of regression multi-variant analysis for forecasting Involves extensive use of paid and public databases.
Primary interviews and vendor-based primary research for variable impact analysis.
The gelatin market was analyzed at a regional level. The globe was divided into North America, Europe, Asia Pacific, Latin America, and Middle East & Africa, keeping in focus variables like consumption patterns, export-import regulations, consumer expectations, etc. These regions were further divided into thirty-two countries, namely, the U.S.; Canada; Germany; the UK; France; Italy; Spain; Russia; Portugal; The Netherlands, Switzerland, Poland, China, Japan, India, Indonesia, Vietnam, Thailand, Philippines, Brazil, Mexico, Ecuador, Peru, Bolivia, Chile, Argentina, South Africa, Saudi Arabia, Turkey, UAE, Qatar, Israel.
All three above-mentioned market research methodologies were applied to arrive at regional-level conclusions. The regions were then summed up to form the global market.
The gelatin market was analyzed via companies operating in the sector. Analyzing these companies and cross-referencing them to the demand equation helped us validate our assumptions and conclusions. Key market players analyzed include:
GELITA AG - The company was previously known as DGF Stoess AG and later changed its name to GELITA AG in April 2005. GELITA AG manufactures and supplies collagen-based products worldwide. Its product portfolio includes collagen, gelatin, collagen peptides & fats, and minerals & proteins. The company caters its products to the food & beverage, pharmaceutical, health & nutrition, and pet food industries
Rousselot – Rousselot manufactures and supplies gelatin and hydrolyzed collagen to the food, pharmaceutical, and healthcare industries. The company operates as a subsidiary of Darling Ingredients, Inc. Its product portfolio includes a wide range of products, namely Gelatin, Synergy Systems, ProTake, SiMoGel, StabiCaps, X-Pure, and Peptan Collagen Peptides.
PB Leiner - PB Leiner operates as a subsidiary of Tessenderlo Group. It manufactures and distributes gelatin and collagen peptides worldwide. The company sources gelatin and collagen peptides from the skin and bones of porcine and bovine animals and caters them to various end-use industries including food & beverage, pharmaceutical, cosmetic, and photography.
STERLING GELATIN - Sterling Gelatin is engaged in manufacturing and distributing gelatin worldwide. It sources its gelatin from meat processing and leather industries. The gelatin offered by the company is suitable for manufacturing hard & soft gelatin capsules, tablets, vitamin encapsulation, and tablet binding as well as for food preparation such as canned meat, marshmallows, jellies, mousse, and yogurt.
Weishardt Holding SA - Weishardt Holding SA is a multinational company that manufactures and supplies collagen products across the world. Its product portfolio includes pig & fish skin gelatin, fish collagen peptides, and texturing systems. Furthermore, it has four production sites and four international sales offices located in France, Canada, Slovakia, Spain, Japan, Poland, and Hungary.
Junca Gelatines SL - Junca Gelatines SL develops and distributes gelatin worldwide. The company caters its products to the food & beverage, pharmaceutical, and nutraceutical industries. Its product portfolio includes gelatin of various grades, which are used to produce capsule shells, medicines, dietary supplements, and functional foods such as yogurt and fortified drinks.
Nitta Gelatin, Inc. - Nitta Gelatin, Inc. specializes in the production and distribution of gelatin and collagen peptides. The pharmaceutical-grade gelatin is specifically sold in capsule form under the brand name DRG, whereas the biomedical-grade gelatin is sold under the brand name beMatrix.
PAN Biotech GmbH - PAN Biotech GmbH is engaged in manufacturing biochemicals as well as solutions for cell cultures. The company’s product portfolio includes a wide range of sera, serum-free systems, reagents, biologicals, laboratory materials, molecular biology solutions, and cell structure products.
Shanghai Al-Amin Biotechnology Co., Ltd - Shanghai Al-Amin Biotechnology Co., Ltd manufactures and supplies raw ingredients for the food and nutraceutical industries. It also offers gelatin and hydrolyzed collagen for use in skin & personal care and pharmaceutical products. It operates its business through an extensive distribution network spread across China, India, the U.S., and parts of Europe.
Tessenderlo Group - Tessenderlo Group is a chemical company engaged in the manufacturing of bio-residuals and providing agricultural services, and industrial solutions globally. The company caters its services through four business segments, namely agro, industrial solutions, bio-valorization, and T-power.
Supply Side Estimates
Company revenue estimation via referring to annual reports, investor presentations, and Hoover’s.
Segment revenue determination via variable analysis and penetration modeling.
Competitive benchmarking to identify market leaders and their collective revenue shares.
Forecasting via analyzing commercialization rates, pipelines, market initiatives, distribution networks, etc.
Demand side estimates
Identifying parent markets and ancillary markets
Segment penetration analysis to obtain pertinent
revenue/volume
Heuristic forecasting with the help of subject matter experts
Forecasting via variable analysis
Understanding market dynamics (in terms of drivers, restraints, & opportunities) in the countries.
Understanding trends & variables in the individual countries & their impact on growth and using analytical tools to provide high-level insights into the market dynamics and the associated growth pattern.
Understanding market estimates and forecasts (with the base year as 2023, historic information from 2018 to 2022, and forecast from 2024 to 2030). Regional estimates & forecasts for each category are available and are summed up to form the global market estimates.
The report provides market value for the base year 2023 and a yearly forecast till 2030 in terms of revenue/volume or both. The market for each of the segment outlooks has been provided on region & country basis for the above-mentioned forecast period.
The key industry dynamics, major technological trends, and application markets are evaluated to understand their impact on the demand for the forecast period. The growth rates were estimated using correlation, regression, and time-series analysis.
We have used the bottom-up approach for market sizing, analyzing key regional markets, dynamics, & trends for various products and end-users. The total market has been estimated by integrating the country markets.
All market estimates and forecasts have been validated through primary interviews with the key industry participants.
Inflation has not been accounted for to estimate and forecast the market.
Numbers may not add up due to rounding off.
Europe consists of EU-8, Central & Eastern Europe, along with the Commonwealth of Independent States (CIS).
Asia Pacific includes South Asia, East Asia, Southeast Asia, and Oceania (Australia & New Zealand).
Latin America includes Central American countries and the South American continent
Middle East includes Western Asia (as assigned by the UN Statistics Division) and the African continent.
GVR strives to procure the latest and unique information for reports directly from industry experts, which gives it a competitive edge. Quality is of utmost importance to us, therefore every year we focus on increasing our experts’ panel. Primary interviews are one of the critical steps in identifying recent market trends and scenarios. This process enables us to justify and validate our market estimates and forecasts to our clients. With more than 8,000 reports in our database, we have connected with some key opinion leaders across various domains, including healthcare, technology, consumer goods, and the chemical sector. Our process starts with identifying the right platform for a particular type of report, i.e., emails, LinkedIn, seminars, or telephonic conversation, as every report is unique and requires a differentiated approach.
We send out questionnaires to different experts from various regions/ countries, which is dependent on the following factors:
Report/Market scope: If the market study is global, we send questionnaires to industry experts across various regions, including North America, Europe, Asia Pacific, Latin America, and MEA.
Market Penetration: If the market is driven by technological advancements, population density, disease prevalence, or other factors, we identify experts and send out questionnaires based on region or country dominance.
The time to start receiving responses from industry experts varies based on how niche or well-penetrated the market is. Our reports include a detailed chapter on the KoL opinion section, which helps our clients understand the perspective of experts already in the market space.
"The quality of research they have done for us has been excellent."