The global flooring market size was valued at USD 277.67 billion in 2023 and is expected to grow at a compound annual growth rate (CAGR) of 5.4% from 2024 to 2030. Increasing demand for aesthetic, superior, and durable floor covering solutions and changing consumer trends in floor design are aiding the growth of the flooring industry over the past few years. The expansion of offices & workspaces, improving consumer lifestyle, and rapid urbanization are factors that have also contributed to the market growth. The fast-paced infrastructural development owing to the rising population in developing countries further contributes to the growth of the flooring industry.
The growing disposable income has resulted in increased investments for comfort in residential buildings. Additionally, the continuous growth of high-end residential housing structures and the subsequent and growing preference for single-family housing structures are driving the demand for the market.
Domestic and foreign manufacturers are heavily investing in the U.S. regional market to meet the rising demand from various application industries. Several construction projects are underway in the U.S. For instance, in 2020, Amazon started the construction of its HQ2 building, which is estimated to be worth USD 2.5 billion. The mega project continues to make head turns in the construction industry as Amazon plans completion by 2023. The increasing large investments in such projects is expected to boost the demand for flooring, thereby increasing U.S. flooring market size.
The advancements in easy-to-install techniques, the availability of innovative construction solutions, and the rising demand for environmentally sustainable products are expected to drive the industry’s growth. The stringent regulatory framework during the production, usage, implementation, and recycling stages is also expected to boost market growth.
Furthermore, consumer preferences for aesthetically improved designs, textures, and colors, as well as low-maintenance and easy-to-install floorings, are expected to drive market growth. The growing desire for comfort and privacy as a result of noisier surroundings has increased the demand for insulation in the market, as well-insulated floors create a better acoustic environment. As a result, demand for floor insulation has increased, supporting market growth.
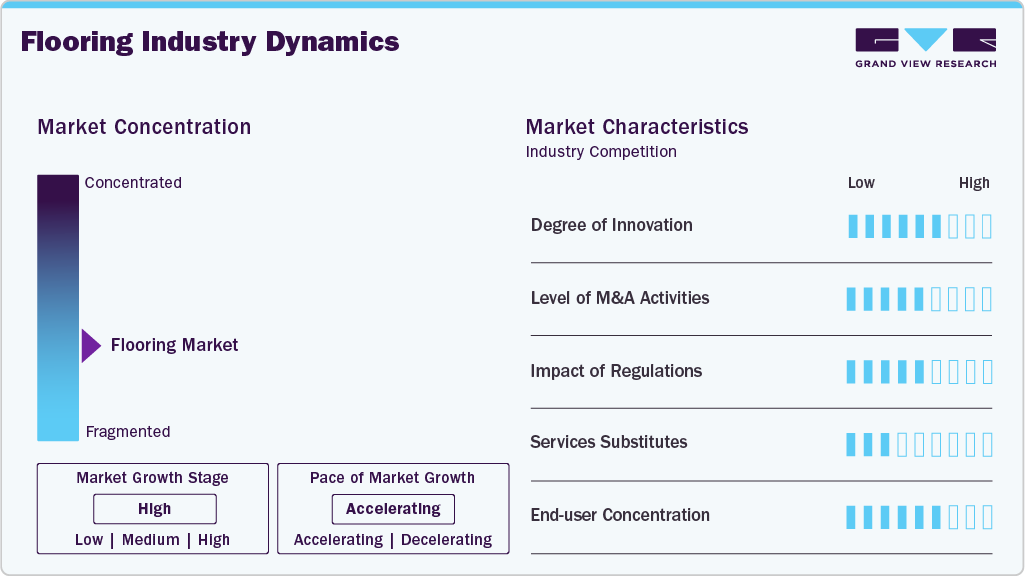
The flooring market growth stage is medium, and pace of growth is accelerating. The market is highly fragmented on account of the presence of a large number of manufacturers.These prominent manufacturers compete on the basis of product quality and prices in order to increase their applications in residential and commercial flooring.
Flooring market is characterized by a high degree of innovation as prominent players in the market are focusing on increasing investments in order to enhance the product with waterproofing properties. Moreover, digital printing technologies are being used by the ceramic tile manufacturers to produce flooring with a variety of designs and textiles.
Market is also characterized by a high level of merger and acquisition (M&A) activity by the players. Players are focusing on achieving optimum business growth and a strong market position by adopting various strategies including joint ventures, integration by acquisitions, and mergers.For instance, Mohawk has completed several acquisitions in the past few years in order to enhance its product portfolio and expand its geographical reach across the globe.
Market is also subject to increasing regulatory scrutiny. Government support toward sustainable production practices in order to reduce the harmful environment impacts is likely to result in sluggish market growth. China had launched a comprehensive three year plan to reduce emissions of volatile organic compounds (VOC). This move is expected to have a significant impact on its vinyl flooring industry.
A wide range of internal substitutes from traditional flooring materials including ceramic, wood, laminates, carpet, natural stone, and others are available in the market. The development of eco-friendly solutions including cork, natural linoleum, bamboo, and rubber pose a threat to the market growth. Furthermore, laminate flooring are direct substitutes for wood flooring. Therefore, the threat of internal substitutes is anticipated to be high over the forecast period.
A large number of buyers spanning from residential establishments to pavements, commercial structures, and industrial structures are present at the global level. Urbanization and industrial developments, particularly in emerging economies such as China, India, and Brazil, are anticipated to result in high end-use concentration.
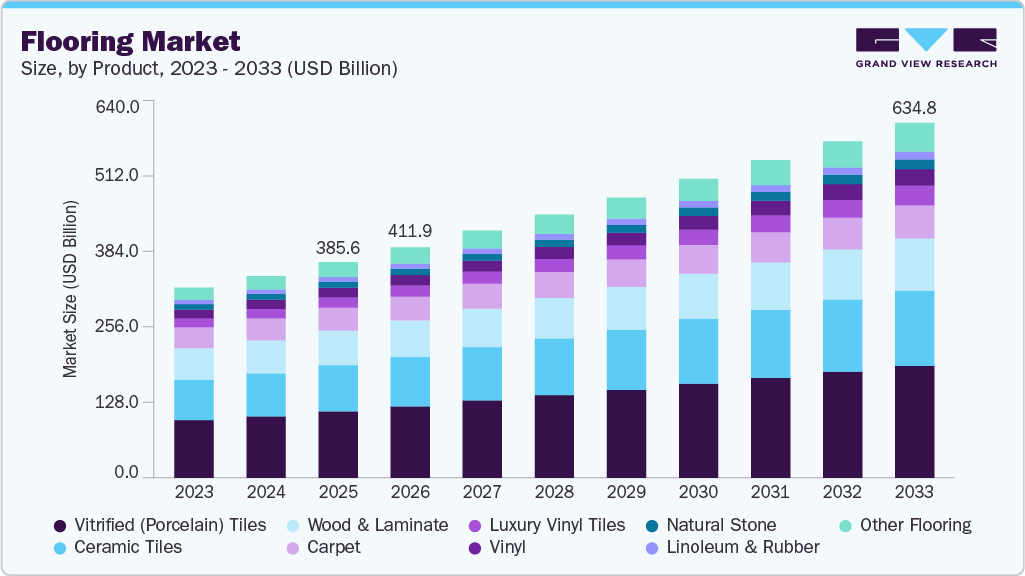
The vitrified (Porcelain) tile segment led the market and accounted for over 25% of revenue share in 2023. This is owing to the properties of porcelain tiles such as additional strength, and more durability as compared to general ceramic tiles. These tiles can withstand extreme temperatures and are made from ultrafine and denser clays.
Their durability also shines with features such as mold and bacteria resistance offered by impervious porcelain tiles substantially increasing the long-term value of floor covering. In addition, this flooring product does not fade and is easy to maintain.
The ceramic tiles segment accounted for over 20% of the total revenue share in 2023. Ceramic tiles are primarily of three types, namely glazed tiles, unglazed tiles, and scratch-resistant tiles. Scratch-resistant tiles are primarily utilized for high footfall areas, such as landscapes, pathways, parking, and shop floors, to cater to the enormous stress of its application.
The wood & laminate segment was estimated at USD 53.9 million in 2023 and is further estimated to grow at a substantial CAGR over the coming years. This growth is attributed to the rising significance of wood in luxury construction in residential as well as commercial areas. It offers numerous advantages including strength, durability, easy maintenance, aesthetics, the high monetary value of the house, steady appearance, the option of refinishing, improved acoustics, and improved air quality.
Natural stone is a little expensive compared to other flooring products. These products include marble, granite, limestone, sandstone, quartzite, and others. Natural stone flooring is widely used for durability, beauty, and lasting value. These stones are excellent for bathrooms, hallways, living, and outdoor areas. Owing to the surge in demand for natural stone products, companies are investing to strengthen their position in the market.
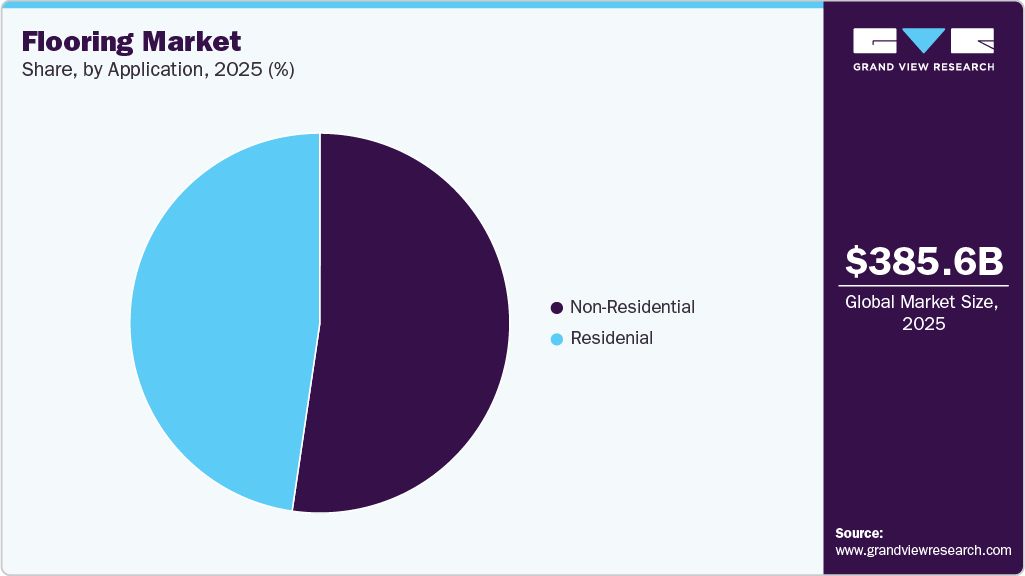
The residential application segment dominated the market and accounted for 49.5% of the revenue share in 2023 in the market. The residential end-use segment includes residential buildings, apartments, complexes, and small houses. Subsidies from governments for first-time homebuyers in developing and developed economies have positively affected the growth of the residential sector.
The developing countries in the Asia Pacific region have announced various schemes to support the development of the real estate sector. These schemes are partially or fully funded by governments in these countries, which ultimately benefits the demand side of the construction sector. This is likely to propel the growth of the flooring industry over the coming years.
The commercial application segment accounted for 42.8% of the revenue share in 2023. Commercial applications often involve high-traffic areas and therefore require durable flooring such as resilient and wooden. Flooring products are used in numerous commercial building applications including offices, convenience stores, shopping malls, and the construction of other retail stores.
Increasing construction of commercial buildings, such as drugstores, grocery, and big-box stores, over the past few years, is expected to benefit the segment growth over the coming years. Moreover, robust demand for office spaces, especially in urban areas of emerging economies, is also propelling demand for high-quality flooring products.
The Asia Pacific region dominated the market and accounted for 45.9% of the total revenue share in 2023. Factors such as increasing investment in affordable housing, smart city construction, upgradation & construction of infrastructure, and investment in the tourism sector are expected to boost the demand for flooring products over the forecast period.
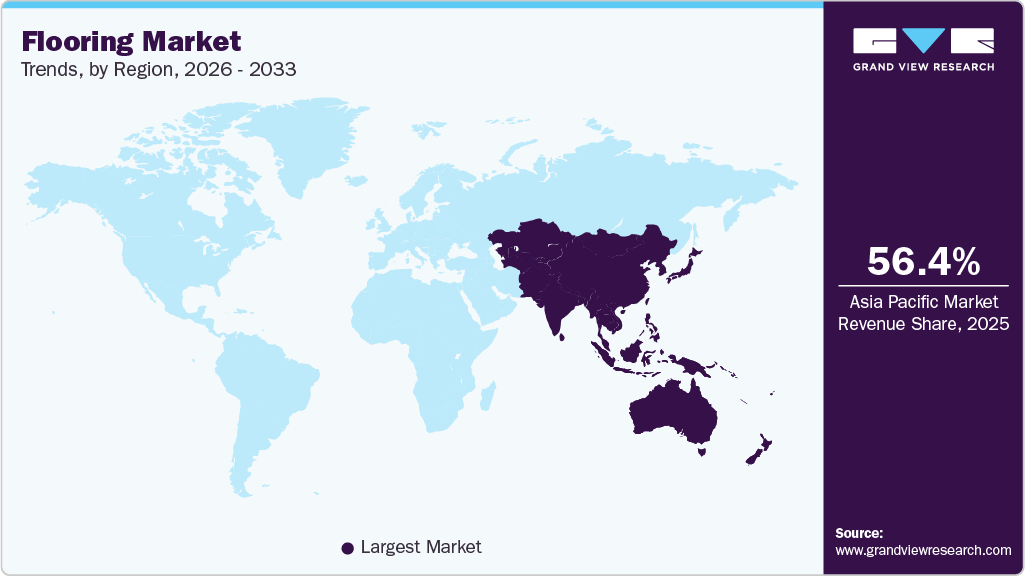
The construction industry in the Asia Pacific is expected to grow on account of the rising per capita income, rapid urbanization, and expanding population. The expansion of residential, commercial, and industrial sectors on account of sustainable economic growth in the region is expected to boost construction activities, thereby, driving the market for flooring over the forecast period.
The flooring industry in the Middle East and Africa accounted for over 10% of revenue share in 2023. Improved funding by the Middle East and African governments, owing to the availability of financing options such as public-private partnerships, domestic capital markets, and private investment funds, is expected to boost the growth of the construction industry, thereby, driving the flooring industry in the region.
Manufacturers holding a major share in the flooring industry have established channels of distribution across various countries. For instance, Mohawk Industries, Inc. has its operations across 15 countries and sales across over 140 countries including the U.S., Russia, Mexico, Malaysia, India, Europe, China, Canada, Brazil, and Australia. This has helped manufacturers in gaining a major share of the market.
Additionally, manufacturers are also establishing a strong online presence for the sake of gaining a competitive edge. The development of innovative products and proper display & distribution systems, which includes online catalogs and virtual assistants, help the consumers choose the ideal product for the intended application. Thereby, the customers intend to visit online websites before visiting stores for collecting information regarding the products and the company. This has given an edge to manufacturers with a strong foothold in the virtual world.
In March 2023, Shaw Industries Group, Inc. announced its partnership with Encina for recycling waste generated from carpet manufacturing. Shaw Industries will provide more than USD 2.5 million of waste every year to Encina. The partnership will help the former decrease its greenhouse gas emissions as well as carbon footprint, which in turn will help the company achieve its sustainability target.
In January 2023, Interface, Inc. launched a new winter collection of carpet tiles under the brand FLOR. The collection consists of new colorway and styles, which adds comfort and warmth to a space. Furthermore, the collection is replaceable, easy to clean, and durable.
Report Attribute |
Details |
Market size value in 2024 |
USD 290.72 billion |
Revenue forecast in 2030 |
USD 398.27 billion |
Growth Rate |
CAGR of 5.4% from 2024 to 2030 |
Historical data |
2018 - 2023 |
Forecast period |
2024 - 2030 |
Quantitative units |
Volume in million square meters, revenue in USD billion and CAGR from 2024 to 2030 |
Report coverage |
Volume & revenue forecast, company ranking, competitive landscape, growth factors, and trends |
Segments covered |
Product, application, region |
Region scope |
North America; Europe; Asia Pacific; Central & South America; Middle East & Africa |
Country scope |
U.S.; Canada; Mexico; Germany; U.K.; France; Italy; Spain; Russia; Romania; Czech Republic; Portugal; Ukraine; Slovakia; Hungary; China; India; Japan; Indonesia; South Korea; Australia; Philippines; Vietnam; Saudi Arabia; UAE; Israel; Qatar; South Africa; Morocco; Brazil; Argentina; Peru; Colombia; Chile |
Key companies profiled |
Mohawk Industries, Inc.; Tarkett, S.A.; AFI Licensing; Burke Flooring Products, Inc.; Firbo Flooring; Shaw Industries, Inc.; Interface, Inc.; Gerflor; Mannington Mills, Inc.; Polyflor; RAK Ceramics; Crossville Inc.; Atlas Concorde S.P.A.; Porcelanosa Group; Kajaria Ceramics Limited |
Customization scope |
Free report customization (equivalent up to 8 analysts’ working days) with purchase. Addition or alteration to country, regional & segment scope. |
Pricing and purchase options |
Avail customized purchase options to meet your exact research needs. Explore purchase options |
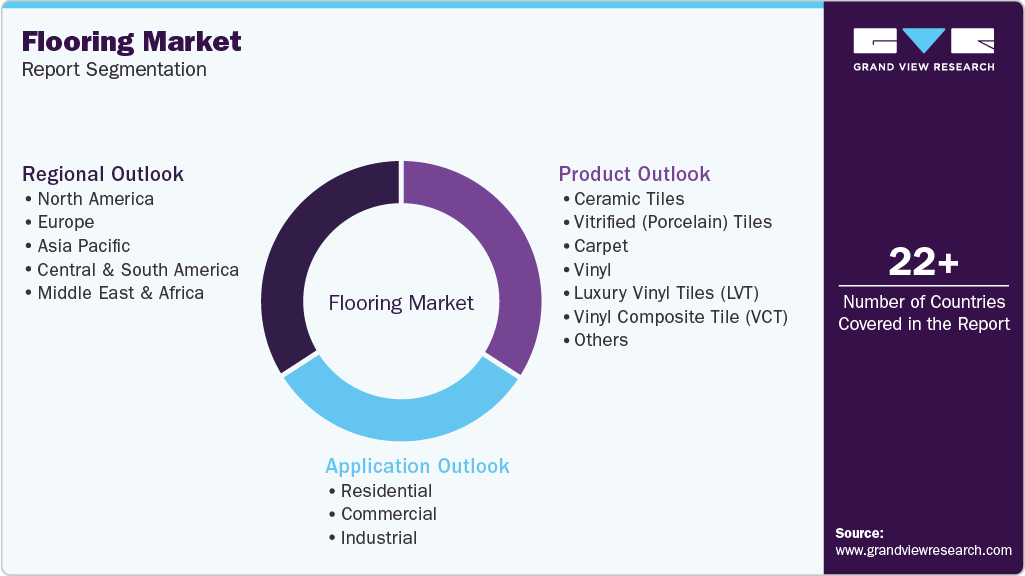
This report forecasts revenue growth at global, regional & country levels and provides an analysis on the industry trends in each of the sub-segments from 2018 to 2030. For the purpose of this study, Grand View Research has segmented the flooring market on the basis of product, application and region:
Product Outlook (Volume, Million Square Meters; Revenue, USD Million; 2018 - 2030)
Ceramic Tiles
Vitrified (Porcelain) Tiles
Carpet
Vinyl
Luxury Vinyl Tiles (LVT)
Linoleum/Rubber
Wood & Laminate
Natural Stone
Other Flooring Materials
Application Outlook (Volume, Million Square Meters; Revenue, USD Million; 2018 - 2030 )
Residential
Commercial
Industrial
Regional Outlook (Volume, Million Square Meters; Revenue, USD Million; 2018 - 2030 )
North America
U.S.
Canada
Mexico
Europe
Germany
UK
France
Italy
Spain
Russia
Romania
Czech Republic
Portugal
Ukraine
Slovakia
Hungary
Asia Pacific
China
India
Japan
South Korea
Australia
Indonesia
Philippines
Vietnam
Middle East & Africa
Saudi Arabia
UAE
Israel
Egypt
Qatar
South Africa
Morocco
Central & South America
Brazil
Argentina
Peru
Colombia
Chile
b. The global flooring market size was estimated at USD 266.48 billion in 2022 and is expected to reach USD 277.67 billion in 2023.
b. The flooring market is expected to grow at a compound annual growth rate of 5.6% from 2023 to 2030 to reach USD 398.27 billion by 2030.
b. Residential construction dominated the flooring market with a share of 49.4% in 2022. This is attributed to growing population and increased spending in residential structures enhancements.
b. Some of the key players operating in the flooring market include Mohawk Industries, Inc., Tarkett, S.A., AFI Licensing, Burke Flooring Products, Inc., Firbo Flooring, Shaw Industries, Inc., Interface, Inc., Gerflor, Mannington Mills, Inc., Polyflor, RAK Creamics, Crossville Inc., Atlas Concorde S.P.A., Porcelanosa Group, Kajaria Ceramics Limited
b. The key factors that are driving the flooring market include rapidly rising construction activities in developing countries around the globe. In addition, investments in several developing countries such as India, Brazil, and South Korea towards development of the non-residential construction industry, is expected to drive the market growth over the forecast period.
Table of Contents
Chapter 1. Flooring Market: Methodology and Scope
1.1. Research Methodology
1.2. Research Scope & Assumption
1.3. Information Procurement
1.3.1. Purchased Database
1.3.2. GVR’s Internal Database
1.3.3. Secondary Sources & Third-Party Perspectives
1.3.4. Primary Research
1.4. Information Analysis
1.4.1. Data Analysis Models
1.5. Market Formulation & Data Visualization
1.6. Data Validation & Publishing
Chapter 2. Flooring Market: Executive Summary
2.1. Market Snapshot
2.2. Segmental Insights
Chapter 3. Flooring Market Variables, Trends & Scope
3.1. Market Lineage Outlook
3.2. Industry Value Chain Analysis
3.2.1. Raw Material Trends
3.2.2. Manufacturing Trends
3.2.3. Sales Channel Analysis
3.3. Technology Overview
3.4. Regulatory Framework
3.5. Market Dynamics
3.5.1. Market Driver Analysis
3.5.2. Market Restraint Analysis
3.5.3. Industry Challenges
3.6. Business Environment Analysis: Flooring Market
3.6.1. Industry Analysis - Porter’s
3.6.1.1. Supplier Power
3.6.1.2. Buyer Power
3.6.1.3. Threat of Substitution
3.6.1.4. Threat from New Entrants
3.6.1.5. Competitive Rivalry
3.6.2. PESTEL Analysis by SWOT
3.6.2.1. Political Landscape
3.6.2.2. Environmental Landscape
3.6.2.3. Social Landscape
3.6.2.4. Technology Landscape
3.6.2.5. Economic Landscape
3.6.2.6. Legal Landscape
3.7. Market Disruption Analysis
Chapter 4. Flooring Market: Product Estimates & Trend Analysis
4.1. Key Takeaways
4.2. Product Market Share Analysis, 2022 & 2030
4.3. Market size & forecasts and trend analysis, 2018 to 2030
4.3.1. Ceramic Tiles
4.3.1.1. Ceramic tiles flooring market estimates and forecast, 2018 - 2030 (Million Sq. Meters) (USD Million)
4.3.2. Vitrified (Porcelain) Tiles
4.3.2.1. Vitrified (porcelain) tiles flooring market estimates and forecast, 2018 - 2030 (Million Sq. Meters) (USD Million)
4.3.3. Carpet
4.3.3.1. Carpet flooring market estimates and forecast, 2018 - 2030 (Million Sq. Meters) (USD Million)
4.3.4. Vinyl
4.3.4.1. Vinyl flooring market estimates and forecast, 2018 - 2030 (Million Sq. Meters) (USD Million)
4.3.5. Luxury Vinyl Tiles
4.3.5.1. Luxury vinyl tiles flooring market estimates and forecast, 2018 - 2030 (Million Sq. Meters) (USD Million)
4.3.6. Linoleum & Rubber
4.3.6.1. Linoleum & rubber flooring market estimates and forecast, 2018 - 2030 (Million Sq. Meters) (USD Million)
4.3.7. Wood & Laminate
4.3.7.1. Wood & laminate flooring market estimates and forecast, 2018 - 2030 (Million Sq. Meters) (USD Million)
4.3.8. Natural Stone
4.3.8.1. Natural stone flooring market estimates and forecast, 2018 - 2030 (Million Sq. Meters) (USD Million)
4.3.9. Other Flooring Materials
4.3.9.1. Other flooring materials market estimates and forecast, 2018 - 2030 (Million Sq. Meters) (USD Million)
Chapter 5. Flooring Market: Application Estimates & Trend Analysis
5.1. Key Takeaways
5.2. Application Market Share Analysis, 2022 & 2030
5.3. Market size & forecasts and trend analysis, 2018 to 2030 for the following:
5.3.1. Residential
5.3.1.1. Flooring market estimates and forecast in residential application, 2018 - 2030 (Million Sq. Meters) (USD Million)
5.3.2. Commercial
5.3.2.1. Flooring market estimates and forecast in commercial application, 2018 - 2030 (Million Sq. Meters) (USD Million)
5.3.3. Industrial
5.3.3.1. Flooring market estimates and forecast in industrial application, 2018 - 2030 (Million Sq. Meters) (USD Million)
Chapter 6. Flooring Market: Regional Estimates & Trend Analysis
6.1. Key Takeaways
6.2. Region Market Share Analysis, 2022 & 2030
6.2.1. North America
6.2.1.1. North America flooring market estimates and forecasts, 2018 - 2030 (Million Sq. Meters) (USD Million)
6.2.1.2. U.S.
6.2.1.2.1. U.S. flooring market estimates and forecasts, 2018 - 2030 (Million Sq. Meters) (USD Million)
6.2.1.3. Canada
6.2.1.3.1. Canada flooring market estimates and forecasts, 2018 - 2030 (Million Sq. Meters) (USD Million)
6.2.1.4. Mexico
6.2.1.4.1. Mexico flooring market estimates and forecasts, 2018 - 2030 (Million Sq. Meters) (USD Million)
6.2.2. Europe
6.2.2.1. Europe flooring market estimates and forecasts, 2018 - 2030 (Million Sq. Meters) (USD Million)
6.2.2.2. Germany
6.2.2.2.1. Germany flooring market estimates and forecasts, 2018 - 2030 (Million Sq. Meters) (USD Million)
6.2.2.3. U.K.
6.2.2.3.1. UK flooring market estimates and forecasts, 2018 - 2030 (Million Sq. Meters) (USD Million)
6.2.2.4. Spain
6.2.2.4.1. Spain flooring market estimates and forecasts, 2018 - 2030 (Million Sq. Meters) (USD Million)
6.2.2.5. Italy
6.2.2.5.1. Italy flooring market estimates and forecasts, 2018 - 2030 (Million Sq. Meters) (USD Million)
6.2.2.6. Russia
6.2.2.6.1. Russia flooring market estimates and forecasts, 2018 - 2030 (Million Sq. Meters) (USD Million)
6.2.2.7. Romania
6.2.2.7.1. Romania flooring market estimates and forecasts, 2018 - 2030 (Million Sq. Meters) (USD Million)
6.2.2.8. Czech Republic
6.2.2.8.1. Czech Republic flooring market estimates and forecasts, 2018 - 2030 (Million Sq. Meters) (USD Million)
6.2.2.9. Portugal
6.2.2.9.1. Portugal flooring market estimates and forecasts, 2018 - 2030 (Million Sq. Meters) (USD Million)
6.2.2.10. Ukraine
6.2.2.10.1. Ukraine flooring market estimates and forecasts, 2018 - 2030 (Million Sq. Meters) (USD Million)
6.2.2.11. Slovakia
6.2.2.11.1. Slovakia flooring market estimates and forecasts, 2018 - 2030 (Million Sq. Meters) (USD Million)
6.2.2.12. Hungary
6.2.2.12.1. Hungary flooring market estimates and forecasts, 2018 - 2030 (Million Sq. Meters) (USD Million)
6.2.3. Asia Pacific
6.2.3.1. Asia Pacific flooring market estimates and forecasts, 2018 - 2030 (Million Sq. Meters) (USD Million)
6.2.3.2. China
6.2.3.2.1. China flooring market estimates and forecasts, 2018 - 2030 (Million Sq. Meters) (USD Million)
6.2.3.3. Japan
6.2.3.3.1. Japan flooring market estimates and forecasts, 2018 - 2030 (Million Sq. Meters) (USD Million)
6.2.3.4. India
6.2.3.4.1. India flooring market estimates and forecasts, 2018 - 2030 (Million Sq. Meters) (USD Million)
6.2.3.5. South Korea
6.2.3.5.1. South Korea flooring market estimates and forecasts, 2018 - 2030 (Million Sq. Meters) (USD Million)
6.2.3.6. Australia
6.2.3.6.1. Australia flooring market estimates and forecasts, 2018 - 2030 (Million Sq. Meters) (USD Million)
6.2.3.7. Indonesia
6.2.3.7.1. Indonesia flooring market estimates and forecasts, 2018 - 2030 (Million Sq. Meters) (USD Million)
6.2.3.8. Philippines
6.2.3.8.1. Philippines flooring market estimates and forecasts, 2018 - 2030 (Million Sq. Meters) (USD Million)
6.2.3.9. Vietnam
6.2.3.9.1. Vietnam flooring market estimates and forecasts, 2018 - 2030 (Million Sq. Meters) (USD Million)
6.2.4. Central & South America
6.2.4.1. Central & South America flooring market estimates and forecasts, 2018 - 2030 (Million Sq. Meters) (USD Million)
6.2.4.2. Brazil
6.2.4.2.1. Brazil flooring market estimates and forecasts, 2018 - 2030 (Million Sq. Meters) (USD Million)
6.2.4.3. Argentina
6.2.4.3.1. Argentina flooring market estimates and forecasts, 2018 - 2030 (Million Sq. Meters) (USD Million)
6.2.5. Middle East & Africa
6.2.5.1. Middle East & Africa flooring market estimates and forecasts, 2018 - 2030 (Million Sq. Meters) (USD Million)
6.2.5.2. Saudi Arabia
6.2.5.2.1. Saudi Arabia flooring market estimates and forecasts, 2018 - 2030 (Million Sq. Meters) (USD Million)
6.2.5.3. UAE
6.2.5.3.1. UAE flooring market estimates and forecasts, 2018 - 2030 (Million Sq. Meters) (USD Million)
6.2.5.4. Israel
6.2.5.4.1. Israel flooring market estimates and forecasts, 2018 - 2030 (Million Sq. Meters) (USD Million)
6.2.5.5. Egypt
6.2.5.5.1. Egypt flooring market estimates and forecasts, 2018 - 2030 (Million Sq. Meters) (USD Million)
6.2.5.6. Qatar
6.2.5.6.1. Qatar flooring market estimates and forecasts, 2018 - 2030 (Million Sq. Meters) (USD Million)
6.2.5.7. South Africa
6.2.5.7.1. South Africa flooring market estimates and forecasts, 2018 - 2030 (Million Sq. Meters) (USD Million)
6.2.5.8. Morocco
6.2.5.8.1. Morocco flooring market estimates and forecasts, 2018 - 2030 (Million Sq. Meters) (USD Million)
Chapter 7. Competitive Analysis
7.1. Key Players, their Recent Developments, and Their Impact on the Industry
7.2. Key Company/Competition Categorization
7.3. Company Market Position Analysis
7.4. Company Heat Map Analysis
7.5. Company Market Share Analysis, 2022
7.6. Strategy Mapping
7.7. Company Listing
7.7.1. Mohawk Industries, Inc.
7.7.1.1. Company Overview
7.7.1.2. Financial Performance
7.7.1.3. Product Benchmarking
7.7.1.4. Strategic Initiatives
7.7.2. Tarkett, S.A.
7.7.2.1. Company Overview
7.7.2.2. Financial Performance
7.7.2.3. Product Benchmarking
7.7.2.4. Strategic Initiatives
7.7.3. AFI Licensing
7.7.3.1. Company Overview
7.7.3.2. Financial Performance
7.7.3.3. Product Benchmarking
7.7.3.4. Strategic Initiatives
7.7.4. Burke Flooring Products, Inc.
7.7.4.1. Company Overview
7.7.4.2. Financial Performance
7.7.4.3. Product Benchmarking
7.7.4.4. Strategic Initiatives
7.7.5. Forbo Flooring
7.7.5.1. Company Overview
7.7.5.2. Financial Performance
7.7.5.3. Product Benchmarking
7.7.5.4. Strategic Initiatives
7.7.6. Shaw Industries, Inc.
7.7.6.1. Company Overview
7.7.6.2. Financial Performance
7.7.6.3. Product Benchmarking
7.7.6.4. Strategic Initiatives
7.7.7. Interface, Inc.
7.7.7.1. Company Overview
7.7.7.2. Financial Performance
7.7.7.3. Product Benchmarking
7.7.7.4. Strategic Initiatives
7.7.8. Gerflor
7.7.8.1. Company Overview
7.7.8.2. Financial Performance
7.7.8.3. Product Benchmarking
7.7.8.4. Strategic Initiatives
7.7.9. Mannington Mills, Inc.
7.7.9.1. Company Overview
7.7.9.2. Financial Performance
7.7.9.3. Product Benchmarking
7.7.9.4. Strategic Initiatives
7.7.10. Polyflor
7.7.10.1. Company Overview
7.7.10.2. Financial Performance
7.7.10.3. Product Benchmarking
7.7.10.4. Strategic Initiatives
7.7.11. RAK Ceramics
7.7.11.1. Company Overview
7.7.11.2. Financial Performance
7.7.11.3. Product Benchmarking
7.7.11.4. Strategic Initiatives
7.7.12. Crossville Inc.
7.7.12.1. Company Overview
7.7.12.2. Financial Performance
7.7.12.3. Product Benchmarking
7.7.12.4. Strategic Initiatives
7.7.13. Atlas Concorde S.P.A.
7.7.13.1. Company Overview
7.7.13.2. Financial Performance
7.7.13.3. Product Benchmarking
7.7.13.4. Strategic Initiatives
7.7.14. Porcelanosa Group
7.7.14.1. Company Overview
7.7.14.2. Financial Performance
7.7.14.3. Product Benchmarking
7.7.14.4. Strategic Initiatives
7.7.15. Kajaria Ceramics Limited
7.7.15.1. Company Overview
7.7.15.2. Financial Performance
7.7.15.3. Product Benchmarking
7.7.15.4. Strategic Initiatives
List of Tables
Table 1 Ceramic tiles flooring market volume estimates and forecasts, 2018 - 2030 (Million Sq. Meters)
Table 2 Ceramic tiles flooring market revenue estimates and forecasts, 2018 - 2030 (Million Sq. Meters)
Table 3 Vitrified (porcelain) tiles flooring market volume estimates and forecasts, 2018 - 2030 (Million Sq. Meters)
Table 4 Vitrified (porcelain) tiles flooring market revenue estimates and forecasts, 2018 - 2030 (Million Sq. Meters)
Table 5 Carpet flooring market volume estimates and forecasts, 2018 - 2030 (Million Sq. Meters)
Table 6 Carpet flooring market revenue estimates and forecasts, 2018 - 2030 (Million Sq. Meters)
Table 7 Vinyl flooring market volume estimates and forecasts, 2018 - 2030 (Million Sq. Meters)
Table 8 Vinyl flooring market revenue estimates and forecasts, 2018 - 2030 (Million Sq. Meters)
Table 9 Luxury vinyl tiles flooring market volume estimates and forecasts, 2018 - 2030 (Million Sq. Meters)
Table 10 Luxury vinyl tiles flooring market revenue estimates and forecasts, 2018 - 2030 (Million Sq. Meters)
Table 11 Linoleum & rubber flooring market volume estimates and forecasts, 2018 - 2030 (Million Sq. Meters)
Table 12 Linoleum & rubber flooring market revenue estimates and forecasts, 2018 - 2030 (Million Sq. Meters)
Table 13 Wood & laminate flooring market volume estimates and forecasts, 2018 - 2030 (Million Sq. Meters)
Table 14 Wood & laminate flooring market revenue estimates and forecasts, 2018 - 2030 (Million Sq. Meters)
Table 15 Others flooring market volume estimates and forecasts, 2018 - 2030 (Million Sq. Meters)
Table 16 Others flooring market revenue estimates and forecasts, 2018 - 2030 (Million Sq. Meters)
Table 17 Flooring market volume estimates and forecasts, by residential application, 2018 - 2030 (Million Sq. Meters)
Table 18 Flooring market revenue estimates and forecasts, by residential application, 2018 - 2030 (USD Million)
Table 19 Flooring market volume estimates and forecasts, by commercial application, 2018 - 2030 (Million Sq. Meters)
Table 20 Flooring market revenue estimates and forecasts, by commercial application, 2018 - 2030 (USD Million)
Table 21 Flooring market volume estimates and forecasts, by industrial application, 2018 - 2030 (Million Sq. Meters)
Table 22 Flooring market revenue estimates and forecasts, by industrial application, 2018 - 2030 (USD Million)
Table 23 North America flooring market estimates and forecasts, 2018 - 2030 (Million Sq. Meters) (USD Million)
Table 24 North America flooring market volume estimates and forecasts, by product, 2018 - 2030 (Million Sq. Meters)
Table 25 North America flooring market revenue estimates and forecasts, by product, 2018 - 2030 (USD Million)
Table 26 North America flooring market volume estimates and forecasts, by application, 2018 - 2030 (Million Sq. Meters)
Table 27 North America flooring market revenue estimates and forecasts, by application, 2018 - 2030 (USD Million)
Table 28 U.S. flooring market estimates and forecasts, 2018 - 2030 (Million Sq. Meters) (USD Million)
Table 29 U.S. flooring market volume estimates and forecasts, by product, 2018 - 2030 (Million Sq. Meters)
Table 30 U.S. flooring market revenue estimates and forecasts, by product, 2018 - 2030 (USD Million)
Table 31 U.S. flooring market volume estimates and forecasts, by application, 2018 - 2030 (Million Sq. Meters)
Table 32 U.S. flooring market revenue estimates and forecasts, by application, 2018 - 2030 (USD Million)
Table 33 Canada flooring market estimates and forecasts, 2018 - 2030 (Million Sq. Meters) (USD Million)
Table 34 Canada flooring market volume estimates and forecasts, by product, 2018 - 2030 (Million Sq. Meters)
Table 35 Canada flooring market revenue estimates and forecasts, by product, 2018 - 2030 (USD Million)
Table 36 Canada flooring market volume estimates and forecasts, by application, 2018 - 2030 (Million Sq. Meters)
Table 37 Canada flooring market revenue estimates and forecasts, by application, 2018 - 2030 (USD Million)
Table 38 Mexico flooring market estimates and forecasts, 2018 - 2030 (Million Sq. Meters) (USD Million)
Table 39 Mexico flooring market volume estimates and forecasts, by product, 2018 - 2030 (Million Sq. Meters)
Table 40 Mexico flooring market revenue estimates and forecasts, by product, 2018 - 2030 (USD Million)
Table 41 Mexico flooring market volume estimates and forecasts, by application, 2018 - 2030 (Million Sq. Meters)
Table 42 Mexico flooring market revenue estimates and forecasts, by application, 2018 - 2030 (USD Million)
Table 43 Europe flooring market estimates and forecasts, 2018 - 2030 (Million Sq. Meters) (USD Million)
Table 44 Europe flooring market volume estimates and forecasts, by product, 2018 - 2030 (Million Sq. Meters)
Table 45 Europe flooring market revenue estimates and forecasts, by product, 2018 - 2030 (USD Million)
Table 46 Europe flooring market volume estimates and forecasts, by application, 2018 - 2030 (Million Sq. Meters)
Table 47 Europe flooring market revenue estimates and forecasts, by application, 2018 - 2030 (USD Million)
Table 48 Germany flooring market estimates and forecasts, 2018 - 2030 (Million Sq. Meters) (USD Million)
Table 49 Germany flooring market volume estimates and forecasts, by product, 2018 - 2030 (Million Sq. Meters)
Table 50 Germany flooring market revenue estimates and forecasts, by product, 2018 - 2030 (USD Million)
Table 51 Germany flooring market volume estimates and forecasts, by application, 2018 - 2030 (Million Sq. Meters)
Table 52 Germany flooring market revenue estimates and forecasts, by application, 2018 - 2030 (USD Million)
Table 53 UK flooring market estimates and forecasts, 2018 - 2030 (Million Sq. Meters) (USD Million)
Table 54 UK flooring market volume estimates and forecasts, by product, 2018 - 2030 (Million Sq. Meters)
Table 55 UK flooring market revenue estimates and forecasts, by product, 2018 - 2030 (USD Million)
Table 56 UK flooring market volume estimates and forecasts, by application, 2018 - 2030 (Million Sq. Meters)
Table 57 UK flooring market revenue estimates and forecasts, by application, 2018 - 2030 (USD Million)
Table 58 Spain flooring market estimates and forecasts, 2018 - 2030 (Million Sq. Meters) (USD Million)
Table 59 Spain flooring market volume estimates and forecasts, by product, 2018 - 2030 (Million Sq. Meters)
Table 60 Spain flooring market revenue estimates and forecasts, by product, 2018 - 2030 (USD Million)
Table 61 Spain flooring market volume estimates and forecasts, by application, 2018 - 2030 (Million Sq. Meters)
Table 62 Spain flooring market revenue estimates and forecasts, by application, 2018 - 2030 (USD Million)
Table 63 Italy flooring market estimates and forecasts, 2018 - 2030 (Million Sq. Meters) (USD Million)
Table 64 Italy flooring market volume estimates and forecasts, by product, 2018 - 2030 (Million Sq. Meters)
Table 65 Italy flooring market revenue estimates and forecasts, by product, 2018 - 2030 (USD Million)
Table 66 Italy flooring market volume estimates and forecasts, by application, 2018 - 2030 (Million Sq. Meters)
Table 67 Italy flooring market revenue estimates and forecasts, by application, 2018 - 2030 (USD Million)
Table 68 Russia flooring market estimates and forecasts, 2018 - 2030 (Million Sq. Meters) (USD Million)
Table 69 Russia flooring market volume estimates and forecasts, by product, 2018 - 2030 (Million Sq. Meters)
Table 70 Russia flooring market revenue estimates and forecasts, by product, 2018 - 2030 (USD Million)
Table 71 Russia flooring market volume estimates and forecasts, by application, 2018 - 2030 (Million Sq. Meters)
Table 72 Russia flooring market revenue estimates and forecasts, by application, 2018 - 2030 (USD Million)
Table 73 Romania flooring market estimates and forecasts, 2018 - 2030 (Million Sq. Meters) (USD Million)
Table 74 Romania flooring market volume estimates and forecasts, by product, 2018 - 2030 (Million Sq. Meters)
Table 75 Romania flooring market revenue estimates and forecasts, by product, 2018 - 2030 (USD Million)
Table 76 Romania flooring market volume estimates and forecasts, by application, 2018 - 2030 (Million Sq. Meters)
Table 77 Romania flooring market revenue estimates and forecasts, by application, 2018 - 2030 (USD Million)
Table 78 Czech Republic flooring market estimates and forecasts, 2018 - 2030 (Million Sq. Meters) (USD Million)
Table 79 Czech Republic flooring market volume estimates and forecasts, by product, 2018 - 2030 (Million Sq. Meters)
Table 80 Czech Republic flooring market revenue estimates and forecasts, by product, 2018 - 2030 (USD Million)
Table 81 Czech Republic flooring market volume estimates and forecasts, by application, 2018 - 2030 (Million Sq. Meters)
Table 82 Czech Republic flooring market revenue estimates and forecasts, by application, 2018 - 2030 (USD Million)
Table 83 Portugal flooring market estimates and forecasts, 2018 - 2030 (Million Sq. Meters) (USD Million)
Table 84 Portugal flooring market volume estimates and forecasts, by product, 2018 - 2030 (Million Sq. Meters)
Table 85 Portugal flooring market revenue estimates and forecasts, by product, 2018 - 2030 (USD Million)
Table 86 Portugal flooring market volume estimates and forecasts, by application, 2018 - 2030 (Million Sq. Meters)
Table 87 Portugal flooring market revenue estimates and forecasts, by application, 2018 - 2030 (USD Million)
Table 88 Ukraine flooring market estimates and forecasts, 2018 - 2030 (Million Sq. Meters) (USD Million)
Table 89 Ukraine flooring market volume estimates and forecasts, by product, 2018 - 2030 (Million Sq. Meters)
Table 90 Ukraine flooring market revenue estimates and forecasts, by product, 2018 - 2030 (USD Million)
Table 91 Ukraine flooring market volume estimates and forecasts, by application, 2018 - 2030 (Million Sq. Meters)
Table 92 Ukraine flooring market revenue estimates and forecasts, by application, 2018 - 2030 (USD Million)
Table 93 Slovakia flooring market estimates and forecasts, 2018 - 2030 (Million Sq. Meters) (USD Million)
Table 94 Slovakia flooring market volume estimates and forecasts, by product, 2018 - 2030 (Million Sq. Meters)
Table 95 Slovakia flooring market revenue estimates and forecasts, by product, 2018 - 2030 (USD Million)
Table 96 Slovakia flooring market volume estimates and forecasts, by application, 2018 - 2030 (Million Sq. Meters)
Table 97 Slovakia flooring market revenue estimates and forecasts, by application, 2018 - 2030 (USD Million)
Table 98 Hungary flooring market estimates and forecasts, 2018 - 2030 (Million Sq. Meters) (USD Million)
Table 99 Hungary flooring market volume estimates and forecasts, by product, 2018 - 2030 (Million Sq. Meters)
Table 100 Hungary flooring market revenue estimates and forecasts, by product, 2018 - 2030 (USD Million)
Table 101 Hungary flooring market volume estimates and forecasts, by application, 2018 - 2030 (Million Sq. Meters)
Table 102 Hungary flooring market revenue estimates and forecasts, by application, 2018 - 2030 (USD Million)
Table 103 Asia Pacific flooring market estimates and forecasts, 2018 - 2030 (Million Sq. Meters) (USD Million)
Table 104 Asia Pacific flooring market volume estimates and forecasts, by product, 2018 - 2030 (Million Sq. Meters)
Table 105 Asia Pacific flooring market revenue estimates and forecasts, by product, 2018 - 2030 (USD Million)
Table 106 Asia Pacific flooring market volume estimates and forecasts, by application, 2018 - 2030 (Million Sq. Meters)
Table 107 Asia Pacific flooring market revenue estimates and forecasts, by application, 2018 - 2030 (USD Million)
Table 108 China flooring market estimates and forecasts, 2018 - 2030 (Million Sq. Meters) (USD Million)
Table 109 China flooring market volume estimates and forecasts, by product, 2018 - 2030 (Million Sq. Meters)
Table 110 China flooring market revenue estimates and forecasts, by product, 2018 - 2030 (USD Million)
Table 111 China flooring market volume estimates and forecasts, by application, 2018 - 2030 (Million Sq. Meters)
Table 112 China flooring market revenue estimates and forecasts, by application, 2018 - 2030 (USD Million)
Table 113 Japan flooring market estimates and forecasts, 2018 - 2030 (Million Sq. Meters) (USD Million)
Table 114 Japan flooring market volume estimates and forecasts, by product, 2018 - 2030 (Million Sq. Meters)
Table 115 Japan flooring market revenue estimates and forecasts, by product, 2018 - 2030 (USD Million)
Table 116 Japan flooring market volume estimates and forecasts, by application, 2018 - 2030 (Million Sq. Meters)
Table 117 Japan flooring market revenue estimates and forecasts, by application, 2018 - 2030 (USD Million)
Table 118 India flooring market estimates and forecasts, 2018 - 2030 (Million Sq. Meters) (USD Million)
Table 119 India flooring market volume estimates and forecasts, by product, 2018 - 2030 (Million Sq. Meters)
Table 120 India flooring market revenue estimates and forecasts, by product, 2018 - 2030 (USD Million)
Table 121 India flooring market volume estimates and forecasts, by application, 2018 - 2030 (Million Sq. Meters)
Table 122 India flooring market revenue estimates and forecasts, by application, 2018 - 2030 (USD Million)
Table 123 South Korea flooring market estimates and forecasts, 2018 - 2030 (Million Sq. Meters) (USD Million)
Table 124 South Korea flooring market volume estimates and forecasts, by product, 2018 - 2030 (Million Sq. Meters)
Table 125 South Korea flooring market revenue estimates and forecasts, by product, 2018 - 2030 (USD Million)
Table 126 South Korea flooring market volume estimates and forecasts, by application, 2018 - 2030 (Million Sq. Meters)
Table 127 South Korea flooring market revenue estimates and forecasts, by application, 2018 - 2030 (USD Million)
Table 128 Australia flooring market estimates and forecasts, 2018 - 2030 (Million Sq. Meters) (USD Million)
Table 129 Australia flooring market volume estimates and forecasts, by product, 2018 - 2030 (Million Sq. Meters)
Table 130 Australia flooring market revenue estimates and forecasts, by product, 2018 - 2030 (USD Million)
Table 131 Australia flooring market volume estimates and forecasts, by application, 2018 - 2030 (Million Sq. Meters)
Table 132 Australia flooring market revenue estimates and forecasts, by application, 2018 - 2030 (USD Million)
Table 133 Indonesia flooring market estimates and forecasts, 2018 - 2030 (Million Sq. Meters) (USD Million)
Table 134 Indonesia flooring market volume estimates and forecasts, by product, 2018 - 2030 (Million Sq. Meters)
Table 135 Indonesia flooring market revenue estimates and forecasts, by product, 2018 - 2030 (USD Million)
Table 136 Indonesia flooring market volume estimates and forecasts, by application, 2018 - 2030 (Million Sq. Meters)
Table 137 Indonesia flooring market revenue estimates and forecasts, by application, 2018 - 2030 (USD Million)
Table 138 Philippines flooring market estimates and forecasts, 2018 - 2030 (Million Sq. Meters) (USD Million)
Table 139 Philippines flooring market volume estimates and forecasts, by product, 2018 - 2030 (Million Sq. Meters)
Table 140 Philippines flooring market revenue estimates and forecasts, by product, 2018 - 2030 (USD Million)
Table 141 Philippines flooring market volume estimates and forecasts, by application, 2018 - 2030 (Million Sq. Meters)
Table 142 Philippines flooring market revenue estimates and forecasts, by application, 2018 - 2030 (USD Million)
Table 143 Vietnam flooring market estimates and forecasts, 2018 - 2030 (Million Sq. Meters) (USD Million)
Table 144 Vietnam flooring market volume estimates and forecasts, by product, 2018 - 2030 (Million Sq. Meters)
Table 145 Vietnam flooring market revenue estimates and forecasts, by product, 2018 - 2030 (USD Million)
Table 146 Vietnam flooring market volume estimates and forecasts, by application, 2018 - 2030 (Million Sq. Meters)
Table 147 Vietnam flooring market revenue estimates and forecasts, by application, 2018 - 2030 (USD Million)
Table 148 Vietnam flooring market volume estimates and forecasts, by type, 2018 - 2030 (Million Sq. Meters)
Table 149 Vietnam flooring market revenue estimates and forecasts, by type, 2018 - 2030 (USD Million)
Table 150 Central & South America flooring market estimates and forecasts, 2018 - 2030 (Million Sq. Meters) (USD Million)
Table 151 Central & South America flooring market volume estimates and forecasts, by product, 2018 - 2030 (Million Sq. Meters)
Table 152 Central & South America flooring market revenue estimates and forecasts, by product, 2018 - 2030 (USD Million)
Table 153 Central & South America flooring market volume estimates and forecasts, by application, 2018 - 2030 (Million Sq. Meters)
Table 154 Central & South America flooring market revenue estimates and forecasts, by application, 2018 - 2030 (USD Million)
Table 155 Brazil flooring market estimates and forecasts, 2018 - 2030 (Million Sq. Meters) (USD Million)
Table 156 Brazil flooring market volume estimates and forecasts, by product, 2018 - 2030 (Million Sq. Meters)
Table 157 Brazil flooring market revenue estimates and forecasts, by product, 2018 - 2030 (USD Million)
Table 158 Brazil flooring market volume estimates and forecasts, by application, 2018 - 2030 (Million Sq. Meters)
Table 159 Brazil flooring market revenue estimates and forecasts, by application, 2018 - 2030 (USD Million)
Table 160 Argentina flooring market estimates and forecasts, 2018 - 2030 (Million Sq. Meters) (USD Million)
Table 161 Argentina flooring market volume estimates and forecasts, by product, 2018 - 2030 (Million Sq. Meters)
Table 162 Argentina flooring market revenue estimates and forecasts, by product, 2018 - 2030 (USD Million)
Table 163 Argentina flooring market volume estimates and forecasts, by application, 2018 - 2030 (Million Sq. Meters)
Table 164 Argentina flooring market revenue estimates and forecasts, by application, 2018 - 2030 (USD Million)
Table 165 Middle East & Africa flooring market estimates and forecasts, 2018 - 2030 (Million Sq. Meters) (USD Million)
Table 166 Middle East & Africa flooring market volume estimates and forecasts, by product, 2018 - 2030 (Million Sq. Meters)
Table 167 Middle East & Africa flooring market revenue estimates and forecasts, by product, 2018 - 2030 (USD Million)
Table 168 Middle East & Africa flooring market volume estimates and forecasts, by application, 2018 - 2030 (Million Sq. Meters)
Table 169 Middle East & Africa flooring market revenue estimates and forecasts, by application, 2018 - 2030 (USD Million)
Table 170 Saudi Arabia flooring market estimates and forecasts, 2018 - 2030 (Million Sq. Meters) (USD Million)
Table 171 Saudi Arabia flooring market volume estimates and forecasts, by product, 2018 - 2030 (Million Sq. Meters)
Table 172 Saudi Arabia flooring market revenue estimates and forecasts, by product, 2018 - 2030 (USD Million)
Table 173 Saudi Arabia flooring market volume estimates and forecasts, by application, 2018 - 2030 (Million Sq. Meters)
Table 174 Saudi Arabia flooring market revenue estimates and forecasts, by application, 2018 - 2030 (USD Million)
Table 175 UAE flooring market estimates and forecasts, 2018 - 2030 (Million Sq. Meters) (USD Million)
Table 176 UAE flooring market volume estimates and forecasts, by product, 2018 - 2030 (Million Sq. Meters)
Table 177 UAE flooring market revenue estimates and forecasts, by product, 2018 - 2030 (USD Million)
Table 178 UAE flooring market volume estimates and forecasts, by application, 2018 - 2030 (Million Sq. Meters)
Table 179 UAE flooring market revenue estimates and forecasts, by application, 2018 - 2030 (USD Million)
Table 180 Israel flooring market estimates and forecasts, 2018 - 2030 (Million Sq. Meters) (USD Million)
Table 181 Israel flooring market volume estimates and forecasts, by product, 2018 - 2030 (Million Sq. Meters)
Table 182 Israel flooring market revenue estimates and forecasts, by product, 2018 - 2030 (USD Million)
Table 183 Israel flooring market volume estimates and forecasts, by application, 2018 - 2030 (Million Sq. Meters)
Table 184 Israel flooring market revenue estimates and forecasts, by application, 2018 - 2030 (USD Million)
Table 185 Egypt flooring market estimates and forecasts, 2018 - 2030 (Million Sq. Meters) (USD Million)
Table 186 Egypt flooring market volume estimates and forecasts, by product, 2018 - 2030 (Million Sq. Meters)
Table 187 Egypt flooring market revenue estimates and forecasts, by product, 2018 - 2030 (USD Million)
Table 188 Egypt flooring market volume estimates and forecasts, by application, 2018 - 2030 (Million Sq. Meters)
Table 189 Egypt flooring market revenue estimates and forecasts, by application, 2018 - 2030 (USD Million)
Table 190 Qatar flooring market estimates and forecasts, 2018 - 2030 (Million Sq. Meters) (USD Million)
Table 191 Qatar flooring market volume estimates and forecasts, by product, 2018 - 2030 (Million Sq. Meters)
Table 192 Qatar flooring market revenue estimates and forecasts, by product, 2018 - 2030 (USD Million)
Table 193 Qatar flooring market volume estimates and forecasts, by application, 2018 - 2030 (Million Sq. Meters)
Table 194 Qatar flooring market revenue estimates and forecasts, by application, 2018 - 2030 (USD Million)
Table 195 South Africa flooring market estimates and forecasts, 2018 - 2030 (Million Sq. Meters) (USD Million)
Table 196 South Africa flooring market volume estimates and forecasts, by product, 2018 - 2030 (Million Sq. Meters)
Table 197 South Africa flooring market revenue estimates and forecasts, by product, 2018 - 2030 (USD Million)
Table 198 South Africa flooring market volume estimates and forecasts, by application, 2018 - 2030 (Million Sq. Meters)
Table 199 South Africa flooring market revenue estimates and forecasts, by application, 2018 - 2030 (USD Million)
Table 200 Morocco flooring market estimates and forecasts, 2018 - 2030 (Million Sq. Meters) (USD Million)
Table 201 Morocco flooring market volume estimates and forecasts, by product, 2018 - 2030 (Million Sq. Meters)
Table 202 Morocco flooring market revenue estimates and forecasts, by product, 2018 - 2030 (USD Million)
Table 203 Morocco flooring market volume estimates and forecasts, by application, 2018 - 2030 (Million Sq. Meters)
Table 204 Morocco flooring market revenue estimates and forecasts, by application, 2018 - 2030 (USD Million)
List of Figures
Fig. 1 Information Procurement
Fig. 2 Primary Research Pattern
Fig. 3 Primary Research Process
Fig. 4 Market Research Approaches - Bottom-Up Approach
Fig. 5 Market Research Approaches - Top-Down Approach
Fig. 6 Market Research Approaches - Combined Approach
Fig. 7 Penetration & growth prospect mapping
Fig. 8 Flooring market - Value chain analysis
Fig. 9 Flooring: Market dynamics
Fig. 10 Flooring market driver impact analysis
Fig. 11 Ceramic tiles flooring market volume estimates and forecasts, 2018 - 2030 (Million Sq. Meters) (USD Million)
Fig. 12 Vitrified (porcelain) tiles flooring market volume estimates and forecasts, 2018 - 2030 (Million Sq. Meters) (USD Million)
Fig. 13 Carpet flooring market volume estimates and forecasts, 2018 - 2030 (Million Sq. Meters) (USD Million)
Fig. 14 Vinyl flooring market volume estimates and forecasts, 2018 - 2030 (Million Sq. Meters) (USD Million)
Fig. 15 Luxury vinyl tiles flooring market volume estimates and forecasts, 2018 - 2030 (Million Sq. Meters) (USD Million)
Fig. 16 Linoleum & rubber flooring market volume estimates and forecasts, 2018 - 2030 (Million Sq. Meters) (USD Million)
Fig. 17 Wood & laminate flooring market volume estimates and forecasts, 2018 - 2030 (Million Sq. Meters) (USD Million)
Fig. 18 Others flooring market volume estimates and forecasts, 2018 - 2030 (Million Sq. Meters) (USD Million)
Fig. 19 Flooring market volume estimates and forecasts, by residential application, 2018 - 2030 (Million Sq. Meters) (USD Million)
Fig. 20 Flooring market volume estimates and forecasts, by commercial application, 2018 - 2030 (Million Sq. Meters) (USD Million)
Fig. 21 Flooring market volume estimates and forecasts, by industrial application, 2018 - 2030 (Million Sq. Meters) (USD Million)
Fig. 22 North America flooring market estimates and forecasts, 2018 - 2030 (Million Sq. Meters) (USD Million)
Fig. 23 U.S. flooring market estimates and forecasts, 2018 - 2030 (Million Sq. Meters) (USD Million)
Fig. 24 Canada flooring market estimates and forecasts, 2018 - 2030 (Million Sq. Meters) (USD Million)
Fig. 25 Mexico flooring market estimates and forecasts, 2018 - 2030 (Million Sq. Meters) (USD Million)
Fig. 26 Europe flooring market estimates and forecasts, 2018 - 2030 (Million Sq. Meters) (USD Million)
Fig. 27 Germany flooring market estimates and forecasts, 2018 - 2030 (Million Sq. Meters) (USD Million)
Fig. 28 UK flooring market estimates and forecasts, 2018 - 2030 (Million Sq. Meters) (USD Million)
Fig. 29 Spain flooring market estimates and forecasts, 2018 - 2030 (Million Sq. Meters) (USD Million)
Fig. 30 Italy flooring market estimates and forecasts, 2018 - 2030 (Million Sq. Meters) (USD Million)
Fig. 31 Russia flooring market estimates and forecasts, 2018 - 2030 (Million Sq. Meters) (USD Million)
Fig. 32 Romania flooring market estimates and forecasts, 2018 - 2030 (Million Sq. Meters) (USD Million)
Fig. 33 Romania flooring market revenue estimates and forecasts, by type, 2018 - 2030 (USD Million)
Fig. 34 Czech Republic flooring market estimates and forecasts, 2018 - 2030 (Million Sq. Meters) (USD Million)
Fig. 35 Portugal flooring market estimates and forecasts, 2018 - 2030 (Million Sq. Meters) (USD Million)
Fig. 36 Ukraine flooring market estimates and forecasts, 2018 - 2030 (Million Sq. Meters) (USD Million)
Fig. 37 Slovakia flooring market estimates and forecasts, 2018 - 2030 (Million Sq. Meters) (USD Million)
Fig. 38 Hungary flooring market estimates and forecasts, 2018 - 2030 (Million Sq. Meters) (USD Million)
Fig. 39 Asia Pacific flooring market estimates and forecasts, 2018 - 2030 (Million Sq. Meters) (USD Million)
Fig. 40 China flooring market estimates and forecasts, 2018 - 2030 (Million Sq. Meters) (USD Million)
Fig. 41 Japan flooring market estimates and forecasts, 2018 - 2030 (Million Sq. Meters) (USD Million)
Fig. 42 India flooring market estimates and forecasts, 2018 - 2030 (Million Sq. Meters) (USD Million)
Fig. 43 South Korea flooring market estimates and forecasts, 2018 - 2030 (Million Sq. Meters) (USD Million)
Fig. 44 Australia flooring market estimates and forecasts, 2018 - 2030 (Million Sq. Meters) (USD Million)
Fig. 45 Indonesia flooring market estimates and forecasts, 2018 - 2030 (Million Sq. Meters) (USD Million)
Fig. 46 Philippines flooring market estimates and forecasts, 2018 - 2030 (Million Sq. Meters) (USD Million)
Fig. 47 Vietnam flooring market estimates and forecasts, 2018 - 2030 (Million Sq. Meters) (USD Million)
Fig. 48 Central & South America flooring market estimates and forecasts, 2018 - 2030 (Million Sq. Meters) (USD Million)
Fig. 49 Brazil flooring market estimates and forecasts, 2018 - 2030 (Million Sq. Meters) (USD Million)
Fig. 50 Argentina flooring market estimates and forecasts, 2018 - 2030 (Million Sq. Meters) (USD Million)
Fig. 51 Middle East & Africa flooring market estimates and forecasts, 2018 - 2030 (Million Sq. Meters) (USD Million)
Fig. 52 Saudi Arabia flooring market estimates and forecasts, 2018 - 2030 (Million Sq. Meters) (USD Million)
Fig. 53 UAE flooring market estimates and forecasts, 2018 - 2030 (Million Sq. Meters) (USD Million)
Fig. 54 Israel flooring market estimates and forecasts, 2018 - 2030 (Million Sq. Meters) (USD Million)
Fig. 55 Israel flooring market revenue estimates and forecasts, by type, 2018 - 2030 (USD Million)
Fig. 56 Egypt flooring market estimates and forecasts, 2018 - 2030 (Million Sq. Meters) (USD Million)
Fig. 57 Egypt flooring market revenue estimates and forecasts, by type, 2018 - 2030 (USD Million)
Fig. 58 Qatar flooring market estimates and forecasts, 2018 - 2030 (Million Sq. Meters) (USD Million)
Fig. 59 South Africa flooring market estimates and forecasts, 2018 - 2030 (Million Sq. Meters) (USD Million)
Fig. 60 Morocco flooring market estimates and forecasts, 2018 - 2030 (Million Sq. Meters) (USD Million)
Market Segmentation
Report content
Qualitative Analysis
Quantitative Analysis
A three-pronged approach was followed for deducing the flooring market estimates and forecasts. The process has three steps: information procurement, analysis, and validation. The whole process is cyclical, and steps repeat until the estimates are validated. The three steps are explained in detail below:
Information procurement: Information procurement is one of the most extensive and important stages in our research process, and quality data is critical for accurate analysis. We followed a multi-channel data collection process for flooring market to gather the most reliable and current information possible.
Analysis: We mine the data collected to establish baselines for forecasting, identify trends and opportunities, gain insight into consumer demographics and drivers, and so much more. We utilized different methods of flooring market market data depending on the type of information we’re trying to uncover in our research.
Market formulation and validation: We mine the data collected to establish baselines for forecasting, identify trends and opportunities, gain insight into consumer demographics and drivers, and so much more. We utilize different methods of data analysis depending on the type of information we’re trying to uncover in our research.
The flooring market was categorized into three segments, namely By Product (Ceramic Tiles, Porcelain Tiles, Carpet, Vinyl, Wood & Laminate), By Application (Residential, Industrial), By Region (North America; Europe; Asia Pacific; Central & South America; Middle East & Africa).
The flooring market was segmented into product, application, and regions. The demand at a segment level was deduced using a funnel method. Concepts like the TAM, SAM, SOM, etc. were put into practice to understand the demand. We at GVR deploy three methods to deduce market estimates and determine forecasts. These methods are explained below:
The flooring market was analyzed at a regional level. The globe was divided into North America, Europe, Asia Pacific, Central & South America, and Middle East & Africa, keeping in focus variables like consumption patterns, export-import regulations, consumer expectations, etc. These regions were further divided into thirty-four countries, namely, the U.S.; Canada; Mexico; Germany; UK; France; Italy; Spain; Russia; Romania; Czech Republic; Portugal; Ukraine; Slovakia; Hungary; China; India; Japan; Indonesia; South Korea; Australia; Philippines; Vietnam; Saudi Arabia; UAE; Israel; Qatar; South Africa; Morocco; Brazil; Argentina; Peru; Colombia; Chile.
All three above-mentioned market research methodologies were applied to arrive at regional-level conclusions. The regions were then summed up to form the global market.
The flooring market was analyzed via companies operating in the sector. Key market players analyzed include Mohawk Industries, Inc.; Tarkett, S.A.; AFI Licensing; Burke Flooring Products, Inc.; Firbo Flooring; Shaw Industries, Inc.; Interface, Inc.; Gerflor; Mannington Mills, Inc.; Polyflor; RAK Ceramics; Crossville Inc.; Atlas Concorde S.P.A.; Porcelanosa Group; Kajaria Ceramics Limited.
Analyzing these companies and cross-referencing them to the demand equation helped us validate our assumptions and conclusions.
Supply Side Estimates
Demand side estimates
GVR strives to procure the latest and unique information for reports directly from industry experts, which gives it a competitive edge. Quality is of utmost importance to us, therefore every year we focus on increasing our experts’ panel. Primary interviews are one of the critical steps in identifying recent market trends and scenarios. This process enables us to justify and validate our market estimates and forecasts to our clients. With more than 8,000 reports in our database, we have connected with some key opinion leaders across various domains, including healthcare, technology, consumer goods, and the chemical sector. Our process starts with identifying the right platform for a particular type of report, i.e., emails, LinkedIn, seminars, or telephonic conversation, as every report is unique and requires a differentiated approach.
We send out questionnaires to different experts from various regions/ countries, which is dependent on the following factors:
The time to start receiving responses from industry experts varies based on how niche or well-penetrated the market is. Our reports include a detailed chapter on the KoL opinion section, which helps our clients understand the perspective of experts already in the market space.
"The quality of research they have done for us has been excellent."