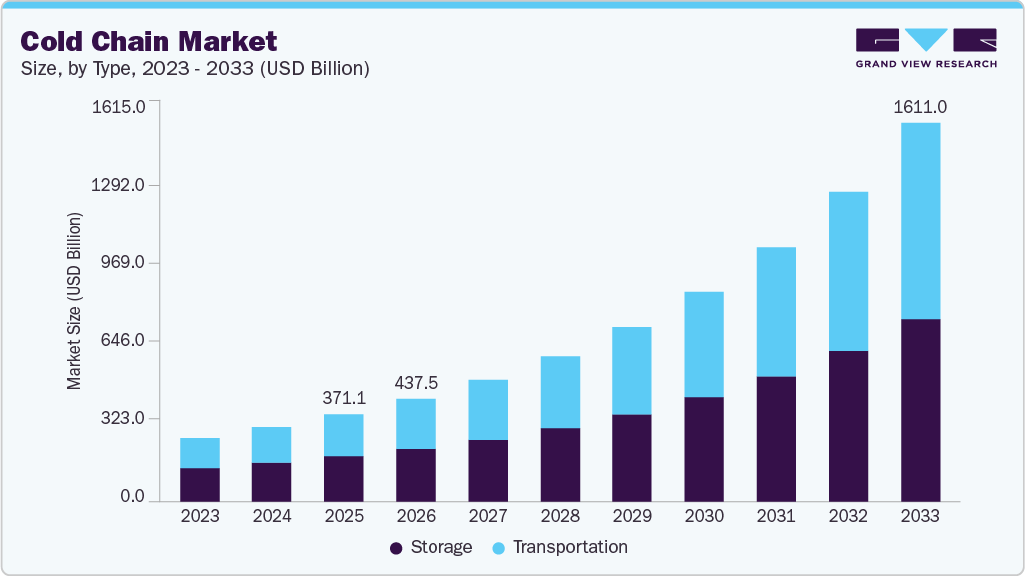
The global cold chain market size was valued at USD 270.98 billion in 2023 and is expected to grow at a compound annual growth rate (CAGR) of 18.9% from 2024 to 2030. Changes in consumer preferences and growing e-commerce sales are expected to drive the growth of the market. An increasing number of organized retail stores in developing economies are leading to the growing demand for cold chain solutions. Rising investment in cold chains and government initiatives to minimize food waste are expected to boost market growth. The growing adoption of technologies such as RFID and automation in cold chain applications provides significant growth opportunities for the market.
The World Trade Organization (WTO) and bilateral free trade agreements, such as the European Union Free Trade Agreement (FTA) and the North America Free Trade Agreement (NAFTA), have created opportunities for exporters in the U.S. and Europe to increase trade for perishable foods in a duty-free manner.
The refrigerated storage market in developing economies is driven by a shift from carbohydrate-rich diets to protein-rich foods, owing to rising consumer awareness. Countries such as China are expected to portray a significant growth rate over the coming years due to a consumer-led economic transition. With growing technological advancements in warehouse management and refrigerated transportation, the market will likely expand in developing economies.
Increasing IT spending in cold storage logistics drives the growth of the cold chain market by facilitating better inventory management and improving the overall efficiency of cold chain supply systems. By investing in advanced technologies such as cloud computing, IoT, and RFID, cold storage operators can track and monitor their inventory in real-time, reducing the risk of food waste, spoilage, and product recalls. The rising demand for temperature-sensitive products has emphasized the need for real-time cold chain monitoring.
Furthermore, several countries have strict regulations governing the transportation and storage of perishable food products to ensure food safety and quality. Compliance with these regulations often requires a robust cold chain system, which can be achieved with the help of IT systems. IT systems are critical in complying with these regulations as they provide real-time monitoring of temperature and humidity levels, location tracking, and data analytics.
The cold chain market growth stage is medium. The cold chain industry has witnessed a moderate degree of innovation. Technological advancements in temperature monitoring, tracking, and data analytics have been implemented to enhance the efficiency and reliability of cold chain logistics. However, compared to some other industries, the pace of innovation may be considered moderate.
The cold chain market has experienced a moderate level of mergers and acquisitions. Companies often engage in strategic partnerships, acquisitions, and collaborations to strengthen their presence, expand their service offerings, or improve their capabilities in specific regions. These activities contribute to market consolidation and operational synergies.
Regulations play a critical role in the cold chain market due to the sensitivity of the products being transported, such as pharmaceuticals, perishable foods, and vaccines. Compliance with regulations related to temperature control, storage, and transportation is paramount. The high impact of regulations necessitates investments in technology and infrastructure to ensure adherence to quality and safety standards.
The nature of the cold chain market, which involves the transportation and storage of temperature-sensitive goods, results in limited substitutes for the specialized services it provides. While alternative methods may exist for some products, the stringent requirements for maintaining specific temperature conditions make cold chain services irreplaceable in many scenarios.
End-user concentration in the cold chain market is often high, especially in sectors like pharmaceuticals and food. A small number of major clients or industries heavily rely on cold chain logistics to maintain the integrity of their products. The dependency of these sectors on the cold chain services results in a high level of end-user concentration.
Based on type, the market is segmented into storage, transportation, packaging, and monitoring components. The storage segment dominated the overall cold chain industry, gaining a market share of more than 50.0% in 2023. It is expected to grow at a CAGR of 17.8% throughout the forecast period. The growth can be attributed to an increasing preference for packaged foods across the globe. The changing dietary patterns and lifestyles of consumers are driving the demand for frozen foods. This is expected to boost the demand for storage solutions. Moreover, market players are expanding their storage capacities to meet cold storage needs.
Cold chain systems are crucial for supplying healthcare and food & beverage products. Demand for cold chain transportation solutions such as refrigerated containers and vehicles to safely transport temperature-sensitive goods is expected to drive the transportation segment’s growth over the forecast period.
Packaging products include crates, ice packs, insulated containers & boxes, cold chain bags/vaccine bags, and others. Some factors considered while choosing a packaging product include cost-efficiency and the material of the packaging product. Companies are introducing sustainable shipping products to address growing environmental concerns. For instance, in January 2022, U.S.-based PTG announced the launch of a new recyclable thermal shipper under its TRUEtemp NATURALS line. It maintains a temperature range between 2°C and 8°C for 72 hours.
The monitoring components segment is anticipated to grow at the fastest CAGR of 22.7% throughout the forecast period. This growth can be attributed to technological advancements and the growing need to ensure shipment integrity, efficiency, and safety. Advances are equally noticeable in backend IT infrastructure and frontend devices deployed for collecting and reporting real-time shipment information.
Efficient cold storage management largely depends on software and hardware components used for monitoring purposes. Hardware components include data loggers, remote temperature sensors, RFID devices, networking devices, and telematics devices. The stringent regulatory environment in the pharmaceutical industry surrounding the maintenance of product quality has positively influenced the adoption of cold chain temperature monitoring solutions.
Based on temperature range, the market is segmented into chilled (0°C to 15°C), frozen (-18°C to -25°C), and deep-frozen (below -25°C). The frozen (-18°C to -25°C) segment dominated the overall market, gaining a revenue share of more than 61.0% in 2023. It is expected to grow at the fastest CAGR of 20.0% throughout the forecast period. Poultry, cakes & bread, and meat need freezing temperatures to remain fresh. This is driving the need for frozen cold chain solutions to preserve the quality of perishable food & beverage and pharmaceutical products. Moreover, the widespread availability of cold chain storage and transportation solutions for frozen temperature ranges drives the segment’s growth.
The chilled (0°C to 15°C) segment is expected to grow at a considerable CAGR of 16.9% over the forecast period. To remain fresh, many vegetables, fruits, and meat require chilled temperature ranges, usually between 2°C to 4°C, during transportation. Chilled temperature storage of perishable products such as dairy products prevents deterioration, increasing shelf life. Maintaining the quality of perishable goods and minimizing wastage is driving the segment's growth.
Based on application, the market is segmented into pharmaceuticals, food & beverages, and others. The food & beverages segment dominated the overall cold chain industry, gaining a market share of more than 77.0% in 2023. It is expected to grow at a CAGR of 18.7% throughout the forecast period. Technological developments in the storage, packaging, and processing of seafood are anticipated to boost the growth of this segment. However, processed food is projected to grow significantly over the forecast years owing to continued innovations in packaging materials. Advancements in packaging materials increase the shelf life of foods. This has increased the sales of processed foods over the past few years.
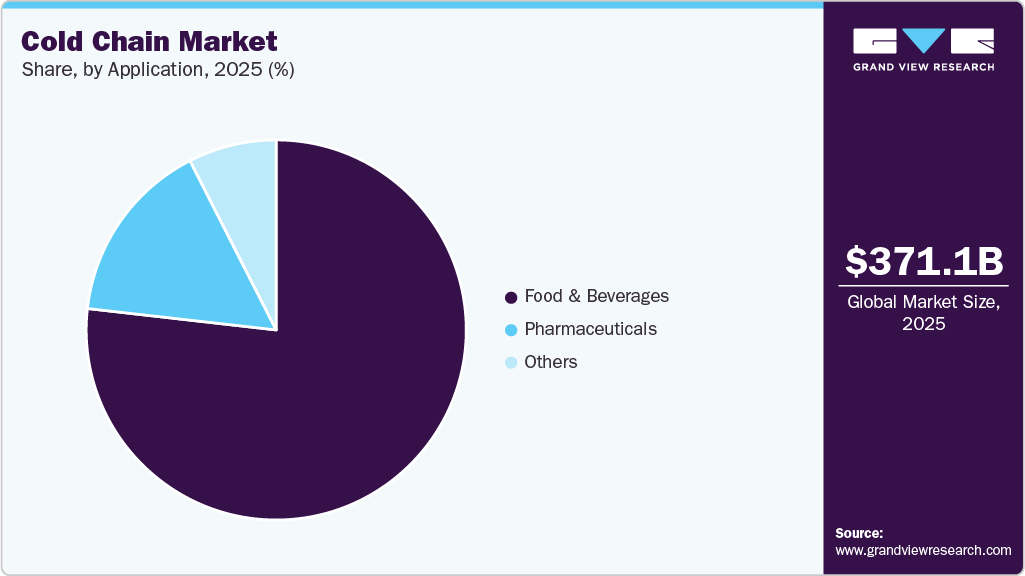
The pharmaceuticals segment is expected to grow at a considerable CAGR of 20.8% over the forecast period. High product demand in the pharmaceuticals segment can be attributed to its importance in maintaining the efficacy and safety of pharmaceuticals. The cold chain in the pharmaceutical industry is driven by stringent regulatory norms, such as Goods Distribution Practices (GDP) in the European Union (EU). These regulations are a shift witnessed in governments across the world toward standardizing regulations globally for better transportation systems for healthcare-related products.
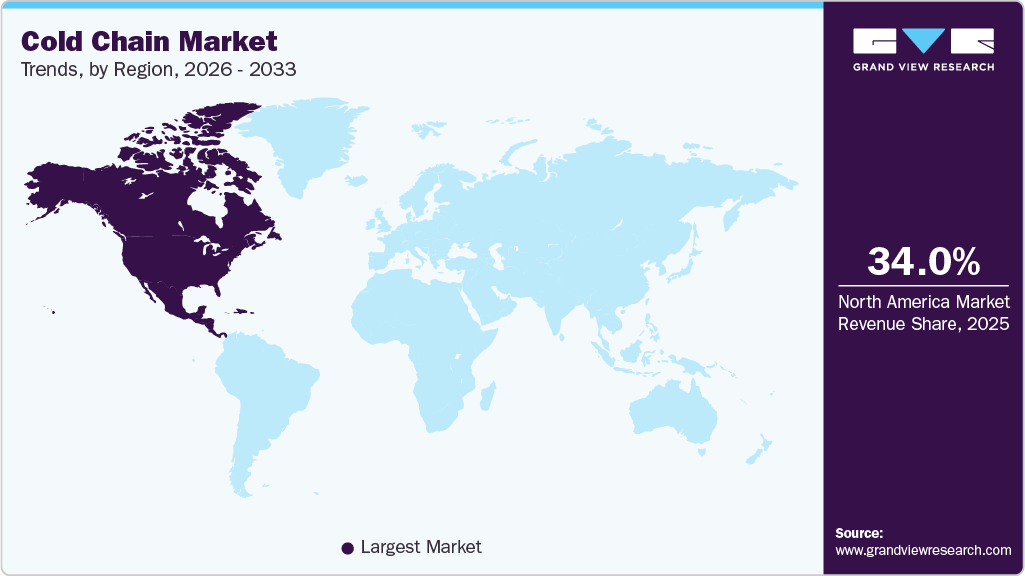
North America held the largest revenue share of more than 34% in 2023. It will retain the dominant position throughout the forecast period as the region has significant growth opportunities for companies planning to make long-term investments. Increasing penetration of connected devices and a large consumer base are also expected to fuel market growth over the forecast period. However, Asia Pacific is anticipated to be the fastest-growing regional market over the projected period with a CAGR of 21.1% owing to increasing government investments in logistics infrastructure development and penetration of Warehouse Management Systems (WMS).
China is a major contributor to the Asia Pacific regional market. The market growth in China is attributed to factors such as technological advancements in the packaging, processing, and storage of seafood products. Rising demand and growing cold chain infrastructure development have made China a top market for cold chains. China is undergoing a rapid transition from a construction- & manufacturing-led economy to a consumer-led economy. Rising innovations in the pharmaceutical sector in China are also expected to boost the demand for cold chain solutions. Another major factor driving the market includes the rapid expansion of biopharma in the region.
The cold chain market in U.S. is projected to grow at a CAGR of 17.1% from 2024 to 2030. The demand for cold storage facilities has been on the rise due to various factors, including the expansion of e-commerce and the increasing need for temperature-controlled storage in the pharmaceutical and food industries. The adoption of advanced technologies, such as IoT (Internet of Things) sensors and blockchain, has been enhancing visibility and traceability in the cold chain. These technologies help monitor and manage temperature-sensitive products more effectively.
UK has experienced a surge in online grocery shopping and e-commerce, driving the demand for cold storage and transportation solutions to maintain the quality of perishable goods during the supply chain. The pharmaceutical sector in the UK has been a key driver for the cold chain industry. The need for temperature-controlled storage and transportation for vaccines, biologics, and other medical products has been on the rise.
Germany has witnessed an increasing demand for cold storage facilities, driven by the growth in e-commerce, online grocery shopping, and the need for temperature-controlled storage in various industries, including pharmaceuticals and food. The integration of technology, such as IoT (Internet of Things) devices and sensors, has been a notable trend in Germany's cold chain industry. These technologies enhance monitoring, tracking, and management of temperature-sensitive products throughout the supply chain.
India has been focusing on the development of cold chains for agricultural produce to reduce post-harvest losses. The government initiatives and private investments aim to improve infrastructure for storing and transporting perishable goods from farms to markets. The Indian government has been introducing initiatives to improve the cold chain infrastructure, especially in rural areas. Additionally, regulations governing the storage and transportation of temperature-sensitive products are being strengthened to ensure product safety and quality.
The demand for cold storage and logistics services in Saudi Arabia has been increasing, driven by factors such as population growth, urbanization, and a rising awareness of the importance of maintaining the quality and safety of perishable goods. The Saudi Arabian government has been actively investing in cold chain infrastructure as part of its initiatives to diversify the economy. These investments aim to strengthen the overall logistics and supply chain capabilities, including those for perishable goods.
Some of the key players operating in the market include e LINEAGE LOGISTICS HOLDING, LLC; Americold Logistics, Inc.; among others.
LINEAGE LOGISTICS HOLDING, LLC is a U.S.-based firm that provides warehousing and logistics solutions to users operating in various industries. The company’s solutions consist of temperature-controlled public warehousing facilities for storing various types of food, including pork, beef, poultry, bakery products, fruits & vegetables, seafood, ice creams, and vegetables. The company also provides port-centric cold chain facilities on the East and West Coasts of the country to serve containerized markets and break bulk for its customers. The third-party facility management services comprise customized operating solutions for Fortune 500 companies in various consumer and food segments.
In April 2023, LINEAGE LOGISTICS HOLDING, LLC announced the opening of a new facility in Port Wentworth, Georgia. The facility is 220,000 square feet in size and offers cross-docking services. With this expansion, the company aimed to meet the needs of port-centric warehousing.
Americold Logistics, Inc., based in the U.S., provides temperature-controlled warehousing and transportation for the food industry. The services provided under producer solution include dedicated facilities, public refrigerated warehouses, port facilities, automation, and integrated consolidation programs. The services provided under the retailer solutions include integrated consolidation programs, i-3PL supply chain, system integration, port facilities, automation, and network optimization study. It has marked its presence across regions such as Asia Pacific and the Americas.
In June 2023, Canadian Pacific Kansas City (CPKC) and Americold announced a strategic partnership for the co-location of Americold’s warehouse facilities on the CPKC network. The main objective of the partnership is the optimization of temperature-controlled logistics across North America by building a facility in Kansas City, Missouri, bringing together cold storage and value-added-services and connecting major markets in the U.S. Midwest and Mexico.
Burris Logistics and Tippmann Group are some of the emerging companies in the global cold storage market
Burris Logistics is a logistics and supply chain management service company. The company provides temperature-controlled warehousing and transportation services. The company’s solution offerings include custom retail distribution, refrigerated warehousing, freight management, and redistribution of food service. Additionally, the company offers information technology services for custom applications and system integration. The company offers solutions for poultry, meat, frozen food, and dairy products. In June 2023, Honor Foods, a Burris Logistics subsidiary, announced the acquisition of Sunny Morning, a U.S.-based food service redistributor. With this acquisition, the company aimed to strengthen its position as a food service redistributor.
Tippmann Group is a cold storage construction and warehousing solution provider for the food industry. According to the Global Cold Chain Alliance (GCCA), Interstate Warehousing, a business of Tippmann Group, ranked fourth in terms of temperature-controlled space operated in North America in May 2023. It has a presence across various U.S. states, including Illinois, Colorado, Arizona, and Virginia. In June 2021, Tippmann Group introduced the Pallet Fit door, an addition to its blast-freezing solution QFR Zone. The Pallet Fit door provides more flexibility for freezing palletized products quickly. With this upgrade, the company aimed to make the blast-freezing solution more efficient.
The following are the leading companies in the cold chain market. These companies collectively hold the largest market share and dictate industry trends. Financials, strategy maps & products of these cold chain companies are analyzed to map the supply network.
In June 2023, Intelsius announced the addition of the ORCA Pallet to its ORCA temperature-controlled packaging range. It has been described as a multi-use and high-performance temperature-controlled pallet shipper designed for large-volume pharmaceutical payloads in the cold chain. It comes in 3 sizes and 3 temperature ranges and has a collapsible design to combat budget and storage constraints.
In June 2023, Canadian Pacific Kansas City (CPKC) and Americold announced a strategic partnership for the co-location of Americold’s warehouse facilities on the CPKC network. The main objective of the partnership is the optimization of temperature-controlled logistics across North America by building a facility in Kansas City, Missouri, bringing together cold storage and value-added-services and connecting major markets in the U.S. Midwest and Mexico.
In May 2023, Sonoco ThermoSafe announced a global partnership lease agreement with Cargolux, a Luxembourg-based cargo-only global airline. As per the agreement, Sonoco ThermoSafe will provide its Pegasus ULD passive temperature-controlled air freight shipping container via Cargolux’s selection of air freight pharma shipping services and solutions. The Pegasus is globally the first such container that is FAA and EASA-approved for pharmaceutical use.
In March 2023, Americold inaugurated its facility expansion in Santa Perpetua Barcelona, Spain. It involves the addition of 11 loading bays and 12,000 pallet positions, thus offering a much higher capacity in temperature-controlled products and services to regional customers. The expansion means that the facility now has more than 20,000 pallet positions providing storage for chilled, frozen, and ambient produce.
In March 2023, Lineage Logistics announced the official opening of its expanded cold storage facility at Port of Aarhus, Denmark, with the expansion adding 18,000 pallet spaces at the site for overall 27,500 pallet spaces. The increased capacity is expected to offer streamlined storage options for shellfish and fish producers, among other customers, which will play a major role in driving trade activities between Greenland, Denmark, and the global market.
In January 2023, Cold Chain Technologies introduced the ‘CCT TheraShield’ portfolio of customized services and products to cater to the gene and cell therapy industry. It has been made available in different sizes and temperature profiles and is linked directly to the ‘CCT Smart Solutions’ portal, which helps customers in planning, creating, tracking, and optimizing their shipments In January 2023, Lineage Logistics announced a partnership with the supply chain insurer Parsyl for offering highly competitive cargo insurance solutions to customers of Lineage in the food and beverage sector. Parsyl leverages data from various sources to develop a tailored coverage on the basis of risk profile of individual customers, thus enabling better coverage, more competitive pricing, and more efficient claims service.
In September 2022, Cold Chain Technologies announced the expansion of its ‘TRUEtemp Naturals’ portfolio by launching seasonal solutions. The portfolio makes use of proprietary design & manufacturing technologies for providing pharmaceutical-grade, time-temperature performance in an eco-friendly, recyclable, and repulpable solution. The environment-friendly designs are expected to aid CCT in increasing their commitment of avoiding 50 million pounds of landfill waste by 2025 to 60 million pounds.
Report Attribute |
Details |
Market size value in 2023 |
USD 270.98 billion |
Revenue forecast in 2030 |
USD 892.27 billion |
Growth rate |
CAGR of 18.9% from 2024 to 2030 |
Actual Data |
2017 - 2023 |
Forecast period |
2024 - 2030 |
Quantitative units |
Revenue in USD Billion and CAGR from 2024 to 2030 |
Report coverage |
Revenue forecast, company ranking, competitive landscape, growth factors, and trends |
Segments covered |
Type, Temperature Range, Application, Region |
Regional scope |
North America, Europe, Asia Pacific, Latin America, Middle East & Africa |
Country scope |
U.S.; Canada; Germany; UK; France; Spain; Italy; Norway; Netherlands; Switzerland; Russia; China; Japan; India; Singapore; South Korea; Australia; Brazil; Mexico; Kingdom of Saudi Arabia (KSA); UAE; South Africa |
Key companies profiled |
Americold Logistics, Inc.; LINEAGE LOGISTICS HOLDING, LLC; United States Cold Storage; Burris Logistics; Wabash National Corporation; NewCold; Sonoco ThermoSafe (Sonoco Products Company); United Parcel Service of America, Inc.; A.P. Moller - Maersk; NICHIREI CORPORATION; Tippmann Group |
Customization scope |
Free report customization (equivalent up to 8 analysts working days) with purchase. Addition or alteration to country, regional & segment scope. |
Pricing and purchase options |
Avail customized purchase options to meet your exact research needs. Explore purchase options |
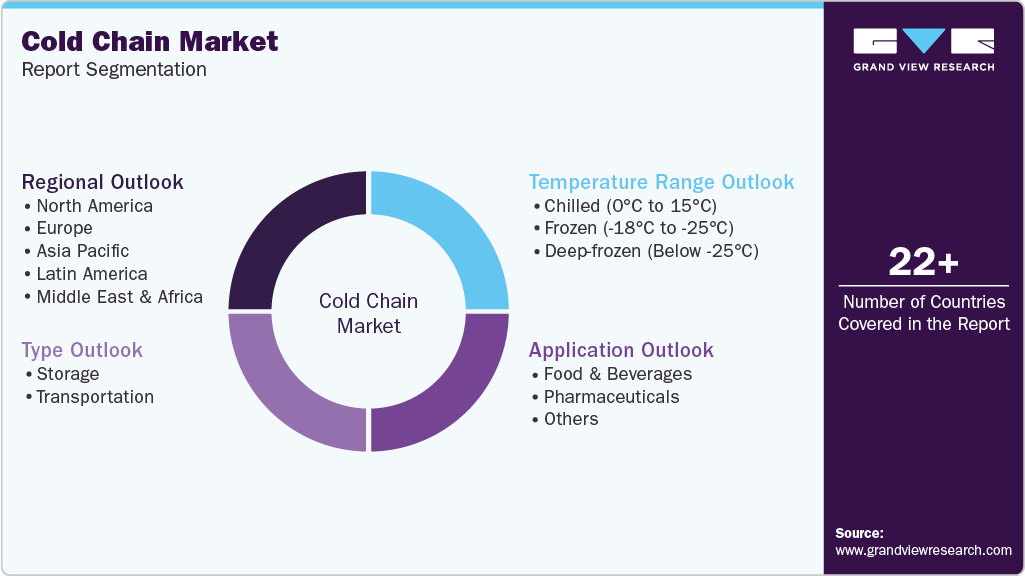
This report forecasts revenue growths at global, regional, and country levels and provides an analysis of the industry trends in each of the sub-segments from 2017 to 2030. For the purpose of this study, Grand View Research has segmented the global cold chain market based on type, temperature range, application, and region:
Type Outlook (Revenue, USD Billion; 2017 - 2030)
Storage
Facilities/Services
Refrigerated Warehouse
Private & Semi-Private
Public
Cold Room
Equipment
Blast freezer
Walk-in Cooler and Freezer
Deep Freezer
Others
Transportation
By Mode
Road
Sea
Rail
Air
By Offering
Refrigerated vehicles
Refrigerated containers
Packaging
Crates
Insulated Containers & Boxes
Large (32 to 66 liters)
Medium (21 to 29 liters)
Small (10 to 17 liters)
X-small (3 to 8 liters)
Petite (0.9 to 2.7 liters)
Cold chain bags/Vaccine bags
Ice packs
Others
Monitoring Components
Hardware
Sensors
RFID Devices
Telematics
Networking Devices
Others
Software
On-premise
Cloud-based
Temperature Range Outlook (Revenue, USD Billion; 2017 - 2030)
Chilled (0°C to 15°C)
Frozen (-18°C to -25°C)
Deep-frozen (Below -25°C)
Application Outlook (Revenue, USD Billion; 2017 - 2030)
Food & Beverages
Fruits & Vegetables
Fruit Pulp & Concentrates
Dairy Products
Milk
Butter
Cheese
Ice cream
Others
Fish, Meat, and Seafood
Processed Food
Bakery & Confectionary
Others
Pharmaceuticals
Vaccines
Blood Banking
Others
Others
Regional Outlook (Revenue, USD Billion; 2017 - 2030)
North America
U.S.
Canada
Europe
Germany
U.K.
France
Spain
Italy
Norway
Netherlands
Switzerland
Russia
Asia Pacific
China
Japan
India
Singapore
South Korea
Australia
Latin America
Brazil
Mexico
Middle East & Africa
Kingdom of Saudi Arabia (KSA)
UAE
South Africa
b. The global cold chain market was estimated at USD 233.2 billion in 2022 and is expected to reach USD 271.0 billion in 2023.
b. The global cold chain market is expected to progress at a compound annual growth rate of 18.6% from 2023 to 2030 to reach USD 892.3 billion in 2030.
b. The storage segment accounted for the largest revenue share of more than 51.4% in 2022 in the cold chain market and will maintain its dominance over the forecast period owing to an increasing preference for packaged foods globally.
b. The insulated containers and boxes segment held the largest revenue share of over 52.7% in 2022 in the cold chain market. The other products includes a detailed analysis of crates, ice packs, labels, and others.
b. North America held the largest revenue share of more than 34% in 2022. It will retain the dominant position throughout the forecast period as the region has significant growth opportunities for the companies planning to invest for the long haul. Increasing penetration of connected devices and a large consumer base are also expected to fuel market growth over the forecast period
Table of Contents
Chapter 1. Methodology and Scope
1.1. Market Segmentation and Scope
1.2. Market Definitions
1.3. Research Methodology
1.3.1. Information Procurement
1.3.2. Information or Data Analysis
1.3.3. Market Formulation & Data Visualization
1.3.4. Data Validation & Publishing
1.4. Research Scope and Assumptions
1.4.1. List of Data Sources
Chapter 2. Executive Summary
2.1. Market Outlook
2.2. Segment Outlook
2.3. Competitive Insights
Chapter 3. Cold Chain Market Variables, Trends, & Scope
3.1. Market Introduction/Lineage Outlook
3.2. Industry Value Chain Analysis
3.3. Market Dynamics
3.3.1. Market Drivers Analysis
3.3.1.1. Increasing Automation in Warehouses
3.3.1.2. Growing Popularity of E-Commerce as a Channel for Purchasing Fresh Food
3.3.1.3. Increasing Demand for Quality Foods
3.3.1.4. Increasing IT Spending in Cold Storage Logistics
3.3.1.5. RFID Technology for Cold Chain Applications
3.3.1.6. Growing Organized Retail Demand
3.3.2. Market Restraints Analysis
3.3.2.1. High Initial Investments
3.3.3. Industry Opportunities
3.3.3.1. Growing Application of Telematics in Logistics and transportation
3.3.3.2. Low-Carbon Design, Environmental Auditing, and Crafty Consutruction of Cold Storage Warehouses
3.3.4. Industry Challenges
3.4. Cold Chain Market Analysis Tools
3.4.1. Porter’s Analysis
3.4.1.1. Bargaining power of the suppliers
3.4.1.2. Bargaining power of the buyers
3.4.1.3. Threats of substitution
3.4.1.4. Threats from new entrants
3.4.1.5. Competitive rivalry
3.4.2. PESTEL Analysis
3.4.2.1. Political landscape
3.4.2.2. Economic and Social landscape
3.4.2.3. Technological landscape
3.4.2.4. Environmental landscape
3.4.2.5. Legal landscape
3.5. Use Case Analysis
3.5.1. Emerson's Cold Chain Solutions Revolutionizing Vaccine Transportation
3.5.2. Cold Chain Technologies Inc: International Pharmaceutical Firm Achieves a 20% Reduction in Shipping Expenses
3.6. Temperature Control Systems
3.6.1. Conventional Refrigeration
3.6.2. Protocols Related to Refrigerants
3.7. State-wise Economic Outlook (Top 10 States, Based on Refrigerated Warehouse Capacity)
3.8. Regulatory Framework for Chilled and Frozen Food in the U.S.
3.9. List of Cold Storage Facility with their Capacity in the U.S., 2023
Chapter 4. Cold Chain Market: Type Estimates & Trend Analysis
4.1. Segment Dashboard
4.2. Cold Chain Market: Type Movement Analysis, USD Billion, 2023 & 2030
4.3. Storage
4.3.1. Storage Market Revenue Estimates and Forecasts, 2017 - 2030 (USD Billion)
4.3.2. Facilities/Services
4.3.2.1. Facilities/Services Market Revenue Estimates and Forecasts, 2017 - 2030 (USD Billion)
4.3.2.2. Refrigerated Warehouse
4.3.2.2.1. Refrigerated Warehouse Market Revenue Estimates and Forecasts, 2017 - 2030 (USD Billion)
4.3.2.2.2. Private & Semi-Private
4.3.2.2.2.1. Private & Semi-Private Market Revenue Estimates and Forecasts, 2017 - 2030 (USD Billion)
4.3.2.2.3. Public
4.3.2.2.3.1. Private & Semi-Private Market Revenue Estimates and Forecasts, 2017 - 2030 (USD Billion)
4.3.2.3. Cold Room
4.3.2.3.1. Cold Room Market Revenue Estimates and Forecasts, 2017 - 2030 (USD Billion)
4.3.3. Equipment
4.3.3.1. Equipment Market Revenue Estimates and Forecasts, 2017 - 2030 (USD Billion)
4.3.3.2. Blast Freezer
4.3.3.2.1. Blast Freezer Market Revenue Estimates and Forecasts, 2017 - 2030 (USD Billion)
4.3.3.3. Walk-in Cooler and Freezer
4.3.3.3.1. Walk-in Cooler and Freezer Market Revenue Estimates and Forecasts, 2017 - 2030 (USD Billion)
4.3.3.4. Deep Freezer
4.3.3.4.1. Deep Freezer Market Revenue Estimates and Forecasts, 2017 - 2030 (USD Billion)
4.3.3.5. Others
4.3.3.5.1. Others Market Revenue Estimates and Forecasts, 2017 - 2030 (USD Billion)
4.4. Transportation
4.4.1. Transportation Market Revenue Estimates and Forecasts, 2017 - 2030 (USD Billion)
4.4.2. Mode
4.4.2.1. Road
4.4.2.1.1. Road Market Revenue Estimates and Forecasts, 2017 - 2030 (USD Billion)
4.4.2.2. Sea
4.4.2.2.1. Sea Market Revenue Estimates and Forecasts, 2017 - 2030 (USD Billion)
4.4.2.3. Rail
4.4.2.3.1. Rail Market Revenue Estimates and Forecasts, 2017 - 2030 (USD Billion)
4.4.2.4. Air
4.4.2.4.1. Air Market Revenue Estimates and Forecasts, 2017 - 2030 (USD Billion)
4.4.3. Offering
4.4.3.1. Refrigerated Vehicles
4.4.3.1.1. Refrigerated vehicles Market Revenue Estimates and Forecasts, 2017 - 2030 (USD Billion)
4.4.3.2. Refrigerated Containers
4.4.3.2.1. Refrigerated containers Market Revenue Estimates and Forecasts, 2017 - 2030 (USD Billion)
4.5. Packaging
4.5.1. Packaging Market Revenue Estimates and Forecasts, 2017 - 2030 (USD Billion)
4.5.2. Crates
4.5.2.1. Crates Market Revenue Estimates and Forecasts, 2017 - 2030 (USD Billion)
4.5.3. Insulated Containers & Boxes
4.5.3.1. Insulated Containers & Boxes Market Revenue Estimates and Forecasts, 2017 - 2030 (USD Billion)
4.5.3.2. Large (32 to 66 liters)
4.5.3.2.1. Large (32 to 66 liters) Market Revenue Estimates and Forecasts, 2017 - 2030 (USD Billion)
4.5.3.3. Medium (21 to 29 liters)
4.5.3.3.1. Medium (21 to 29 liters) Market Revenue Estimates and Forecasts, 2017 - 2030 (USD Billion)
4.5.3.4. Small (10 to 17 liters)
4.5.3.4.1. Small (10 to 17 liters Market Revenue Estimates and Forecasts, 2017 - 2030 (USD Billion)
4.5.3.5. X-small (3 to 8 liters)
4.5.3.5.1. X-small (3 to 8 liters) Market Revenue Estimates and Forecasts, 2017 - 2030 (USD Billion)
4.5.3.6. Petite (0.9 to 2.7 liters)
4.5.3.6.1. Petite (0.9 to 2.7 liters) Market Revenue Estimates and Forecasts, 2017 - 2030 (USD Billion)
4.5.4. Cold Chain bags/vaccine bags
4.5.4.1. Cold Chain bags/vaccine bags Market Revenue Estimates and Forecasts, 2017 - 2030 (USD Billion)
4.5.5. Ice packs
4.5.5.1. Ice packs Market Revenue Estimates and Forecasts, 2017 - 2030 (USD Billion)
4.5.6. Others
4.5.6.1. Others Market Revenue Estimates and Forecasts, 2017 - 2030 (USD Billion)
4.6. Monitoring Components
4.6.1. Monitoring Components Market Revenue Estimates and Forecasts, 2017 - 2030 (USD Billion)
4.6.2. Hardware
4.6.2.1. Hardware Market Revenue Estimates and Forecasts, 2017 - 2030 (USD Billion)
4.6.2.2. Sensors
4.6.2.2.1. Sensors Market Revenue Estimates and Forecasts, 2017 - 2030 (USD Billion)
4.6.2.3. RFID Devices
4.6.2.3.1. RFID Devices Market Revenue Estimates and Forecasts, 2017 - 2030 (USD Billion)
4.6.2.4. Telematics
4.6.2.4.1. Telematics Market Revenue Estimates and Forecasts, 2017 - 2030 (USD Billion)
4.6.2.5. Networking Devices
4.6.2.5.1. Networking Devices Market Revenue Estimates and Forecasts, 2017 - 2030 (USD Billion)
4.6.2.6. Others
4.6.2.6.1. Others Market Revenue Estimates and Forecasts, 2017 - 2030 (USD Billion)
4.6.3. Software
4.6.3.1. Software Market Revenue Estimates and Forecasts, 2017 - 2030 (USD Billion)
4.6.3.2. On-premises
4.6.3.2.1. On-premises Market Revenue Estimates and Forecasts, 2017 - 2030 (USD Billion)
4.6.3.3. Cloud
4.6.3.3.1. Cloud Market Revenue Estimates and Forecasts, 2017 - 2030 (USD Billion)
Chapter 5. Cold Chain Market: Temperature Range Estimates & Trend Analysis
5.1. Segment Dashboard
5.2. Cold Chain Market: Temperature Range Movement Analysis, USD Billion, 2023 & 2030
5.3. Chilled
5.3.1. Chilled Market Revenue Estimates and Forecasts, 2017 - 2030 (USD Billion)
5.4. Frozen
5.4.1. Frozen Market Revenue Estimates and Forecasts, 2017 - 2030 (USD Billion)
5.5. Deep Frozen
5.5.1. Deep Frozen Market Revenue Estimates and Forecasts, 2017 - 2030 (USD Billion)
Chapter 6. Cold Chain Market: Application Estimates & Trend Analysis
6.1. Segment Dashboard
6.2. Cold Chain Market: Application Movement Analysis, USD Billion, 2023 & 2030
6.3. Food & Beverages
6.3.1. Food & Beverages Market Revenue Estimates and Forecasts, 2017 - 2030 (USD Billion)
6.3.2. Fruits & Vegetables
6.3.2.1. Fruits & Vegetables Market Revenue Estimates and Forecasts, 2017 - 2030 (USD Billion)
6.3.3. Fruit Pulp & Concentrates
6.3.3.1. Fruit Pulp & Concentrates Market Revenue Estimates and Forecasts, 2017 - 2030 (USD Billion)
6.3.4. Dairy products
6.3.4.1. Dairy products Market Revenue Estimates and Forecasts, 2017 - 2030 (USD Billion)
6.3.5. Fish, meat, and Seafood
6.3.5.1. Fish, meat, and Seafood Market Revenue Estimates and Forecasts, 2017 - 2030 (USD Billion)
6.3.6. Processed Food
6.3.6.1. Processed Food Market Revenue Estimates and Forecasts, 2017 - 2030 (USD Billion)
6.3.7. Bakery & Confectionary
6.3.7.1. Bakery & Confectionary Market Revenue Estimates and Forecasts, 2017 - 2030 (USD Billion)
6.3.8. Others
6.3.8.1. Others Market Revenue Estimates and Forecasts, 2017 - 2030 (USD Billion)
6.4. Pharmaceuticals
6.4.1. Pharmaceuticals Market Revenue Estimates and Forecasts, 2017 - 2030 (USD Billion)
6.4.2. Vaccines
6.4.2.1. Vaccines Market Revenue Estimates and Forecasts, 2017 - 2030 (USD Billion)
6.4.3. Blood Banking
6.4.3.1. Blood Banking Market Revenue Estimates and Forecasts, 2017 - 2030 (USD Billion)
6.4.4. Others
6.4.4.1. Others Market Revenue Estimates and Forecasts, 2017 - 2030 (USD Billion)
6.5. Others
6.5.1. Others Market Revenue Estimates and Forecasts, 2017 - 2030 (USD Billion)
Chapter 7. Cold Chain Market: Regional Estimates & Trend Analysis
7.1. Cold Chain Market Share, By Region, 2023 & 2030, USD Billion
7.2. North America
7.2.1. North America Cold Chain Market Estimates and Forecasts, 2017 - 2030 (USD Billion)
7.2.2. North America Cold Chain Market Estimates and Forecasts, by Type, 2017 - 2030 (USD Billion)
7.2.3. North America Cold Chain Market Estimates and Forecasts, by Temperature Range, 2017 - 2030 (USD Billion)
7.2.4. North America Cold Chain Market Estimates and Forecasts, By Application, 2017 - 2030 (USD Billion)
7.2.5. U.S.
7.2.5.1. U.S. Cold Chain Market Estimates and Forecasts, 2017 - 2030 (USD Billion)
7.2.5.2. U.S. Cold Chain Market Estimates and Forecasts, by Type, 2017 - 2030 (USD Billion)
7.2.5.3. U.S. Cold Chain Market Estimates and Forecasts, by Temperature Range, 2017 - 2030 (USD Billion)
7.2.5.4. U.S. Cold Chain Market Estimates and Forecasts, By Application, 2017 - 2030 (USD Billion)
7.2.6. Canada
7.2.6.1. Canada Cold Chain Market Estimates and Forecasts, 2017 - 2030 (USD Billion)
7.2.6.2. Canada Cold Chain Market Estimates and Forecasts, by Type, 2017 - 2030 (USD Billion)
7.2.6.3. Canada Cold Chain Market Estimates and Forecasts, by Temperature Range, 2017 - 2030 (USD Billion)
7.2.6.4. Canada Cold Chain Market Estimates and Forecasts, By Application, 2017 - 2030 (USD Billion)
7.3. Europe
7.3.1. Europe Cold Chain Market Estimates and Forecasts, 2017 - 2030 (USD Billion)
7.3.2. Europe Cold Chain Market Estimates and Forecasts, by Type, 2017 - 2030 (USD Billion)
7.3.3. Europe Cold Chain Market Estimates and Forecasts, by Temperature Range, 2017 - 2030 (USD Billion)
7.3.4. Europe Cold Chain Market Estimates and Forecasts, By Application, 2017 - 2030 (USD Billion)
7.3.5. U.K.
7.3.5.1. U.K. Cold Chain Market Estimates and Forecasts, 2017 - 2030 (USD Billion)
7.3.5.2. U.K. Cold Chain Market Estimates and Forecasts, by Type, 2017 - 2030 (USD Billion)
7.3.5.3. U.K. Cold Chain Market Estimates and Forecasts, by Temperature Range, 2017 - 2030 (USD Billion)
7.3.5.4. U.K. Cold Chain Market Estimates and Forecasts, By Application, 2017 - 2030 (USD Billion)
7.3.6. Germany
7.3.6.1. Germany Cold Chain Market Estimates and Forecasts, 2017 - 2030 (USD Billion)
7.3.6.2. Germany Cold Chain Market Estimates and Forecasts, by Type, 2017 - 2030 (USD Billion)
7.3.6.3. Germany Cold Chain Market Estimates and Forecasts, by Temperature Range, 2017 - 2030 (USD Billion)
7.3.6.4. Germany Cold Chain Market Estimates and Forecasts, By Application, 2017 - 2030 (USD Billion)
7.3.7. France
7.3.7.1. France Cold Chain Market Estimates and Forecasts, 2017 - 2030 (USD Billion)
7.3.7.2. France Cold Chain Market Estimates and Forecasts, by Type, 2017 - 2030 (USD Billion)
7.3.7.3. France Cold Chain Market Estimates and Forecasts, by Temperature Range, 2017 - 2030 (USD Billion)
7.3.7.4. France Cold Chain Market Estimates and Forecasts, By Application, 2017 - 2030 (USD Billion)
7.3.8. Italy
7.3.8.1. Italy Cold Chain Market Estimates and Forecasts, 2017 - 2030 (USD Billion)
7.3.8.2. Italy Cold Chain Market Estimates and Forecasts, by Type, 2017 - 2030 (USD Billion)
7.3.8.3. Italy Cold Chain Market Estimates and Forecasts, by Temperature Range, 2017 - 2030 (USD Billion)
7.3.8.4. Italy Cold Chain Market Estimates and Forecasts, By Application, 2017 - 2030 (USD Billion)
7.3.9. Spain
7.3.9.1. Spain Cold Chain Market Estimates and Forecasts, 2017 - 2030 (USD Billion)
7.3.9.2. Spain Cold Chain Market Estimates and Forecasts, by Type, 2017 - 2030 (USD Billion)
7.3.9.3. Spain Cold Chain Market Estimates and Forecasts, by Temperature Range, 2017 - 2030 (USD Billion)
7.3.9.4. Spain Cold Chain Market Estimates and Forecasts, By Application, 2017 - 2030 (USD Billion)
7.3.10. Norway
7.3.10.1. Norway Cold Chain Market Estimates and Forecasts, 2017 - 2030 (USD Billion)
7.3.10.2. Norway Cold Chain Market Estimates and Forecasts, by Type, 2017 - 2030 (USD Billion)
7.3.10.3. Norway Cold Chain Market Estimates and Forecasts, by Temperature Range, 2017 - 2030 (USD Billion)
7.3.10.4. Norway Cold Chain Market Estimates and Forecasts, By Application, 2017 - 2030 (USD Billion)
7.3.11. Netherlands
7.3.11.1. Netherlands Cold Chain Market Estimates and Forecasts, 2017 - 2030 (USD Billion)
7.3.11.2. Netherlands Cold Chain Market Estimates and Forecasts, by Type, 2017 - 2030 (USD Billion)
7.3.11.3. Netherlands Cold Chain Market Estimates and Forecasts, by Temperature Range, 2017 - 2030 (USD Billion)
7.3.11.4. Netherlands Cold Chain Market Estimates and Forecasts, By Application, 2017 - 2030 (USD Billion)
7.3.12. Switzerland
7.3.12.1. Switzerland Cold Chain Market Estimates and Forecasts, 2017 - 2030 (USD Billion)
7.3.12.2. Switzerland Cold Chain Market Estimates and Forecasts, by Type, 2017 - 2030 (USD Billion)
7.3.12.3. Switzerland Cold Chain Market Estimates and Forecasts, by Temperature Range, 2017 - 2030 (USD Billion)
7.3.12.4. Switzerland Cold Chain Market Estimates and Forecasts, By Application, 2017 - 2030 (USD Billion)
7.3.13. Russia
7.3.13.1. Russia Cold Chain Market Estimates and Forecasts, 2017 - 2030 (USD Billion)
7.3.13.2. Russia Cold Chain Market Estimates and Forecasts, by Type, 2017 - 2030 (USD Billion)
7.3.13.3. Russia Cold Chain Market Estimates and Forecasts, by Temperature Range, 2017 - 2030 (USD Billion)
7.3.13.4. Russia Cold Chain Market Estimates and Forecasts, By Application, 2017 - 2030 (USD Billion)
7.4. Asia Pacific
7.4.1. Asia Pacific Cold Chain Market Estimates and Forecasts, 2017 - 2030 (USD Billion)
7.4.2. Asia Pacific Cold Chain Market Estimates and Forecasts, by Type, 2017 - 2030 (USD Billion)
7.4.3. Asia Pacific Cold Chain Market Estimates and Forecasts, by Temperature Range, 2017 - 2030 (USD Billion)
7.4.4. Asia Pacific Cold Chain Market Estimates and Forecasts, By Application, 2017 - 2030 (USD Billion)
7.4.5. China
7.4.5.1. China Cold Chain Market Estimates and Forecasts, 2017 - 2030 (USD Billion)
7.4.5.2. China Cold Chain Market Estimates and Forecasts, by Type, 2017 - 2030 (USD Billion)
7.4.5.3. China Cold Chain Market Estimates and Forecasts, by Temperature Range, 2017 - 2030 (USD Billion)
7.4.5.4. China Cold Chain Market Estimates and Forecasts, By Application, 2017 - 2030 (USD Billion)
7.4.6. Japan
7.4.6.1. Japan Cold Chain Market Estimates and Forecasts, 2017 - 2030 (USD Billion)
7.4.6.2. Japan Cold Chain Market Estimates and Forecasts, by Type, 2017 - 2030 (USD Billion)
7.4.6.3. Japan Cold Chain Market Estimates and Forecasts, by Temperature Range, 2017 - 2030 (USD Billion)
7.4.6.4. Japan Cold Chain Market Estimates and Forecasts, By Application, 2017 - 2030 (USD Billion)
7.4.7. India
7.4.7.1. India Cold Chain Market Estimates and Forecasts, 2017 - 2030 (USD Billion)
7.4.7.2. India Cold Chain Market Estimates and Forecasts, by Type, 2017 - 2030 (USD Billion)
7.4.7.3. India Cold Chain Market Estimates and Forecasts, by Temperature Range, 2017 - 2030 (USD Billion)
7.4.7.4. India Cold Chain Market Estimates and Forecasts, By Application, 2017 - 2030 (USD Billion)
7.4.8. South Korea
7.4.8.1. South Korea Cold Chain Market Estimates and Forecasts, 2017 - 2030 (USD Billion)
7.4.8.2. South Korea Cold Chain Market Estimates and Forecasts, by Type, 2017 - 2030 (USD Billion)
7.4.8.3. South Korea Cold Chain Market Estimates and Forecasts, by Temperature Range, 2017 - 2030 (USD Billion)
7.4.8.4. South Korea Cold Chain Market Estimates and Forecasts, By Application, 2017 - 2030 (USD Billion)
7.4.9. Australia
7.4.9.1. Australia Cold Chain Market Estimates and Forecasts, 2017 - 2030 (USD Billion)
7.4.9.2. Australia Cold Chain Market Estimates and Forecasts, by Type, 2017 - 2030 (USD Billion)
7.4.9.3. Australia Cold Chain Market Estimates and Forecasts, by Temperature Range, 2017 - 2030 (USD Billion)
7.4.9.4. Australia Cold Chain Market Estimates and Forecasts, By Application, 2017 - 2030 (USD Billion)
7.4.10. Singapore
7.4.10.1. Singapore Cold Chain Market Estimates and Forecasts, 2017 - 2030 (USD Billion)
7.4.10.2. Singapore Cold Chain Market Estimates and Forecasts, by Type, 2017 - 2030 (USD Billion)
7.4.10.3. Singapore Cold Chain Market Estimates and Forecasts, by Temperature Range, 2017 - 2030 (USD Billion)
7.4.10.4. Singapore Cold Chain Market Estimates and Forecasts, By Application, 2017 - 2030 (USD Billion)
7.5. Latin America
7.5.1. Latin America Cold Chain Market Estimates and Forecasts, 2017 - 2030 (USD Billion)
7.5.2. Latin America Cold Chain Market Estimates and Forecasts, by Type, 2017 - 2030 (USD Billion)
7.5.3. Latin America Cold Chain Market Estimates and Forecasts, by Temperature Range, 2017 - 2030 (USD Billion)
7.5.4. Latin America Cold Chain Market Estimates and Forecasts, By Application, 2017 - 2030 (USD Billion)
7.5.5. Brazil
7.5.5.1. Brazil Cold Chain Market Estimates and Forecasts, 2017 - 2030 (USD Billion)
7.5.5.2. Brazil Cold Chain Market Estimates and Forecasts, by Type, 2017 - 2030 (USD Billion)
7.5.5.3. Brazil Cold Chain Market Estimates and Forecasts, by Temperature Range, 2017 - 2030 (USD Billion)
7.5.5.4. Brazil Cold Chain Market Estimates and Forecasts, By Application, 2017 - 2030 (USD Billion)
7.5.6. Mexico
7.5.6.1. Mexico Cold Chain Market Estimates and Forecasts, 2017 - 2030 (USD Billion)
7.5.6.2. Mexico Cold Chain Market Estimates and Forecasts, by Type, 2017 - 2030 (USD Billion)
7.5.6.3. Mexico Cold Chain Market Estimates and Forecasts, by Temperature Range, 2017 - 2030 (USD Billion)
7.5.6.4. Mexico Cold Chain Market Estimates and Forecasts, By Application, 2017 - 2030 (USD Billion)
7.6. Middle East and Africa
7.6.1. Middle East and Africa Cold Chain Market Estimates and Forecasts, 2017 - 2030 (USD Billion)
7.6.2. Middle East and Africa Cold Chain Market Estimates and Forecasts, by Type, 2017 - 2030 (USD Billion)
7.6.3. Middle East and Africa Cold Chain Market Estimates and Forecasts, by Temperature Range, 2017 - 2030 (USD Billion)
7.6.4. Middle East and Africa Cold Chain Market Estimates and Forecasts, By Application, 2017 - 2030 (USD Billion)
7.6.5. Kingdom of Saudi Arabia (KSA)
7.6.5.1. Kingdom of Saudi Arabia (KSA) Cold Chain Market Estimates and Forecasts, 2017 - 2030 (USD Billion)
7.6.5.2. Kingdom of Saudi Arabia (KSA) Cold Chain Market Estimates and Forecasts, by Type, 2017 - 2030 (USD Billion)
7.6.5.3. Kingdom of Saudi Arabia (KSA) Cold Chain Market Estimates and Forecasts, by Temperature Range, 2017 - 2030 (USD Billion)
7.6.5.4. Kingdom of Saudi Arabia (KSA) Cold Chain Market Estimates and Forecasts, By Application, 2017 - 2030 (USD Billion)
7.6.6. UAE
7.6.6.1. UAE Cold Chain Market Estimates and Forecasts, 2017 - 2030 (USD Billion)
7.6.6.2. UAE Cold Chain Market Estimates and Forecasts, by Type, 2017 - 2030 (USD Billion)
7.6.6.3. UAE Cold Chain Market Estimates and Forecasts, by Temperature Range, 2017 - 2030 (USD Billion)
7.6.6.4. UAE Cold Chain Market Estimates and Forecasts, By Application, 2017 - 2030 (USD Billion)
7.6.7. South Africa
7.6.7.1. South Africa Cold Chain Market Estimates and Forecasts, 2017 - 2030 (USD Billion)
7.6.7.2. South Africa Cold Chain Market Estimates and Forecasts, by Type, 2017 - 2030 (USD Billion)
7.6.7.3. South Africa Cold Chain Market Estimates and Forecasts, by Temperature Range, 2017 - 2030 (USD Billion)
7.6.7.4. South Africa Cold Chain Market Estimates and Forecasts, By Application, 2017 - 2030 (USD Billion)
Chapter 8. Competitive Landscape
8.1. Recent Developments & Impact Analysis by Key Market Participants
8.2. Company Categorization
8.3. Company Market Positioning
8.4. Company Market Share Analysis
8.5. Strategy Mapping
8.5.1. Expansion
8.5.2. Mergers & Acquisition
8.5.3. Partnerships & Collaborations
8.5.4. New Transport Launches
8.5.5. Research And Development
8.6. Company Profiles
8.6.1. Americold Logistics, Inc.
8.6.1.1. Participant’s Overview
8.6.1.2. Financial Performance
8.6.1.3. Transport Benchmarking
8.6.1.4. Recent Developments
8.6.2. LINEAGE LOGISTICS HOLDING, LLC
8.6.2.1. Participant’s Overview
8.6.2.2. Financial Performance
8.6.2.3. Transport Benchmarking
8.6.2.4. Recent Developments
8.6.3. United States Cold Storage
8.6.3.1. Participant’s Overview
8.6.3.2. Financial Performance
8.6.3.3. Transport Benchmarking
8.6.3.4. Recent Developments
8.6.4. Burris Logistics
8.6.4.1. Participant’s Overview
8.6.4.2. Financial Performance
8.6.4.3. Transport Benchmarking
8.6.4.4. Recent Developments
8.6.5. Wabash National Corporation
8.6.5.1. Participant’s Overview
8.6.5.2. Financial Performance
8.6.5.3. Transport Benchmarking
8.6.5.4. Recent Developments
8.6.6. NewCold
8.6.6.1. Participant’s Overview
8.6.6.2. Financial Performance
8.6.6.3. Transport Benchmarking
8.6.6.4. Recent Developments
8.6.7. Sonoco ThermoSafe (Sonoco Products Company)
8.6.7.1. Participant’s Overview
8.6.7.2. Financial Performance
8.6.7.3. Transport Benchmarking
8.6.7.4. Recent Developments
8.6.8. United Parcel Service of America, Inc.
8.6.8.1. Participant’s Overview
8.6.8.2. Financial Performance
8.6.8.3. Transport Benchmarking
8.6.8.4. Recent Developments
8.6.9. A.P. Moller - Maersk
8.6.9.1. Participant’s Overview
8.6.9.2. Financial Performance
8.6.9.3. Transport Benchmarking
8.6.9.4. Recent Developments
8.6.10. NICHIREI CORPORATION
8.6.10.1. Participant’s Overview
8.6.10.2. Financial Performance
8.6.10.3. Transport Benchmarking
8.6.10.4. Recent Developments
8.6.11. Tippmann Group
8.6.11.1. Participant’s Overview
8.6.11.2. Financial Performance
8.6.11.3. Transport Benchmarking
8.6.11.4. Recent Developments
List of Tables
Table 1 Cold Chain- Industry snapshot & critical success factor, 2017 - 2030
Table 2 Global Cold Chain market, 2017- 2030 (USD Billion)
Table 3 Global Cold Chain market estimates and forecasts by Type 2017 - 2030 (USD Billion)
Table 4 Global Cold Chain market estimates and forecasts by Temperature Range 2017 - 2030 (USD Billion)
Table 5 Global Cold Chain market estimates and forecasts by Application 2017 - 2030 (USD Billion)
Table 6 Key Company Analysis
Table 7 Key Company Analysis - New Entrants
Table 8 Storage cold chain market estimates & forecasts, 2017 - 2030 (USD Billion)
Table 9 Transportation cold chain market estimates & forecasts, 2017 - 2030 (USD Billion)
Table 10 Packaging cold chain market estimates & forecasts, 2017 - 2030 (USD Billion)
Table 11 Monitoring components cold chain market estimates & forecasts, 2017 - 2030 (USD Billion)
Table 12 Cold chain market, by temperature range: Key takeaways
Table 13 Cold chain market, by temperature range: Market share, 2023 & 2030
Table 14 Chilled (0°C to 15°C) cold chain market estimates & forecasts, 2017 - 2030 (USD Billion)
Table 15 Frozen (-18°C to -25°C) cold chain market estimates & forecasts, 2017 - 2030 (USD Billion)
Table 16 Deep-frozen (Below -25°C) cold chain market estimates & forecasts, 2017 - 2030 (USD Billion)
Table 17 Cold chain market, by application: Key takeaways
Table 18 Cold chain market, by application: Market share, 2023 & 2030
Table 19 Food & beverages cold chain market estimates & forecasts, 2017 - 2030 (USD Billion)
Table 20 Pharmaceuticals cold chain market estimates & forecasts, 2017 - 2030 (USD Billion)
Table 21 Others cold chain market estimates & forecasts, 2017 - 2030 (USD Billion)
Table 22 North America Cold Chain market by Type, 2017 - 2030 (USD Billion)
Table 23 North America Cold Chain market by Temperature Range, 2017 - 2030 (USD Billion)
Table 24 North America Cold Chain market by Application, 2017 - 2030 (USD Billion)
Table 25 U.S. Cold Chain market by Type, 2017 - 2030 (USD Billion)
Table 26 U.S. Cold Chain market by Temperature Range, 2017 - 2030 (USD Billion)
Table 27 U.S. Cold Chain market by Application, 2017 - 2030 (USD Billion)
Table 28 Canada Cold Chain market by Type, 2017 - 2030 (USD Billion)
Table 29 Canada Cold Chain market by Temperature Range, 2017 - 2030 (USD Billion)
Table 30 Canada Cold Chain market by Application, 2017 - 2030 (USD Billion)
Table 31 Europe Cold Chain market by Type, 2017 - 2030 (USD Billion)
Table 32 Europe Cold Chain market by Temperature Range, 2017 - 2030 (USD Billion)
Table 33 Europe Cold Chain market by Application, 2017 - 2030 (USD Billion)
Table 34 UK Cold Chain market by Type, 2017 - 2030 (USD Billion)
Table 35 UK Cold Chain market by Temperature Range, 2017 - 2030 (USD Billion)
Table 36 UK Cold Chain market by Application, 2017 - 2030 (USD Billion)
Table 37 Germany Cold Chain market by Type, 2017 - 2030 (USD Billion)
Table 38 Germany Cold Chain market by Temperature Range, 2017 - 2030 (USD Billion)
Table 39 Germany Cold Chain market by Application, 2017 - 2030 (USD Billion)
Table 40 France Cold Chain market by Type, 2017 - 2030 (USD Billion)
Table 41 France Cold Chain market by Temperature Range, 2017 - 2030 (USD Billion)
Table 42 France Cold Chain market by Application, 2017 - 2030 (USD Billion)
Table 43 Italy Cold Chain market by Type, 2017 - 2030 (USD Billion)
Table 44 Italy Cold Chain market by Temperature Range, 2017 - 2030 (USD Billion)
Table 45 Italy Cold Chain market by Application, 2017 - 2030 (USD Billion)
Table 46 Spain Cold Chain market by Type, 2017 - 2030 (USD Billion)
Table 47 Spain Cold Chain market by Temperature Range, 2017 - 2030 (USD Billion)
Table 48 Spain Cold Chain market by Application, 2017 - 2030 (USD Billion)
Table 49 Norway Cold Chain market by Type, 2017 - 2030 (USD Billion)
Table 50 Norway Cold Chain market by Temperature Range, 2017 - 2030 (USD Billion)
Table 51 Norway Cold Chain market by Application, 2017 - 2030 (USD Billion)
Table 52 Netherlands Cold Chain market by Type, 2017 - 2030 (USD Billion)
Table 53 Netherlands Cold Chain market by Temperature Range, 2017 - 2030 (USD Billion)
Table 54 Netherlands Cold Chain market by Application, 2017 - 2030 (USD Billion)
Table 55 Switzerland Cold Chain market by Type, 2017 - 2030 (USD Billion)
Table 56 Switzerland Cold Chain market by Temperature Range, 2017 - 2030 (USD Billion)
Table 57 Switzerland Cold Chain market by Application, 2017 - 2030 (USD Billion)
Table 58 Russia Cold Chain market by Type, 2017 - 2030 (USD Billion)
Table 59 Russia Cold Chain market by Temperature Range, 2017 - 2030 (USD Billion)
Table 60 Russia Cold Chain market by Application, 2017 - 2030 (USD Billion)
Table 61 Asia Pacific Cold Chain market by Type, 2017 - 2030 (USD Billion)
Table 62 Asia Pacific Cold Chain market by Temperature Range, 2017 - 2030 (USD Billion)
Table 63 Asia Pacific Cold Chain market by Application, 2017 - 2030 (USD Billion)
Table 64 China Cold Chain market by Type, 2017 - 2030 (USD Billion)
Table 65 China Cold Chain market by Temperature Range, 2017 - 2030 (USD Billion)
Table 66 China Cold Chain market by Application, 2017 - 2030 (USD Billion)
Table 67 Japan Cold Chain market by Type, 2017 - 2030 (USD Billion)
Table 68 Japan Cold Chain market by Temperature Range, 2017 - 2030 (USD Billion)
Table 69 Japan Cold Chain market by Application, 2017 - 2030 (USD Billion)
Table 70 India Cold Chain market by Type, 2017 - 2030 (USD Billion)
Table 71 India Cold Chain market by Temperature Range, 2017 - 2030 (USD Billion)
Table 72 India Cold Chain market by Application, 2017 - 2030 (USD Billion)
Table 73 South Korea Cold Chain market by Type, 2017 - 2030 (USD Billion)
Table 74 South Korea Cold Chain market by Temperature Range, 2017 - 2030 (USD Billion)
Table 75 South Korea Cold Chain market by Application, 2017 - 2030 (USD Billion)
Table 76 Singapore Cold Chain market by Type, 2017 - 2030 (USD Billion)
Table 77 Singapore Cold Chain market by Temperature Range, 2017 - 2030 (USD Billion)
Table 78 Singapore Cold Chain market by Application, 2017 - 2030 (USD Billion)
Table 79 Australia Cold Chain market by Type, 2017 - 2030 (USD Billion)
Table 80 Australia Cold Chain market by Temperature Range, 2017 - 2030 (USD Billion)
Table 81 Australia Cold Chain market by Application, 2017 - 2030 (USD Billion)
Table 82 Latin America Cold Chain market by Type, 2017 - 2030 (USD Billion)
Table 83 Latin America Cold Chain market by Temperature Range, 2017 - 2030 (USD Billion)
Table 84 Latin America Cold Chain market by Application, 2017 - 2030 (USD Billion)
Table 85 Brazil Cold Chain market by Type, 2017 - 2030 (USD Billion)
Table 86 Brazil Cold Chain market by Temperature Range, 2017 - 2030 (USD Billion)
Table 87 Brazil Cold Chain market by Application, 2017 - 2030 (USD Billion)
Table 88 Mexico Cold Chain market by Type, 2017 - 2030 (USD Billion)
Table 89 Mexico Cold Chain market by Temperature Range, 2017 - 2030 (USD Billion)
Table 90 Mexico Cold Chain market by Application, 2017 - 2030 (USD Billion)
Table 91 MEA Cold Chain market by Type, 2017 - 2030 (USD Billion)
Table 92 MEA Cold Chain market by Temperature Range, 2017 - 2030 (USD Billion)
Table 93 MEA Cold Chain market by Application, 2017 - 2030 (USD Billion)
Table 94 Kingdom of Saudi Arabia (KSA) Cold Chain market by Type, 2017 - 2030 (USD Billion)
Table 95 Kingdom of Saudi Arabia (KSA) Cold Chain market by Temperature Range, 2017 - 2030 (USD Billion)
Table 96 Kingdom of Saudi Arabia (KSA) Cold Chain market by Application, 2017 - 2030 (USD Billion)
Table 97 UAE Cold Chain market by Type, 2017 - 2030 (USD Billion)
Table 98 UAE Cold Chain market by Temperature Range, 2017 - 2030 (USD Billion)
Table 99 UAE Cold Chain market by Application, 2017 - 2030 (USD Billion)
Table 100 South Africa Cold Chain market by Type, 2017 - 2030 (USD Billion)
Table 101 South Africa Cold Chain market by Temperature Range, 2017 - 2030 (USD Billion)
Table 102 South Africa Cold Chain market by Application, 2017 - 2030 (USD Billion)
Table 103 Participant's Overview
Table 104 Financial Performance
Table 105 Key companies undergoing expansion
Table 106 Key companies involved in mergers & acquisitions
Table 107 Key companies undertaking partnerships and collaboration
Table 108 Key companies launching new product/service launches
List of Figures
Fig. 1 Cold chain market segmentation
Fig. 2 Information procurement
Fig. 3 Data analysis models
Fig. 4 Market formulation and validation
Fig. 5 Data validating & publishing
Fig. 6 Market snapshot
Fig. 7 Segment snapshot (1/2)
Fig. 8 Segment snapshot (2/2)
Fig. 9 Competitive landscape snapshot
Fig. 10 Cold chain market value, 2017 - 2030 (USD Billion)
Fig. 11 Cold chain market - Industry value chain analysis
Fig. 12 Cold chain market - Market trends
Fig. 13 Cold chain market: Porter’s analysis
Fig. 14 Cold chain market: PESTEL analysis
Fig. 15 Cold chain market, by type: Key takeaways
Fig. 16 Cold chain market, by type: Market share, 2023 & 2030
Fig. 17 Storage cold chain market estimates & forecasts, 2017 - 2030 (USD Billion)
Fig. 18 Transportation cold chain market estimates & forecasts, 2017 - 2030 (USD Billion)
Fig. 19 Packaging cold chain market estimates & forecasts, 2017 - 2030 (USD Billion)
Fig. 20 Monitoring components cold chain market estimates & forecasts, 2017 - 2030 (USD Billion)
Fig. 21 Cold chain market, by temperature range: Key takeaways
Fig. 22 Cold chain market, by temperature range: Market share, 2023 & 2030
Fig. 23 Chilled (0°C to 15°C) cold chain market estimates & forecasts, 2017 - 2030 (USD Billion)
Fig. 24 Frozen (-18°C to -25°C) cold chain market estimates & forecasts, 2017 - 2030 (USD Billion)
Fig. 25 Deep-frozen (Below -25°C) cold chain market estimates & forecasts, 2017 - 2030 (USD Billion)
Fig. 26 Cold chain market, by application: Key takeaways
Fig. 27 Cold chain market, by application: Market share, 2023 & 2030
Fig. 28 Food & beverages cold chain market estimates & forecasts, 2017 - 2030 (USD Billion)
Fig. 29 Pharmaceuticals cold chain market estimates & forecasts, 2017 - 2030 (USD Billion)
Fig. 30 Others cold chain market estimates & forecasts, 2017 - 2030 (USD Billion)
Fig. 31 North America Cold chain market estimates & forecasts, 2017 - 2030 (USD Billion)
Fig. 32 U.S. Cold chain market estimates & forecasts, 2017 - 2030 (USD Billion)
Fig. 33 Canada Cold chain market estimates & forecasts, 2017 - 2030 (USD Billion)
Fig. 34 Europe Cold chain market estimates & forecasts, 2017 - 2030 (USD Billion)
Fig. 35 Germany Cold chain market estimates & forecasts, 2017 - 2030 (USD Billion)
Fig. 36 UK Cold chain market estimates & forecasts, 2017 - 2030 (USD Billion)
Fig. 37 France Cold chain market estimates & forecasts, 2017 - 2030 (USD Billion)
Fig. 38 Spain Cold chain market estimates & forecasts, 2017 - 2030 (USD Billion)
Fig. 39 Italy Cold chain market estimates & forecasts, 2017 - 2030 (USD Billion)
Fig. 40 Norway Cold chain market estimates & forecasts, 2017 - 2030 (USD Billion)
Fig. 41 Netherlands Cold chain market estimates & forecasts, 2017 - 2030 (USD Billion)
Fig. 42 Switzerland Cold chain market estimates & forecasts, 2017 - 2030 (USD Billion)
Fig. 43 Russia Cold chain market estimates & forecasts, 2017 - 2030 (USD Billion)
Fig. 44 Asia Pacific Cold chain market estimates & forecasts, 2017 - 2030 (USD Billion)
Fig. 45 India Cold chain market estimates & forecasts, 2017 - 2030 (USD Billion)
Fig. 46 China Cold chain market estimates & forecasts, 2017 - 2030 (USD Billion)
Fig. 47 Japan Cold chain market estimates & forecasts, 2017 - 2030 (USD Billion)
Fig. 48 India Cold chain market estimates & forecasts, 2017 - 2030 (USD Billion)
Fig. 49 Singapore Cold chain market estimates & forecasts, 2017 - 2030 (USD Billion)
Fig. 50 South Korea Cold chain market estimates & forecasts, 2017 - 2030 (USD Billion)
Fig. 51 Australia Cold chain market estimates & forecasts, 2017 - 2030 (USD Billion)
Fig. 52 Latin America Cold chain market estimates & forecasts, 2017 - 2030 (USD Billion)
Fig. 53 Brazil Cold chain market estimates & forecasts, 2017 - 2030 (USD Billion)
Fig. 54 Mexico Cold chain market estimates & forecasts, 2017 - 2030 (USD Billion)
Fig. 55 Middle East & Africa Cold chain market estimates & forecasts, 2017 - 2030 (USD Billion)
Fig. 56 Kingdom of Saudi Arabia (KSA) Cold chain market estimates & forecasts, 2017 - 2030 (USD Billion)
Fig. 57 UAE Cold chain market estimates & forecasts, 2017 - 2030 (USD Billion)
Fig. 58 South Africa Cold chain market estimates & forecasts, 2017 - 2030 (USD Billion)
Fig. 59 Key company categorization
Fig. 60 Cold chain market - Key company market share analysis, 2023
Fig. 61 Strategic framework
Market Segmentation
A three-pronged approach was followed for deducing the cold chain market estimates and forecasts. The process has three steps: information procurement, analysis, and validation. The whole process is cyclical, and steps repeat until the estimates are validated. The three steps are explained in detail below:
Information procurement: Information procurement is one of the most extensive and important stages in our research process, and quality data is critical for accurate analysis. We followed a multi-channel data collection process for cold chain market to gather the most reliable and current information possible.
Analysis: We mine the data collected to establish baselines for forecasting, identify trends and opportunities, gain insight into consumer demographics and drivers, and so much more. We utilized different methods of cold chain market data depending on the type of information we’re trying to uncover in our research.
Market Research Efforts: Bottom-up Approach for estimating and forecasting demand size and opportunity, top-down Approach for new product forecasting and penetration, and combined approach of both Bottom-up and Top-down for full coverage analysis.
Value-Chain-Based Sizing & Forecasting: Supply-side estimates for understanding potential revenue through competitive benchmarking, forecasting, and penetration modeling.
Demand-side estimates for identifying parent and ancillary markets, segment modeling, and heuristic forecasting.
Qualitative Functional Deployment (QFD) Modelling for market share assessment.
Market formulation and validation: We mine the data collected to establish baselines for forecasting, identify trends and opportunities, gain insight into consumer demographics and drivers, and so much more. We utilize different methods of data analysis depending on the type of information we’re trying to uncover in our research.
Market Formulation: This step involves the finalization of market numbers. This step on an internal level is designed to manage outputs from the Data Analysis step.
Data Normalization: The final market estimates and forecasts are then aligned and sent to industry experts, in-panel quality control managers for validation.
This step also entails the finalization of the report scope and data representation pattern.
Validation: The process entails multiple levels of validation. All these steps run in parallel, and the study is forwarded for publishing only if all three levels render validated results.
The cold chain market was categorized into four segments, namely type (Storage, Transportation, Packaging, Monitoring Components), temperature range (Chilled (0°C to 15°C), Frozen (-18°C to -25°C), Deep-frozen(Below -25°C)), application (Food & Beverages, Pharmaceuticals), and region (North America, Europe, Asia Pacific, Latin America, and Middle East & Africa)
The cold chain market was segmented into type, temperature range, application, and regions. The demand at a segment level was deduced using a funnel method. Concepts like the TAM, SAM, SOM, etc., were put into practice to understand the demand. We at GVR deploy three methods to deduce market estimates and determine forecasts. These methods are explained below:
Demand estimation of each product across countries/regions summed up to from the total market.
Variable analysis for demand forecast.
Demand estimation via analyzing paid database, and company financials either via annual reports or paid database.
Primary interviews for data revalidation and insight collection.
Used extensively for new product forecasting or analyzing penetration levels.
Tool used invoice product flow and penetration models Use of regression multi-variant analysis for forecasting Involves extensive use of paid and public databases.
Primary interviews and vendor-based primary research for variable impact analysis.
The cold chain market was analyzed at a regional level. The globe was divided into North America, Europe, Asia Pacific, Latin America, and Middle East & Africa, keeping in focus variables like consumption patterns, export-import regulations, consumer expectations, etc. These regions were further divided into twenty-two countries, namely, the U.S.; Canada; Germany; the UK; France; Spain; Italy; Norway; Netherlands; Switzerland; Russia; China; Japan; India; Singapore; South Korea; Australia; Brazil; Mexico; Kingdom of Saudi Arabia; UAE; South Africa.
All three above-mentioned market research methodologies were applied to arrive at regional-level conclusions. The regions were then summed up to form the global market.
The cold chain market was analyzed via companies operating in the sector. Analyzing these companies and cross-referencing them to the demand equation helped us validate our assumptions and conclusions. Key market players analyzed include:
Americold Logistics, Inc. - Americold Logistics, Inc. is a temperature-controlled warehousing and transportation company. It operates its business through three segments, namely warehouse, third-party managed, and transportation. Its offerings include producer solutions and retailer solutions. In December 2020, Americold Logistics, Inc. acquired Agro Merchants Group from an investor group for USD 1.59 billion.
Burris Logistics - Burris Logistics is a logistics and supply chain management service company that offers temperature-controlled warehousing and transportation services. The company's solution offerings include custom retail distribution, refrigerated warehousing, freight management, and redistribution of food service.
LINEAGE LOGISTICS HOLDING, LLC - LINEAGE LOGISTICS HOLDING, LLC provides warehousing and logistics solutions to users in various industries. The company’s solutions consist of temperaturecontrolled public warehousing facilities for storing multiple food commodities, including pork, beef, poultry, bakery products, fruits & vegetables, seafood, ice creams, and vegetables. It also provides port-centric cold chain facilities on the East and West Coasts to serve containerized markets and break bulk.
Wabash National Corporation - Wabash National Corporation offers advanced, connected, and engineered solutions for the incumbents of the logistics, transportation, and distribution industries. The company operates through Transportation Solutions and Parts & Services business segments. Its product range includes refrigerated vans, tank trailers, dry vans, platform trailers, refrigerated truck bodies, and dry truck bodies.
United States Cold Storage - United States Cold Storage is a temperature-controlled logistics and warehousing company that offers cold storage logistics, facilities, and services. The company provides logistics and transport solutions for frozen and refrigerated food products. It specializes in public warehousing, distribution, transportation services, cold storage, layer picking, dry warehousing, blast freezing, consolidation programs, automation, and repacking.
Tippmann Group - Tippmann Group has two subsidiaries, namely Interstate Warehousing and Tippmann Construction, which specialize in the construction of cold storage and management of frozen and refrigerated distribution centers. Interstate Warehousing manages refrigerated and frozen warehousing needs, offering temperature-controlled and customized distribution solutions for the food industry.
NFI Industries - NFI Industries is a supply chain solution provider with food-grade and temperature-controlled capabilities, serving food & beverage businesses. The company's customers include beverage producers, grocery retailers, and food manufacturers & processors. Its business lines include transportation management, brokerage, ecommerce fulfillment, distribution, and global logistics.
Penske - Penske provides supply chain management and logistics solutions worldwide. The company operates dedicated cold storage and ambient temperature facilities, driving operations through its expertise and technology. It majorly caters to convenience and grocery stores. It offers solutions such as freight management, warehousing, distribution center management, and Transportation Management Solutions (TMS).
Seafrigo Group - Seafrigo Group is a temperaturecontrolled food logistics company with 24 offices across five continents. The company specializes in business areas such as general cargo, fresh products, food industry, wine & spirits, and frozen products. It has 125,000 square meters of dry capability facilities and 81,000 square meters of temperaturecontrolled facilities. The company has three offices in Illinois, Florida, and New Jersey in the U.S.
NewCold - NewCold is an advanced automated warehouse and coldchain logistics company. Its supply chain solution includes automated warehouses and transport. It has marked its presence in 15 locations across North America, Europe, and Australia. In the U.S., the company operates in Indiana, Washington, Idaho, and Illinois.
Supply Side Estimates
Company revenue estimation via referring to annual reports, investor presentations, and Hoover’s.
Segment revenue determination via variable analysis and penetration modeling.
Competitive benchmarking to identify market leaders and their collective revenue shares.
Forecasting via analyzing commercialization rates, pipelines, market initiatives, distribution networks, etc.
Demand side estimates
Identifying parent markets and ancillary markets
Segment penetration analysis to obtain pertinent
revenue/volume
Heuristic forecasting with the help of subject matter experts
Forecasting via variable analysis
Understanding market dynamics (in terms of drivers, restraints, & opportunities) in the countries.
Understanding trends & variables in the individual countries & their impact on growth and using analytical tools to provide high-level insights into the market dynamics and the associated growth pattern.
Understanding market estimates and forecasts (with the base year as 2022, historic information from 2017 to 2021, and forecast from 2023 to 2030). Regional estimates & forecasts for each category are available and are summed up to form the global market estimates.
The report provides market value for the base year 2022 and a yearly forecast till 2030 in terms of revenue/volume or both. The market for each of the segment outlooks has been provided on region & country basis for the above-mentioned forecast period.
The key industry dynamics, major technological trends, and application markets are evaluated to understand their impact on the demand for the forecast period. The growth rates were estimated using correlation, regression, and time-series analysis.
We have used the bottom-up approach for market sizing, analyzing key regional markets, dynamics, & trends for various products and end-users. The total market has been estimated by integrating the country markets.
All market estimates and forecasts have been validated through primary interviews with the key industry participants.
Inflation has not been accounted for to estimate and forecast the market.
Numbers may not add up due to rounding off.
Europe consists of EU-8, Central & Eastern Europe, along with the Commonwealth of Independent States (CIS).
Asia Pacific includes South Asia, East Asia, Southeast Asia, and Oceania (Australia & New Zealand).
Latin America includes Central American countries and the South American continent
Middle East includes Western Asia (as assigned by the UN Statistics Division) and the African continent.
GVR strives to procure the latest and unique information for reports directly from industry experts, which gives it a competitive edge. Quality is of utmost importance to us, therefore every year we focus on increasing our experts’ panel. Primary interviews are one of the critical steps in identifying recent market trends and scenarios. This process enables us to justify and validate our market estimates and forecasts to our clients. With more than 8,000 reports in our database, we have connected with some key opinion leaders across various domains, including healthcare, technology, consumer goods, and the chemical sector. Our process starts with identifying the right platform for a particular type of report, i.e., emails, LinkedIn, seminars, or telephonic conversation, as every report is unique and requires a differentiated approach.
We send out questionnaires to different experts from various regions/ countries, which is dependent on the following factors:
Report/Market scope: If the market study is global, we send questionnaires to industry experts across various regions, including North America, Europe, Asia Pacific, Latin America, and MEA.
Market Penetration: If the market is driven by technological advancements, population density, disease prevalence, or other factors, we identify experts and send out questionnaires based on region or country dominance.
The time to start receiving responses from industry experts varies based on how niche or well-penetrated the market is. Our reports include a detailed chapter on the KoL opinion section, which helps our clients understand the perspective of experts already in the market space.
NEED A CUSTOM REPORT?
We can customize every report - free of charge - including purchasing stand-alone sections or country-level reports, as well as offer affordable discounts for start-ups & universities. Contact us now
We are GDPR and CCPA compliant! Your transaction & personal information is safe and secure. For more details, please read our privacy policy.
"The quality of research they have done for us has been excellent."