- Home
- »
- Pharmaceuticals
- »
-
Biosimilars Market Size And Share, Industry Report, 2033GVR Report cover
![Biosimilars Market Size, Share & Trends Report]()
Biosimilars Market (2025 - 2033) Size, Share & Trends Analysis Report By Drug Class (Monoclonal Antibodies (mAbs), Growth Factors & Hematopoietic Agents), By Indication, By End Use, By Region, And Segment Forecasts
- Report ID: 978-1-68038-916-6
- Number of Report Pages: 150
- Format: PDF
- Historical Range: 2021 - 2023
- Forecast Period: 2025 - 2033
- Industry: Healthcare
- Report Summary
- Table of Contents
- Segmentation
- Methodology
- Download FREE Sample
-
Download Sample Report
Biosimilars Market Summary
The global biosimilars market size was estimated at USD 33.92 million in 2024 and is projected to reach USD 151.58 million by 2033, growing at a CAGR of 18.27% from 2025 to 2033. The cost-effectiveness of biosimilar drugs and the prevalence of chronic disorders globally are major factors contributing to market growth.
Key Market Trends & Insights
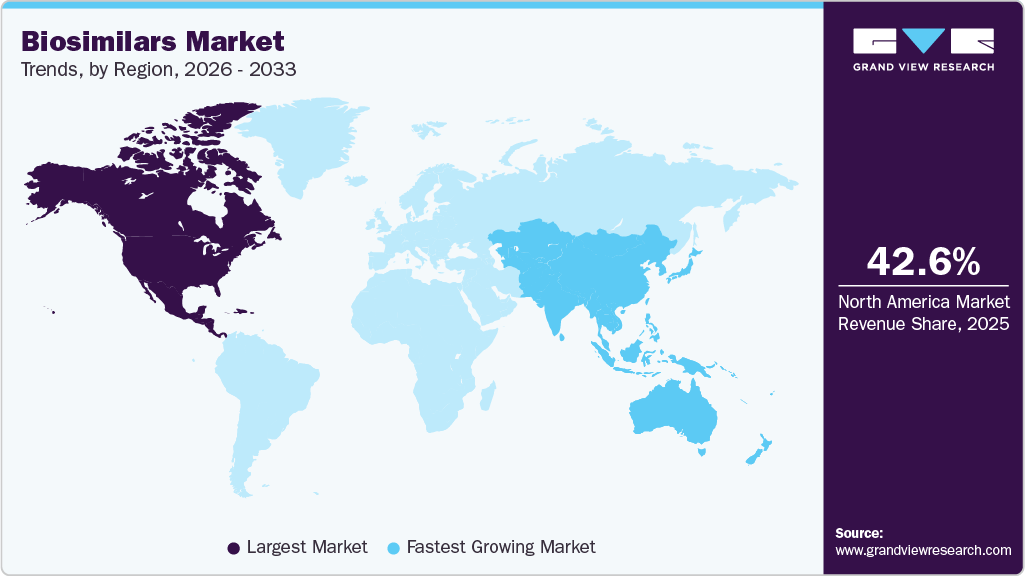
- North America dominated the market with the largest revenue share of 42.73% in 2024.
- Asia Pacific region is expected to grow at the fastest CAGR of 19.67% over the forecast period.
- By drug class, the monoclonal antibodies (mAbs) segment led the market with the largest revenue share of 44.98% in 2024.
- By indication, the autoimmune disorders (RA, IBD, psoriasis, and ankylosing spondylitis) segment led the market with the largest revenue share of 39.98% in 2024.
- By end use, the hospitals segment led the market with the largest revenue share of 52.09% in 2024.
Market Size & Forecast
- 2024 Market Size: USD 33.92 Million
- 2033 Projected Market Size: USD 151.58 Million
- CAGR (2025-2033): 18.27%
- North America: Largest market in 2024
- Asia Pacific: Fastest growing market
In addition, these drugs are comparatively easy to produce since they require less investment in research and development while providing similar results. This can help cut down expenditures on health. Moreover, the reduction in production costs and increasing demand can encourage producers to shift to biosimilars due to increased profits, which can give a further boost to this market. Biosimilars may contain slightly different substances and combinations of medical ingredients, but they are considered similar to their reference biologics in terms of effectiveness and safety.Several regulations are in place to assess the compatibility and safety of biosimilar drugs. For instance, the FDA’s Abbreviated New Drug Application Process requires applicants to scientifically prove that the performance of their product is similar to the reference biologics. It can be demonstrated by proving that their product takes a similar time to reach the bloodstream as the original product. Such regulations can help build trust in these drugs and expand their market share.
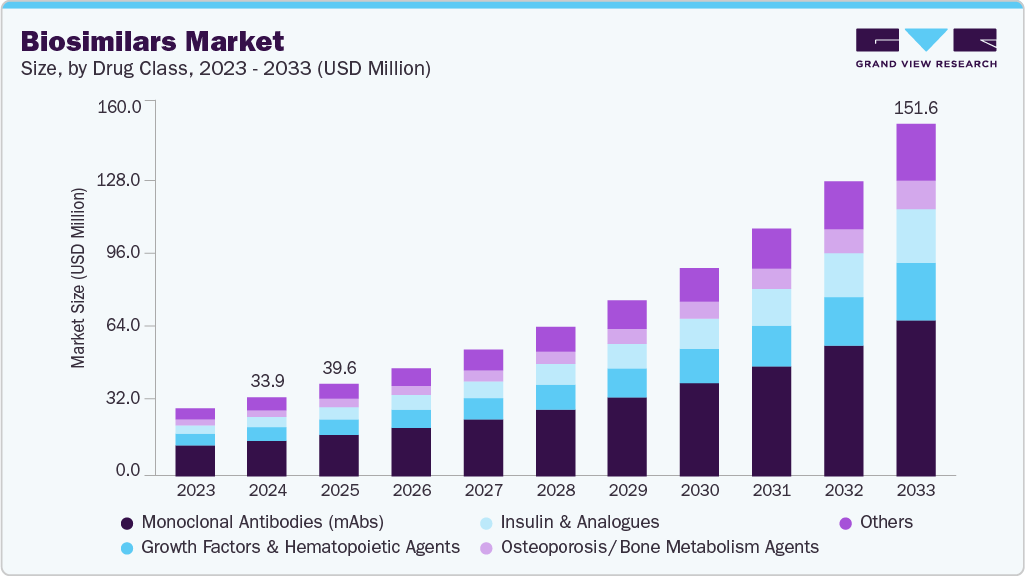
Moreover, the increasing prevalence of chronic or non-communicable diseases across the globe is also expected to drive the market. According to statistics released by the World Health Organization in November 2023, non-communicable diseases, such as cancer, diabetes, and heart diseases, cause 41 million deaths every year, out of which 77% of fatalities belong to low- and middle-income countries.
The U.S. FDA approved three cancer-related biosimilars in 2022, which are expected to hit the market in 2023. These growing opportunities in this market are also encouraging key players to increase their investment in the research and development of biosimilars. For instance, according to an article published in Business Today in April 2022, Biocon Biologics planned to increase its R&D expenses by 10% to 15% to advance its pipeline of biosimilar molecules. The step is expected to help strengthen its future position in the market. There is a boom in the pharmaceutical industry in the development of biosimilar medications.
Pricing Analysis
Oncology Biosimilars: In oncology, biosimilars have achieved average discounts of 52% for trastuzumab, 49% for bevacizumab, and 66% for rituximab compared to their reference products. These price reductions have been facilitated by the entry of multiple biosimilars into the market, fostering competition and driving down costs for both healthcare providers and patients.
Supportive Care Biosimilars: Supportive care biosimilars have demonstrated even more significant cost savings, with discounts ranging from 18% to 67% compared to reference biologics. This substantial reduction in costs has enhanced accessibility to essential supportive therapies, benefiting a broader patient population.
Overall Market Impact: The introduction and adoption of biosimilars have led to considerable savings in healthcare expenditures. In 2023 alone, biosimilars contributed to USD 12.4 billion in savings, with total savings reaching USD 36 billion since their market introduction in 2015. These savings have been instrumental in reducing the financial burden on healthcare systems and improving patient access to necessary treatments.
Future Outlook: Looking ahead, the biosimilars industry is poised for continued growth, with projections indicating that biosimilars could generate over USD 130 billion in savings over the next decade. This anticipated growth is attributed to the expanding pipeline of biosimilars, increased market competition, and ongoing efforts to enhance patient access to affordable biologic therapies.
Pipeline Analysis
NCT Number
Sponsor
Phases
Start Date
Completion Date
NCT07108127
Peking Union Medical College Hospital
PHASE2
6/20/2025
12/31/2026
NCT06860490
Fudan University
PHASE2
3/18/2025
3/10/2028
NCT05696613
Cerium Pharmaceuticals, Inc.
PHASE3
3/13/2023
3/1/2026
NCT06031285
Sun Yat-sen University
PHASE2
9/1/2023
12/30/2026
NCT06667050
West China Hospital
PHASE2
10/10/2024
10/31/2027
NCT05530057
Seoul National University Hospital
PHASE2
2/18/2020
12/31/2026
NCT05850546
Children's Hospital of Fudan University
PHASE3
3/1/2025
12/28/2026
NCT06551064
Formycon AG
PHASE1
7/1/2024
6/30/2026
NCT06841185
Shanghai Henlius Biotech
PHASE3
4/30/2025
5/5/2028
NCT07162883
Qilu Pharmaceutical Co., Ltd.
PHASE3
9/1/2025
5/31/2027
NCT06847334
Shanghai Henlius Biotech
PHASE3
4/27/2025
1/24/2028
NCT06847724
Sandoz
PHASE3
6/10/2025
10/14/2029
NCT05406401
Merck Sharp & Dohme LLC
PHASE2
7/14/2022
4/26/2029
NCT01624805
M.D. Anderson Cancer Center
PHASE2
6/25/2012
6/30/2026
NCT06349980
Shanghai Henlius Biotech
PHASE2
8/5/2024
2/10/2027
NCT06038539
Biocon Biologics UK Ltd
PHASE3
1/6/2025
11/15/2026
Source: ClinicalTrials.gov
The global biosimilars pipeline is expanding rapidly, with a strong focus on late-stage clinical development across oncology, autoimmune, and chronic metabolic diseases. Several Phase 2 and Phase 3 candidates are expected to enter the market in the next few years, indicating robust near-term growth potential. This active development pipeline is likely to intensify competition among manufacturers, driving price reductions and enhancing patient access to high-cost biologics. Innovations in molecular design and delivery technologies are improving safety, efficacy, and patient adherence, which will increase physician confidence and uptake.
Moreover, the broad geographic distribution of ongoing clinical programs suggests that emerging markets will see faster adoption, complementing established markets in North America and Europe. As multiple biosimilars gain approval, market consolidation and strategic partnerships are expected, enhancing distribution channels and accelerating market penetration. Overall, the pipeline underscores sustained revenue growth and wider therapeutic accessibility in the biosimilars sector.
Market Concentration & Characteristics
The biosimilars industry demonstrates moderate to high innovation, as companies focus on replicating complex biologic molecules with high precision. Technological advancements in molecular engineering, cell-line optimization, and formulation development enhance product efficacy and safety. Innovative delivery devices, such as autoinjectors and prefilled pens, improve patient compliance. Continuous improvement in analytical characterization allows differentiation from reference products. Investment in novel clinical trial designs accelerates market readiness and adoption.
Market entry for biosimilars is challenging due to high R&D costs and complex manufacturing processes. Regulatory approval requires extensive clinical and analytical data to demonstrate similarity to reference biologics. Intellectual property protections, including patents on original biologics, can delay new entrants. Access to advanced manufacturing facilities and skilled personnel is critical. Market competition from established players with strong distribution networks further limits new entrants.
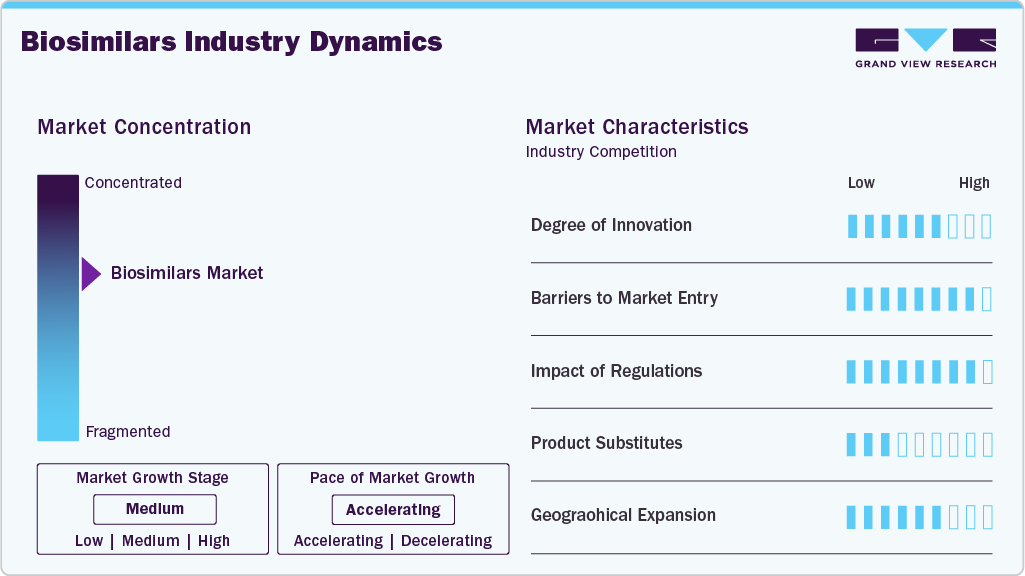
Regulations strongly influence market dynamics, ensuring safety, efficacy, and quality of biosimilars. Approval pathways are stringent, requiring comparative clinical and immunogenicity data. Regulatory frameworks vary across regions, affecting speed of market entry. Post-approval monitoring and pharmacovigilance obligations add operational requirements. Clear guidance on interchangeability and substitution impacts adoption rates.
Biosimilars face competition from originator biologics, generic small-molecule drugs, and emerging novel therapies. While cost advantages drive adoption, prescriber preference and clinical familiarity with originators can limit substitution. Innovative reference products with extended patent protection maintain market share. Combination therapies and next-generation biologics present alternative treatment options. Increasing patient awareness of biosimilar efficacy is gradually reducing reliance on original biologics.
Biosimilar adoption is expanding globally, with North America and Europe leading in revenue, while the Asia Pacific shows the fastest growth. Emerging markets offer opportunities due to growing disease prevalence and demand for affordable therapies. Expansion is supported by strategic partnerships and local manufacturing. Variations in regulatory frameworks and healthcare infrastructure influence regional penetration. Focused market entry strategies enhance accessibility across hospitals, specialty pharmacies, and retail channels.
Drug Class Insights
The monoclonal antibodies (mAbs) segment led the market with the largest revenue share of 44.98% in 2024, driven by increasing adoption of biosimilar mAbs in treating chronic diseases. The rising prevalence of autoimmune disorders and cancers has expanded the patient pool. Improved affordability of biosimilar mAbs compared to original biologics has enhanced accessibility. Strong clinical efficacy and comparable safety profiles to reference products have strengthened physician confidence. Patent expirations of several key biologics have accelerated market entry of mAb biosimilars.
For instance, in October 2025, INOVIO Pharmaceuticals published clinical proof-of-concept data for DNA-encoded monoclonal antibodies (DMAbs) in Nature Medicine. The Phase 1 trial utilized synthetic DNA technology to enable in vivo production of monoclonal antibodies directly from muscle cells, with participants receiving intramuscular injections of synthetic DNA plasmids encoding AZD5396 and AZD8076 via INOVIO's CELLECTRA 2000 electroporation device. Notably, 100% of participants who reached week 72 maintained biologically relevant levels of DMAbs, and no participant developed anti-drug antibodies, highlighting the durability and safety of this innovative approach. Increased awareness among healthcare professionals and patients supports higher prescription rates. Availability of multiple therapeutic options within mAbs enhances competitive adoption. Strategic partnerships between biosimilar developers and distributors further facilitate market penetration.
The insulin & analogues segment is projected to grow at the fastest CAGR of 20.37% over the forecast period, fueled by the increasing prevalence of diabetes globally. Rising demand for cost-effective alternatives to branded insulin drives biosimilar adoption. Improved supply chains ensure wider accessibility in hospitals and pharmacies. Technological advancements in insulin delivery devices support patient compliance.
For instance, in February 2025, the U.S. Food and Drug Administration (FDA) approved Merilog (insulin-aspart-szjj), the first rapid-acting insulin biosimilar product for the treatment of diabetes. Merilog is indicated to improve glycemic control in both adults and pediatric patients, available in a 3 milliliter (mL) single-patient-use prefilled pen and a 10 milliliter (mL) multiple-dose vial, marking the third insulin biosimilar approved following two long-acting biosimilars in 2021. Expansion of diabetes care programs encourages routine use of biosimilar insulin. Rising healthcare expenditure in emerging regions supports market growth. Patient preference for affordable, high-quality treatment options strengthens demand. Expansion of clinical trials demonstrating biosimilar insulin efficacy and safety boosts confidence among prescribers.
Indication Insights
The autoimmune disorders (RA, IBD, psoriasis, and ankylosing spondylitis) segment led the market with the largest revenue share of 39.98% in 2024, driven by the growing prevalence of chronic inflammatory conditions. Biosimilar biologics provide cost-effective alternatives to reference therapies, expanding access for patients requiring long-term treatment. Strong clinical evidence confirming efficacy and safety continues to drive physician confidence and adoption.
For instance, in October 2025, Celltrion, Inc. announced that YUFLYMA (adalimumab-aaty) and its unbranded version received U.S. FDA approval for two new pediatric indications: adolescent hidradenitis suppurativa (HS) in patients aged 12 years and older and pediatric uveitis (UV) in patients aged 2 years and older. The approval followed its initial U.S. launch in July 2023 and expanded treatment coverage for HS affecting 1%-4% of the U.S. population and UV, accounting for 5%-10% of uveitis cases. Increased availability of biosimilars enhances prescribing flexibility and treatment accessibility.
The oncology (breast, colorectal, lymphoma, lung, gastric) segment is projected to grow at the fastest CAGR of 19.36% over the forecast period,fueled by rising cancer prevalence globally. Biosimilar adoption reduces treatment costs for expensive biologic therapies. Expanding availability of biosimilars for key oncology drugs improves treatment accessibility.
For instance, in April 2025, Biocon Biologics Ltd. announced U.S. Food and Drug Administration (FDA) approval of Jobevne (bevacizumab-nwgd), a biosimilar to Avastin (bevacizumab) for intravenous use in treating several cancer types. The company noted that bevacizumab sales in the U.S. had been approximately US USD 2.0 billion in 2023, and the approval expanded its U.S. oncology biosimilar portfolio to seven products. Jobevne, the sixth bevacizumab biosimilar approved in the U.S., had earlier received approvals in Europe in February 2021 and Canada in November 2021, supported by comparative data confirming no clinically meaningful differences in pharmacokinetics, safety, efficacy, and immunogenicity. Strong clinical evidence demonstrating comparable efficacy and safety builds oncologists confidence. Patient preference for affordable treatments supports market growth. Hospitals and specialty pharmacies provide easier access for cancer patients. Expansion of targeted therapy options ensures wider clinical application across tumor types.
End-Use Insights
The hospitals segment led the market with the largest revenue share of 52.09% in 2024, which can be attributed to high patient inflow and structured treatment protocols. Hospitals provide easier administration and monitoring of complex biologics. Adoption of cost-effective biosimilars reduces overall treatment expenditure. Hospitals maintain long-term supply contracts, ensuring consistent availability. Presence of specialized departments supports the use of mAbs and oncology biosimilars. Physician preference for proven efficacy drives prescription trends. Hospitals participate in clinical programs supporting biosimilar adoption. An increasing number of hospital-based treatment centers enhances the reach and utilization of biosimilars.
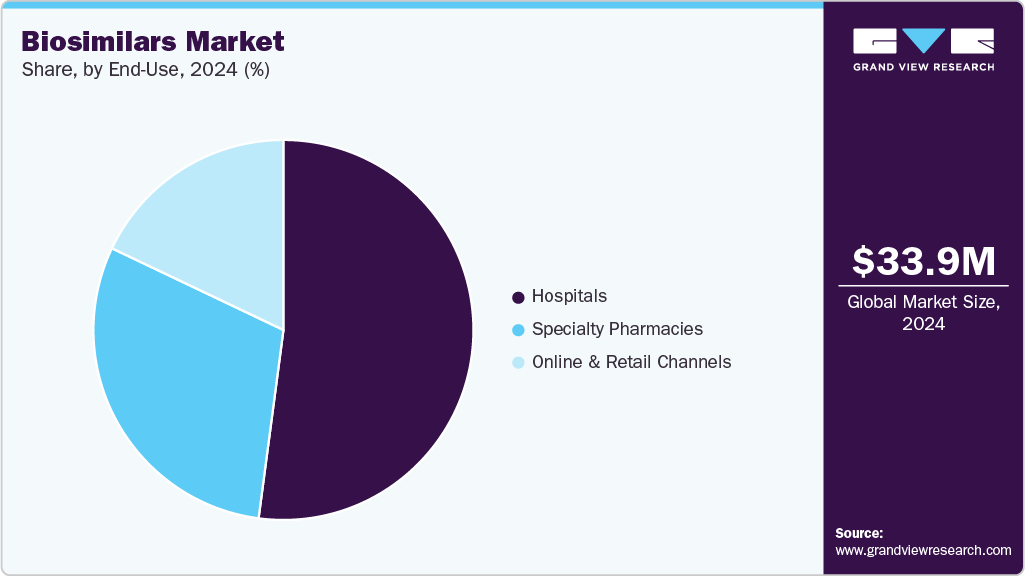
The specialty pharmacies segment is projected to grow at the fastest CAGR of 17.94% over the forecast period, due to increasing demand for home-based treatment and patient convenience. Specialty pharmacies offer access to high-cost biologics at lower prices through biosimilars. Enhanced patient education and counseling programs support adherence. Technological integration improves prescription management and drug delivery. The growing prevalence of chronic conditions requiring long-term therapy strengthens market demand. Direct distribution of biosimilars ensures faster availability for patients. Collaboration with healthcare providers enhances treatment follow-up and monitoring. Expansion of specialty pharmacy networks increases reach across urban and semi-urban regions.
Regional Insights
North America dominated the biosimilars market with the largest revenue share of 42.73% in 2024, driven by high adoption of cost-effective alternatives to biologics. Advanced healthcare infrastructure supports easy distribution of biosimilars. Strong presence of leading pharmaceutical companies accelerates product launches. Rising prevalence of chronic diseases, including autoimmune disorders and cancer, maintains consistent demand. Awareness among physicians and patients regarding biosimilar efficacy strengthens prescription rates. Expansion of hospital and specialty pharmacy networks enhances accessibility across the region.
U.S. Biosimilars Market Trends
The biosimilars market in the U.S. accounted for the largest market revenue share in North America in 2024, fueled by the rapid acceptance of monoclonal antibody and insulin biosimilars. Robust clinical research programs validate biosimilar safety and effectiveness. High healthcare expenditure encourages the adoption of affordable treatment options. Specialty pharmacies and hospitals ensure smooth product distribution. Growth in autoimmune and oncology patient populations drives continuous demand. Strategic partnerships between manufacturers and healthcare providers support market penetration.
Europe Biosimilars Market Trends
The biosimilars market in Europe maintains a strong position due to early adoption of biologic alternatives. High awareness of biosimilar benefits among physicians enhances prescription rates. Expiring patents of key biologics enable market entry of multiple products. The increasing prevalence of chronic inflammatory and oncology conditions sustains demand. Developed supply chains to support efficient distribution to hospitals and pharmacies. Availability of various biosimilar options improves treatment accessibility and flexibility.
The UK biosimilars market exhibits steady growth driven by the adoption of monoclonal antibodies for autoimmune and oncology therapies. Awareness campaigns among healthcare professionals support higher utilization. The presence of multiple suppliers ensures competitive pricing. Hospitals play a central role in administering complex biologics. Expansion of specialty pharmacy networks improves patient access. The rising prevalence of chronic diseases strengthens long-term market demand.
The biosimilars market in Germany shows robust growth, supported by increasing use of biosimilars in oncology and autoimmune disorders. High-quality manufacturing and clinical validation foster physician confidence. Strong hospital networks facilitate efficient distribution. Biosimilars reduce overall treatment costs, encouraging prescription. Awareness of cost-effective therapies among patients drives adoption. Increasing chronic disease incidence supports continuous market expansion.
The France biosimilars market demonstrates consistent uptake of biosimilars due to rising adoption in hospitals and specialty pharmacies. Availability of multiple therapeutic biosimilars supports treatment flexibility. Physicians prefer products with proven clinical equivalence to reference biologics. Expansion of chronic disease patient populations maintains steady demand. Competitive pricing enhances accessibility for long-term therapy. Strong partnerships between manufacturers and healthcare providers improve distribution efficiency.
Asia-Pacific Biosimilars Market Trends
The biosimilars market in the Asia Pacific is expected to register at the fastest CAGR of 19.67% over the forecast period, fueled by the increasing prevalence of diabetes, cancer, and autoimmune disorders. Growing awareness of biosimilar efficacy among healthcare professionals accelerates adoption. Rising demand for affordable biologics enhances market penetration. Expansion of hospital and pharmacy networks improves accessibility in urban and semi-urban areas. Increasing investment by pharmaceutical companies in biosimilar production supports growth. Technological advancements in biologic manufacturing ensure quality and consistency.
The Japan biosimilars market demonstrates steady market growth, supported by the adoption of insulin and monoclonal antibody biosimilars. High-quality clinical validation builds physician trust. Hospitals and specialty pharmacies facilitate distribution to chronic disease patients. The rising incidence of autoimmune and oncology conditions drives demand. Availability of multiple therapeutic options strengthens treatment flexibility. Expanding patient awareness encourages long-term use of biosimilars.
The biosimilars market in China shows rapid growth due to increasing demand for cost-effective treatments for cancer and diabetes. Rising population and healthcare access expansion drive market adoption. Growing production capacity ensures a consistent supply of biosimilars. Strong physician and patient awareness support prescription trends. Availability of competitive biosimilar alternatives encourages uptake. Expansion of hospital and specialty pharmacy networks enhances accessibility.
Latin America Biosimilars Market Trends
The biosimilars market in Latin America is experiencing steady market growth, supported by increasing adoption of monoclonal antibodies for oncology and autoimmune disorders. Rising awareness among healthcare professionals encourages biosimilar use. Hospitals and specialty pharmacies provide structured distribution channels. Patient preference for affordable treatment strengthens demand. Entry of new biosimilar products enhances therapeutic options. Expanding chronic disease prevalence maintains consistent market potential. For instance, in September 2025, Argentina recently approved Agalzyme, the first biosimilar of agalsidase beta for Fabry disease, improving patient access to high-cost therapies and demonstrating the region’s commitment to expanding biosimilar availability.
The Brazil biosimilars market shows growing adoption, driven by the need for cost-effective treatments for cancer and diabetes. Expansion of hospital and specialty pharmacy networks ensures accessibility. Physician confidence in clinical equivalence drives prescriptions. Availability of multiple therapeutic options supports flexible treatment plans. Rising awareness among patients strengthens uptake. Market entry of new products fuels competitive adoption.
Middle East & Africa Biosimilars Market Trends
The biosimilars market in MEA shows gradual market growth due to increasing demand for biosimilars in oncology and autoimmune therapies. Expansion of hospital and pharmacy networks enhances accessibility. Awareness among physicians and patients supports adoption. Rising prevalence of chronic diseases drives steady demand. Competitive pricing encourages uptake of biosimilar therapies. Introduction of new products in the region strengthens market penetration.
The Saudi Arabia biosimilars market demonstrates moderate growth, fueled by increasing use of biosimilars in hospitals for chronic disease management. Physician confidence in biosimilar efficacy supports prescriptions. Expansion of specialty pharmacy networks improves patient access. Rising prevalence of autoimmune and oncology conditions sustains demand. Availability of multiple therapeutic options enhances treatment flexibility. Entry of new biosimilar products strengthens competitive landscape
Key Biosimilars Company Insights
The market is highly competitive, with the presence of a large number of global and local players. Since biosimilars help in the reduction of costs and lead to increased profit margins, it has encouraged new players to enter the market.
- Dr. Reddy’s Laboratories, a global pharmaceutical company, operates across four main business segments and has notably strengthened its presence in the biosimilars space through its specialized division, Dr. Reddy’s Biologics. This division is dedicated to developing and commercializing high-quality biosimilars targeting therapeutic areas such as oncology, autoimmune disorders, hematology, and nephrology.
Key Biosimilars Companies:
The following are the leading companies in the biosimilars market. These companies collectively hold the largest market share and dictate industry trends.
- Amgen Inc.
- F Hoffman-La Roche Ltd.
- Sandoz International GmbH
- Dr. Reddy’s Laboratories Ltd.
- Teva Pharmaceutical Industries Ltd.
- Pfizer Inc.
- Samsung Biopis
- Biocon
- Viatris Inc.
- Celltrion Healthcare Co., Ltd.
- AbbVie Inc.
Recent Developments
-
In July 2025, Celltrion USA announced that STOBOCLO and OSENVELT were commercially available in the U.S. They are biosimilars referencing PROLIA and XGEVA.
-
In April 2025, Biocon Biologics secured U.S. FDA approval for Jobevne, a biosimilar to Avastin, further expanding its oncology portfolio. This milestone strengthens the company’s presence in the oncology segment and complements its existing treatments.
Biosimilars Market Report Scope
Report Attribute
Details
Market size value in 2025
USD 39.59 million
Revenue forecast in 2033
USD 151.58 million
Growth rate
CAGR 18.27% from 2025 to 2033
Base year for estimation
2024
Historical data
2021 - 2023
Forecast period
2025 - 2033
Quantitative units
Revenue in USD million/billion and CAGR from 2025 to 2033
Report coverage
Revenue forecast, company ranking, competitive landscape, growth factors, trends
Segments covered
Drug class, indication, end use, region
Regional scope
North America; Europe; Asia Pacific; Latin America; Middle East & Africa
Country scope
U.S.; Canada; Mexico; UK; Germany; France; Italy; Spain; Denmark; Sweden; Norway; China; Japan; India; Australia; South Korea; Thailand; Brazil; Argentina; Saudi Arabia; South Africa; UAE; Kuwait
Key company profiled
Amgen Inc.; F Hoffman-La Roche Ltd.; Sandoz International GmbH; Dr. Reddy’s Laboratories; Teva Pharmaceutical Industries Ltd; Pfizer Inc.; Samsung Biopis; Biocon; Viatris Inc.; Celltrion Healthcare Co.,Ltd; AbbVie Inc.
Customization scope
Free report customization (equivalent up to 8 analysts working days) with purchase. Addition or alteration to country, regional & segment scope.
Pricing and purchase options
Avail customized purchase options to meet your exact research needs. Explore purchase options
Global Biosimilars Market Report Segmentation
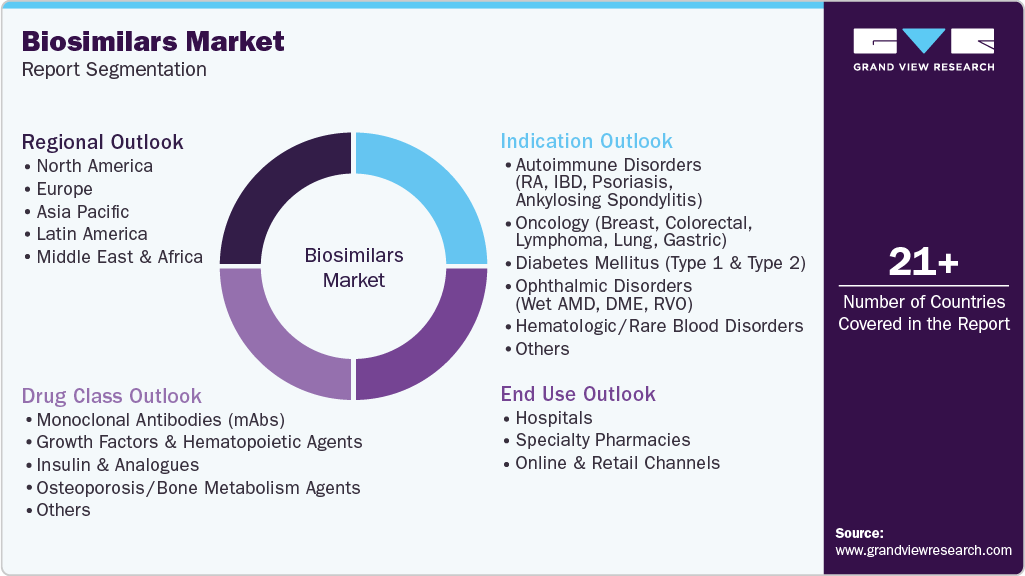
This report forecasts revenue growth at global, regional, and country levels and provides an analysis of the latest industry trends in each of the sub-segments from 2021 to 2033. For this study, Grand View Research has segmented the global biosimilars market report based on drug class, indication, end use and region:
-
Drug Class Outlook (Revenue, USD Billion, 2021 - 2033)
-
Monoclonal Antibodies (mAbs)
-
Growth Factors & Hematopoietic Agents
-
Insulin & Analogues
-
Osteoporosis / Bone Metabolism Agents
-
Others
-
-
Indication Outlook (Revenue, USD Billion, 2021 - 2033)
-
Autoimmune Disorders (RA, IBD, Psoriasis, Ankylosing Spondylitis)
-
Oncology (Breast, Colorectal, Lymphoma, Lung, Gastric)
-
Diabetes Mellitus (Type 1 & Type 2)
-
Ophthalmic Disorders (Wet AMD, DME, RVO)
-
Hematologic / Rare Blood Disorders
-
Others
-
-
End Use Outlook (Revenue, USD Billion, 2021 - 2033)
-
Hospitals
-
Specialty Pharmacies
-
Online & Retail Channels
-
-
Regional Outlook (Revenue, USD Billion, 2021 - 2033)
-
North America
-
U.S.
-
Canada
-
Mexico
-
-
Europe
-
UK
-
Germany
-
France
-
Italy
-
Spain
-
Denmark
-
Sweden
-
Norway
-
-
Asia Pacific
-
Japan
-
China
-
India
-
Australia
-
South Korea
-
Thailand
-
-
Latin America
-
Brazil
-
Argentina
-
-
Middle East & Africa
-
South Africa
-
Saudi Arabia
-
UAE
-
Kuwaita
-
-
Frequently Asked Questions About This Report
b. The global biosimilars market size was estimated at USD 33.92 million in 2024 and is expected to reach USD 39.59 million in 2025.
b. The global biosimilars market is expected to grow at a compound annual growth rate of 18.27% from 2025 to 2033 to reach USD 151.58 million by 2033.
b. The hospitals segment led the market with the largest revenue share of 52.09% in 2024.
b. Major market players in the biosimilars market include Amgen Inc.; F Hoffman-La Roche Ltd.; Sandoz International GmbH; Dr. Reddy’s Laboratories; Teva Pharmaceutical Industries Ltd; Pfizer Inc.; Samsung Biopis; Biocon; Viatris Inc.; Celltrion Healthcare Co.,Ltd; AbbVie Inc.
b. The cost-effectiveness of biosimilar drugs and the high prevalence of chronic disorders globally are some major factors contributing to biosimilars market growth.
Share this report with your colleague or friend.
Need a Tailored Report?
Customize this report to your needs — add regions, segments, or data points, with 20% free customization.

ISO 9001:2015 & 27001:2022 Certified
We are GDPR and CCPA compliant! Your transaction & personal information is safe and secure. For more details, please read our privacy policy.
Trusted market insights - try a free sample
See how our reports are structured and why industry leaders rely on Grand View Research. Get a free sample or ask us to tailor this report to your needs.


