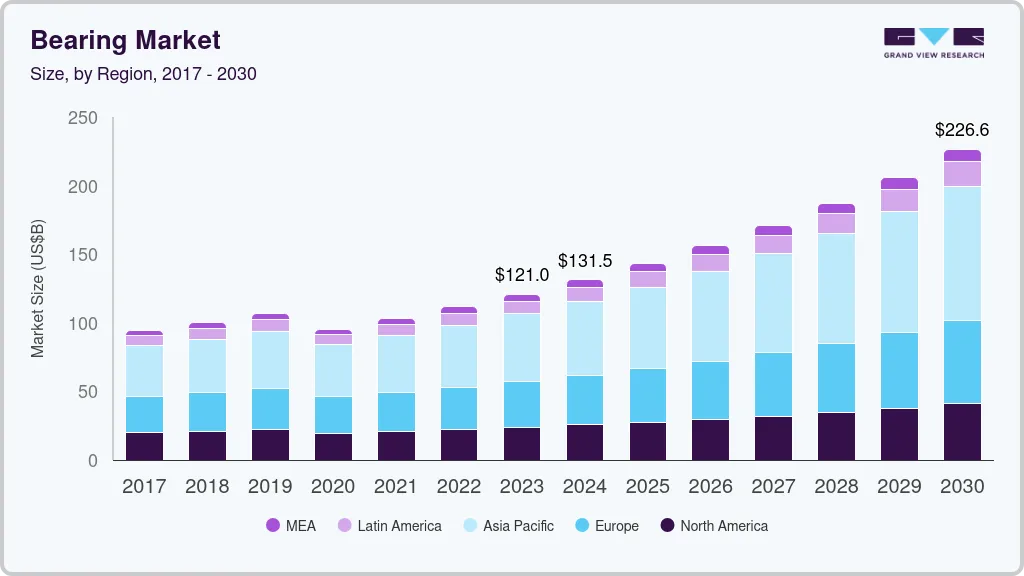
The global bearing market size was valued at USD 120.98 billion in 2023 and is expected to grow at a compound annual growth rate (CAGR) of 9.5% from 2024 to 2030. Bearings are virtually used in every kind of equipment or machinery, ranging from automobile parts, farm equipment, and household appliances to defense and aerospace equipment. This factor is projected to drive the market in the near future. There has been a rising demand for bearings with lower maintenance requirements, higher efficiency, and longer service life. Moreover, a rise in demand for specialized bearing solutions that meet different industry-specific requirements and challenges is projected to boost the market. For instance, the rising application of high-capacity products in wind turbines is expected to catapult the demand. Wind turbines utilize these products to enhance turbine performance and reliability, increase energy production, and reduce lubricant consumption.
Manufacturers constantly work on improving product designs to increase performance and energy efficiency. They use a special material for raceways, cages, and rolling elements as well as redesigned raceway profiles. Furthermore, technological advancements in seal and lubrication technologies and the use of lightweight materials in high-performance products are generating huge prospects for manufacturers. Integration of electro-mechanical features directly into the bearings helps in performance improvement and reductions in size and cost.
Rising demand for high-performance bearings has resulted in manufacturers integrating advanced sensor units in their products. The sensor units assist in the digital monitoring of axial movement, deceleration, acceleration, rotation speed, and load-carrying capacity of the product. Additionally, the advent of the Agricultural Internet of Things (IoT) has encouraged the adoption and constant monitoring of connected equipment and machinery. This trend has also influenced the market positively.
A few key suppliers have started providing smart bearings, whose conditions can be constantly monitored to predict faults before they occur. The adoption of these products is still in the nascent stage. Several other major manufacturers are likely to offer in their portfolios in the near future. As it is easy to predict the faults in smart bearings before they occur, they add considerable value by reducing the cost of unexpected downtime, which is projected to surge the espousal of these products during the forecast period.
The coronavirus pandemic has had a significant impact on the market, with many manufacturing companies facing adverse effects of lockdown situations in major economies such as China and Japan, among several others. The automotive industry, which is the largest consumer of bearing among all the other industries, witnessed a substantial reduction in vehicle production, primarily owing to supply chain disruptions and restrictions on the movement of people. However, the conditions improved in the later quarters of 2020 with gradual upliftment of restrictions and subsequent increases in production activities. Moreover, the rollout of the coronavirus vaccine across the globe is further anticipated to strengthen the market growth over the forecast period.
The bearing market manifests characteristics indicative of fragmentation, with a diverse array of players catering to its demands across various industries, including automotive, aerospace, industrial machinery, and renewable energy. Unlike a concentrated market, this landscape is marked by the presence of numerous entities, each contributing to a fragmented competitive environment. This scenario results in intensified competition and a proliferation of niche offerings as companies seek to carve out their market niches.
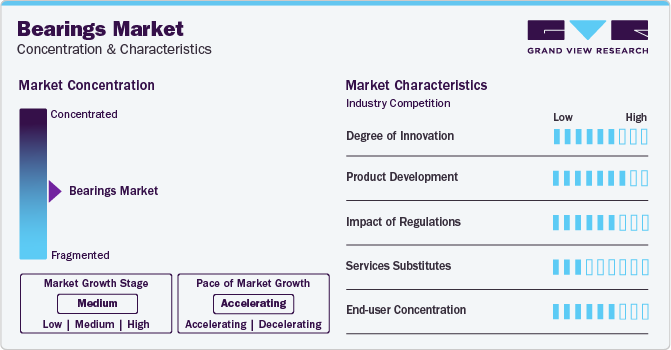
The presence of numerous players also fosters innovation, with companies vying to distinguish themselves through specialized products and tailored solutions. Despite the fragmentation, strategic collaborations and mergers are not uncommon as participants seek synergies to enhance their market position. The impact of globalization on competition remains significant, prompting market participants to navigate complex international dynamics.
Technological advancements, particularly the integration of intelligent features for condition monitoring, underscore the adaptability of fragmented players to embrace innovation. Regulatory compliance and stringent adherence to quality standards persist as paramount considerations, given the pivotal role of bearings in ensuring safety and optimal machinery performance within this diverse and dynamic market.
The bearing industry exhibits a moderate degree of innovation, primarily driven by advancements in materials and manufacturing processes. Integration of smart technologies, such as sensor-equipped bearings for condition monitoring, has also contributed to incremental innovation.
Ongoing product development focuses on enhancing bearing performance, durability, and efficiency. Manufacturers are investing in R&D to introduce bearings tailored for specific applications, such as high-speed machinery or extreme environmental conditions, aligning with market demands for specialized solutions.
The bearing industry is subject to global quality standards and regulatory requirements, ensuring compliance with specifications related to safety, durability, and environmental impact. Adherence to these regulations is integral for market access and maintaining a competitive edge.
While there are limited direct substitutes for bearings in many applications, the rise of predictive maintenance services and condition monitoring technologies poses a potential alternative approach for ensuring equipment reliability, impacting the traditional aftermarket bearing replacement market.
The bearing market exhibits a diverse end-user concentration, with significant demand stemming from sectors like automotive, industrial machinery, and aerospace. Manufacturers often tailor their offerings to meet the specific requirements and performance standards of key end-user industries, contributing to market segmentation strategies.
Based on product, the bearings market is segmented into ball, roller, plain bearing, and others. The roller bearings segment accounted for the largest revenue share of more than 45% in 2023. The segment is also estimated to continue its supremacy and emerge as the fastest-growing segment in the coming years. These products reduce rotational friction, support radial and axial loads, and can sustain limited axial loads and heavy radial loads more efficiently than their counterparts. The widespread espousal of roller bearings by several industries, such as capital equipment, automobiles, home appliances, and aerospace, is estimated to positively impact product demand.
The report also covers the ball and other bearings. Ball bearings have a smaller surface contact and, therefore, help to reduce friction to a great extent. They can also be used with thrust and radial loadings, ascribed to which, these products are increasingly being used in both four and two-wheeled automobiles. Hence the segment is anticipated to witness healthy growth over the forecast period.
Plain bearings, also known as sleeve bearings, are the most preliminary type of bearings with no rolling components. They are used for sliding, oscillating, rotating, and reciprocating motions. In sliding applications, they are used as bearing strips, slide bearings, and wear plates. Due to greater contact area and conformability, plain bearings offer greater resistance to high shock loads and load capacity as compared to roller bearings. Such benefits offered over their counterparts make plain bearing a preferred option in applications where greater resistance to damage from oscillatory movements is requisite. The demand for plain bearings is expected to register a steady growth rate over the forecast period.
In 2023, the automotive segment dominated the market and accounted for 49.0% of the market share. The high share of this segment can be attributed to high automotive production, globally. Also, the demand for vehicles with technologically advanced solutions is escalating, thus leading to a rise in vehicle manufacturing that necessitates instrumented products. The growth in demand for highly advanced vehicles and the subsequent increase in the capabilities of the vehicles has escalated the demand for bearing in the automotive industry. Additionally, the automotive aftermarket segment is also anticipated to boost at a subsequently higher CAGR over the forecast period, thereby further bolstering the demand for bearings.
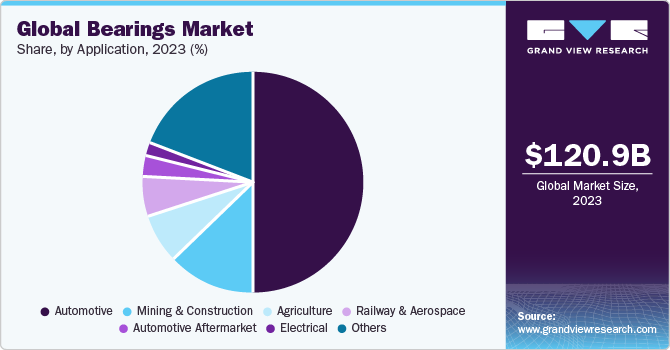
The railway and aerospace segment is anticipated to emerge as the fastest-growing segment by 2030. This growth can be attributed to growing interest in travel activities, the growing need to renew aging fleets owing to stringent environmental legislation, and fuel price pressure coupled with the availability of improved ways to assist global and local transportation systems. Demand from the railway segment is also anticipated to rise on account of accelerated railway construction in developing countries. Further, surging demand for small single-aisle aircraft and helicopters from emerging economies is anticipated to further drive the growth of the segment.
Asia Pacific dominated the market and accounted for a revenue share of 40.0% in 2023. The region is also anticipated to witness the fastest growth in terms of revenue, accounting for over USD 98.20 billion by 2030. China is one of the major markets, and sale in the country is expected to catapult over the foreseeable years stimulated by the rapid expansion of machinery and motor vehicle production coupled with a strong aftermarket for industrial equipment and motor vehicle repair. Moreover, the robust construction and mining equipment market in India is estimated to facilitate market growth through 2030.
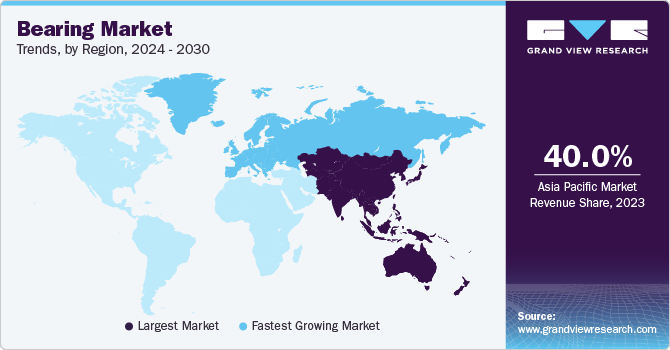
In Europe, the market is anticipated to witness favorable growth during the forecast period, owing to sustainable economic growth and increased investment. Furthermore, in the mature markets of the U.S., Western Europe, and Japan, the demand is driven by the rebounding production of motor vehicles and a healthy fixed investment environment. Increased sales of high-value bearings, such as large-diameter, custom-built used in heavy machinery and wind turbines, are also expected to drive the market in North America. In the Middle East and Africa, the rapid development of city infrastructures is positively influencing overall growth.
Bearing Market in the UK accounted for a revenue share of 9.93% in the Western European market. One reason for the upward trajectory of the bearing market in the U.K. could be increased industrial activity and infrastructure development projects, leading to higher demand for bearings.
The bearing Market in France accounted for a revenue share of 18.40% in the Western European market. The revenue share can be attributed to the enhanced focus on renewable energy projects and advancements in automotive manufacturing, driving demand for bearings in wind turbines, electric vehicles, and machinery.
The bearing Market in Germany accounted for a revenue share of 29.89% in the Western European market. The revenue share can be attributed to the strong growth in the machinery and automotive industries, fueled by technological innovation and export demand, resulting in increased demand for bearings as key components in machinery and vehicles.
The bearing market in China accounted for a revenue share of 53.75% in the Asia Pacific market. The revenue share can be attributed to the rapid urbanization, industrialization, and infrastructure development initiatives, leading to robust demand for bearings in construction machinery, automotive manufacturing, and industrial equipment.
The bearing market in India accounted for a revenue share of 9.39% in the Asia Pacific market. The revenue share can be attributed to the growth in manufacturing, construction, and infrastructure sectors, propelled by government initiatives such as "Make in India" and investments in transportation and renewable energy projects, boosting demand for bearings.
The bearing market in Japan accounted for a revenue share of 19.74% in the Asia Pacific market. The revenue share can be attributed to technological innovation and automation in the manufacturing processes, coupled with growth in automotive and electronics industries, driving demand for high-precision bearings for robotics, machinery, and precision equipment.
The bearing market in Brazil accounted for a revenue share of 54.99% in the Latin America market. The revenue share can be attributed to the recovery in the automotive and industrial sectors, supported by economic reforms and investments in infrastructure, leading to increased demand for bearings in vehicle production and industrial machinery.
The growth of the bearing market in KSA can be attributed to the diversification efforts beyond oil-dependent industries, with investments in sectors such as manufacturing, construction, and transportation stimulating demand for bearings in machinery, automotive, and infrastructure projects
Some of the key players operating in the market include JTEKT Corporation and SKF, among others.
JTEKT Corporation operates as a manufacturer and distributor of various products, including home accessory equipment, bearings, driveline components, electronic control devices, machine tools, and steering systems. The company was formed through the merger of Toyoda Machine Works, specializing in machine tools, and Koyo Seiko Co., a provider of bearings, steering systems, home accessory equipment, driveline components, and electronic control devices. Bearing products are marketed under the Koyo brand, which originated from Koyo Seiko Co., Ltd.
SKF provides products and solutions such as bearings and units, mechatronics systems, seals, services, as well as lubrication systems. The company conducts its business activities through two segments, namely Automotive and Industrial. Through the Automotive segment, the company manufactures cars, light and heavy trucks, buses, trailers, and two-wheelers with customized seals, bearings, and other related products.
Schaeffler AG, and The Timken Company. are some of the emerging market participants in the target market.
.Schaeffler AG develops, manufactures, and supplies components and systems for automotive and industrial applications. The company operates through three business divisions: Automotive O.E.M., Automotive Aftermarket, and Industrial. The Automotive O.E.M. business division is further classified into: Engine Systems, E-Mobility, Chassis Systems, and Transmission Systems. The Chassis Systems sub-division develops systems and components such as wheel bearings.
The Timken Company designs and manages a portfolio of engineered bearings and power transmission products and services. The company operates through two reportable segments: Mobile Industries and Process Industries. The company offers a portfolio of under-engineered bearing products, including tapered, spherical, cylindrical roller bearings, thrust, and ball bearings. The company caters to sectors including industrial distribution, general industrial, mining, construction, agriculture, rail, aerospace and defense, automotive, heavy truck, metals, and energy
The following are the leading companies in the bearing market. These companies collectively hold the largest market share and dictate industry trends. Financials, strategy maps & products of these bearing companies are analyzed to map the supply network.
In September 2023, Schaeffler AG strategically diversified its product portfolio by introducing new offerings in rotary table bearings, torque motors, and linear motors. This expansion includes the introduction of various sizes for rotary table and rotary axis bearings, complemented by the incorporation of bearing-integrated angular measuring systems. The standardization of torque motors within the RKIB series, now available up to size 690, further strengthens the company's capability to offer a comprehensive range of top-tier solutions.
In November 2023, The Timken Company successfully concluded the acquisition of Engineered Solutions Group, also recognized as Innovative Mechanical Solutions or iMECH. Specializing in the production of, radial bearings, specialty coatings, thrust bearings and other components primarily tailored for the energy industry, iMECH operates with a workforce of around 70 professionals. The business foresees generating revenue of approximately USD 30 million for the calendar year 2023. This strategic acquisition is instrumental in enhancing the company’s standing as a provider of comprehensive solutions within the industrial motion and engineered bearings sector.
Report Attribute |
Details |
Market size value in 2023 |
USD 120.98 billion |
Revenue forecast in 2030 |
USD 226.60 billion |
Growth rate |
CAGR of 9.5% from 2024 to 2030 |
Actual Data |
2017 - 2023 |
Forecast period |
2024 - 2030 |
Historical Data |
2017 - 2022 |
Quantitative units |
Revenue in USD billion, and CAGR from 2024 to 2030 |
Report Coverage |
Revenue forecast, company ranking, competitive landscape, growth factors, and trends |
Segments Covered |
Product, application, region |
Regional scope |
North America, Europe, Asia Pacific, Latin America, and Middle East & Africa |
Country scope |
U.S.; Canada; Western Europe (UK; Germany; France; Italy) Eastern Europe (Russia); China; India; Japan; Brazil; Mexico, KSA, UAE, and South Africa |
Key companies profiled |
Rubix, Harbin Bearing Manufacturing Co., Ltd., HKT Bearings Ltd., JTEKT Corporation, NBI Group, NSK Ltd, NTN Corporation, RBC Bearings Incorporated., Regal Rexnord Corporation, Schaeffler AG, SKF, The Timken Company |
Customization scope |
Free report customization (equivalent up to 8 analysts working days) with purchase. Addition or alteration to country, regional & segment scope. |
Pricing and purchase options |
Avail customized purchase options to meet your exact research needs. Explore purchase options |
This report forecasts revenue growth at global, regional, and country levels and provides an analysis of the latest industry trends in each of the sub-segments from 2017 to 2030. For this study, Grand View Research has segmented the global bearing market report based on product, application, and region:
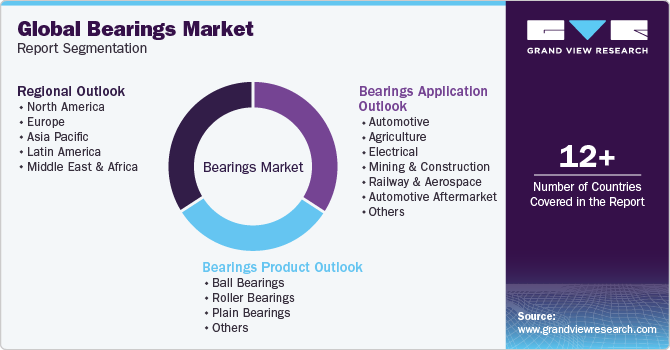
Product Outlook (Revenue, USD Billion; 2017 - 2030)
Ball Bearings
Deep Groove Bearings
Others
Roller Bearings
Split
Tapered
Others
Plain Bearings
Journal Plain Bearings
Linear Plain Bearings
Thrust Plain Bearings
Others
Others
Application Outlook (Revenue, USD Billion; 2017 - 2030)
Automotive
Agriculture
Electrical
Mining & Construction
Railway & Aerospace
Automotive Aftermarket
Others
Regional Outlook (Revenue, USD Billion; 2017 - 2030)
North America
U.S.
Canada
Europe
Western Europe
U.K.
Germany
France
Italy
Eastern Europe
Russia
Asia Pacific
China
India
Japan
Latin America
Brazil
Mexico
Middle East & Africa
KSA
UAE
South Africa
b. The global bearing market size was estimated at USD 111.59 billion in 2022 and is expected to reach USD 120.98 billion in 2023.
b. The global bearing market is expected to advance at a compound annual growth rate of 10.6% from 2023 to 2030 to reach USD 226.6 billion by 2030.
b. The roller bearings segment dominated the global market and accounted for the largest revenue share of more than 47.37% in 2022. Further, this segment is also anticipated to continue its dominance and emerge as the fastest-growing segment by 2030.
b. The automotive segment dominated the bearing market and held the largest revenue share of approximately 49.72% in 2022. The substantial share of this segment can be attributed to high automotive production globally.
b. The Asia Pacific dominated the bearing market and accounted for the largest revenue share of 40.42% in 2022. The region is projected to observe the fastest growth in terms of revenue, accounting for over USD 98.68 billion by 2030.
Table of Contents
Chapter 1. Bearing Market: Methodology and Scope
1.1. Market Segmentation
1.2. Report Scope and Assumptions
1.3. Research Methodology
1.3.1. Bottom-Up Approach
1.3.2. Top-Down Approach
1.4. Research Assumptions
1.5. List of Data Sources
Chapter 2. Bearing Market: Executive Summary
2.1. Market Summary
2.2. Bearings- Industry Snapshot & Key Buying Criteria, 2017 - 2030
2.3. Bearings Market - Market Outlook
2.4. Bearings Market - Segmental Outlook
2.5. Global Bearings Market, 2017 - 2030
Chapter 3. Bearing Market: Variables, Trends & Scope
3.1. Market Introduction/Lineage Outlook
3.2. Bearings Market Value Chain
3.3. Market Dynamics
3.3.1. Market driver analysis
3.3.1.1. Increased application of high capacity bearings in wind turbines
3.3.1.2. Increasing demand for bearings in energy-efficient vehicles
3.3.1.3. Growing demand in railway, aerospace and other applications
3.3.1.4. Rapidly Increasing EV Sales
3.3.2. Market challenges/restraint analysis
3.3.2.1. Counterfeit products
3.3.2.2. Increasing raw material prices
3.3.3. Market opportunity analysis
3.3.3.1. Integration of electro-mechanical features into bearings for medical applications
3.4. Bearing Market Analysis Tools
3.4.1. Porter’s Analysis
3.4.1.1. Bargaining power of the suppliers
3.4.1.2. Bargaining power of the buyers
3.4.1.3. Threats of substitution
3.4.1.4. Threats from new entrants
3.4.1.5. Competitive rivalry
3.5. PESTEL Analysis
3.5.1. Political landscape
3.5.1.1. Economic and Social landscape
3.5.1.2. Technological landscape
3.5.1.3. Environmental landscape
3.5.1.4. Legal landscape
3.6. Use Case Analysis by Application Vertical in Bearing Market
Chapter 4. Bearings Market: Product Estimates & Trend Analysis
4.1. Bearings Market: Product Share Analysis, 2017 - 2030
4.1.1. Ball Bearings
4.1.1.1. Deep Groove Bearings
4.1.1.2. Others
4.1.2. Roller Bearings
4.1.2.1. Split
4.1.2.2. Tapered
4.1.2.3. Others
4.1.3. Plain Bearings
4.1.3.1. Journal Plain Bearings
4.1.3.2. Linear Plain Bearings
4.1.3.3. Thrust Plain Bearings
4.1.3.4. Others
4.1.4. Others
Chapter 5. Bearings Market: Application Estimates & Trend Analysis
5.1. Bearings Market: Application Share Analysis, 2017 - 2030
5.1.1. Automotive
5.1.2. Agriculture
5.1.3. Electrical
5.1.4. Mining and Construction
5.1.5. Railway & Aerospace
5.1.6. Automotive & Aftermarket
Chapter 6. Bearings Market: Regional Estimates & Trend Analysis
6.1. Bearings Market Share By Region, 2023 & 2030
6.2. North America
6.2.1. Bearings market by product, 2017 - 2030 (USD Billion)
6.2.2. Bearings market by application, 2017 - 2030 (USD Billion)
6.2.3. U.S.
6.2.3.1. Bearings market by product, 2017 - 2030 (USD Billion)
6.2.3.2. Bearings market by application 2017 - 2030 (USD Billion)
6.2.4. Canada
6.2.4.1. Bearings market by product, 2017 - 2030 (USD Billion)
6.2.4.2. Bearings market by application 2017 - 2030 (USD Billion)
6.3. Europe
6.3.1. Bearings market by product, 2017 - 2030 (USD Billion)
6.3.2. Bearings market by application, 2017 - 2030 (USD Billion)
6.3.3. Western Europe
6.3.3.1. Bearings market by product, 2017 - 2030 (USD Billion)
6.3.3.2. Bearings market by application 2017 - 2030 (USD Billion)
6.3.3.3. U.K.
6.3.3.3.1. Bearings market by product, 2017 - 2030 (USD Billion)
6.3.3.3.2. Bearings market by application 2017 - 2030 (USD Billion)
6.3.3.4. Germany
6.3.3.4.1. Bearings market by product, 2017 - 2030 (USD Billion)
6.3.3.4.2. Bearings market by application 2017 - 2030 (USD Billion)
6.3.3.5. France
6.3.3.5.1. Bearings market by product, 2017 - 2030 (USD Billion)
6.3.3.5.2. Bearings market by application 2017 - 2030 (USD Billion)
6.3.3.6. Italy
6.3.3.6.1. Bearings market by product, 2017 - 2030 (USD Billion)
6.3.3.6.2. Bearings market by application 2017 - 2030 (USD Billion)
6.3.4. Eastern Europe
6.3.4.1. Bearings market by product, 2017 - 2030 (USD Billion)
6.3.4.2. Bearings market by application 2017 - 2030 (USD Billion)
6.3.4.3. Russia
6.3.4.3.1. Bearings market by product, 2017 - 2030 (USD Billion)
6.3.4.3.2. Bearings market by application 2017 - 2030 (USD Billion)
6.4. Asia Pacific
6.4.1. Bearings market by product, 2017 - 2030 (USD Billion)
6.4.2. Bearings market by application, 2017 - 2030 (USD Billion)
6.4.3. China
6.4.3.1. Bearings market by product, 2017 - 2030 (USD Billion)
6.4.3.2. Bearings market by application 2017 - 2030 (USD Billion)
6.4.4. India
6.4.4.1. Bearings market by product, 2017 - 2030 (USD Billion)
6.4.4.2. Bearings market by application 2017 - 2030 (USD Billion)
6.4.5. Japan
6.4.5.1. Bearings market by product, 2017 - 2030 (USD Billion)
6.4.5.2. Bearings market by application 2017 - 2030 (USD Billion)
6.5. Latin America
6.5.1. Bearings market by product, 2017 - 2030 (USD Billion)
6.5.2. Bearings market by application, 2017 - 2030 (USD Billion)
6.5.3. Brazil
6.5.3.1. Bearings market by product, 2017 - 2030 (USD Billion)
6.5.3.2. Bearings market by application 2017 - 2030 (USD Billion)
6.5.4. Mexico
6.5.4.1. Bearings market by product, 2017 - 2030 (USD Billion)
6.5.4.2. Bearings market by application 2017 - 2030 (USD Billion)
6.6. Middle East and Africa (MEA)
6.6.1. Bearings market by product, 2017 - 2030 (USD Billion)
6.6.2. Bearings market by application, 2017 - 2030 (USD Billion)
6.6.3. KSA
6.6.3.1. Bearings market by product, 2017 - 2030 (USD Billion)
6.6.3.2. Bearings market by application 2017 - 2030 (USD Billion)
6.6.4. UAE
6.6.4.1. Bearings market by product, 2017 - 2030 (USD Billion)
6.6.4.2. Bearings market by application 2017 - 2030 (USD Billion)
6.6.5. South Africa
6.6.5.1. Bearings market by product, 2017 - 2030 (USD Billion)
6.6.5.2. Bearings market by application 2017 - 2030 (USD Billion)
Chapter 7. Competitive Landscape
7.1. Brammer PLC
7.1.1. Company Overview
7.1.2. Product Benchmarking
7.2. HARBIN BEARING MANUFACTURING CO., LTD.
7.2.1. Company Overview
7.2.2. Product Benchmarking
7.3. HKT BEARINGS LIMITED
7.3.1. Company Overview
7.3.2. Product Benchmarking
7.4. NBI Bearings Europe, S.A.
7.4.1. Company Overview
7.4.2. Product Benchmarking
7.5. JTEKT CORPORATION
7.5.1. Company Overview
7.5.2. Financial performance
7.5.3. Product Benchmarking
7.5.4. Strategic Initiatives
7.6. NSK Ltd.
7.6.1. Company Overview
7.6.2. Financial performance
7.6.3. Product Benchmarking
7.6.4. Strategic Initiatives
7.7. NTN Bearing Corporation
7.7.1. Company Overview
7.7.2. Financial performance
7.7.3. Product Benchmarking
7.7.4. Strategic Initiatives
7.8. RBC BEARINGS INC
7.8.1. Company Overview
7.8.2. Financial performance
7.8.3. Product Benchmarking
7.8.4. Strategic Initiatives
7.9. Zurn Water Solutions Corporation
7.9.1. Company Overview
7.9.2. Product Benchmarking
7.9.3. Recent developments
7.9.4. Strategic Initiatives
7.10. Schaeffler AG
7.10.1. Company Overview
7.10.2. Financial performance
7.10.3. Product Benchmarking
7.10.4. Strategic Initiatives
7.11. SKF
7.11.1. Company Overview
7.11.2. Financial performance
7.11.3. Product Benchmarking
7.11.4. Strategic Initiatives
7.12. The Timken Company
7.12.1. Company Overview
7.12.2. Product Benchmarking
7.12.3. Strategic Initiatives
List of Tables
Table 1 Global bearings market, 2017 - 2030 (USD Billion)
Table 2 Global bearings market by region, 2017 - 2030 (USD Billion)
Table 3 Global bearings market by product, 2017 - 2030 (USD Billion)
Table 4 Global roller bearings market by product, 2017 - 2030 (USD Billion)
Table 5 Global ball bearings market by product, 2017 - 2030 (USD Billion)
Table 6 Global plain bearings market by product, 2017 - 2030 (USD Billion)
Table 7 Global bearings market by applications, 2017 - 2030 (USD Billion)
Table 8 Global ball bearings market by product, 2017 - 2030 (USD Billion)
Table 9 Ball bearings market by region, 2017 - 2030 (USD Billion)
Table 10 Global ball bearings market, 2017 - 2030 (USD Billion)
Table 11 Deep groove bearings market by region, 2017 - 2030 (USD Billion)
Table 12 Other ball bearings market by region, 2017 - 2030 (USD Billion)
Table 13 Roller bearings market by region, 2017 - 2030 (USD Billion)
Table 14 Global roller bearings market, 2017 - 2030 (USD Billion)
Table 15 Split Roller bearings market by region, 2017 - 2030 (USD Billion)
Table 16 Tapered Roller bearings market by region, 2017 - 2030 (USD Billion)
Table 17 Other Roller bearings market by region, 2017 - 2030 (USD Billion)
Table 18 Plain bearings market by region, 2017 - 2030 (USD Billion)
Table 19 Global plain bearings market, 2017 - 2030 (USD Billion)
Table 20 Journal Plain bearings market by region, 2017 - 2030 (USD Billion)
Table 21 Linear Plain bearings market by region, 2017 - 2030 (USD Billion)
Table 22 Thrust Plain bearings market by region, 2017 - 2030 (USD Billion)
Table 23 Other Plain bearings market by region, 2017 - 2030 (USD Billion)
Table 24 Global bearings market by application, 2017 - 2030 (USD Billion)
Table 26 Automotive bearings market by region, 2017 - 2030 (USD Billion)
Table 28 Agriculture bearings market by region, 2017 - 2030 (USD Billion)
Table 30 Electrical bearings market by region, 2017 - 2030 (USD Billion)
Table 32 Mining & Construction bearings market by region, 2017 - 2030 (USD Billion)
Table 34 Railway & Aerospace bearings market by region, 2017 - 2030 (USD Billion)
Table 35 Automotive aftermarket bearings market by region, 2017 - 2030 (USD Billion)
Table 36 North America bearings market by country, 2017 - 2030 (USD Billion)
Table 37 North America bearings market by product, 2017 - 2030 (USD Billion)
Table 38 North America roller bearings market by product, 2017 - 2030 (USD Billion)
Table 39 North America ball bearings market by product, 2017 - 2030 (USD Billion)
Table 40 North America plain bearings market by product, 2017 - 2030 (USD Billion)
Table 41 North America bearings market by application, 2017 - 2030 (USD Billion)
Table 47 U.S bearings market by product, 2017 - 2030 (USD Billion)
Table 48 U.S. roller bearings market by product, 2017 - 2030 (USD Billion)
Table 49 U.S. ball bearings market by product, 2017 - 2030 (USD Billion)
Table 50 U.S. plain bearings market by product, 2017 - 2030 (USD Billion)
Table 51 U.S bearings market by application, 2017 - 2030 (USD Billion)
Table 52 Canada bearings market by product, 2017 - 2030 (USD Billion)
Table 53 Canada roller bearings market by product, 2017 - 2030 (USD Billion)
Table 54 Canada ball bearings market by product, 2017 - 2030 (USD Billion)
Table 55 Canada plain bearings market by product, 2017 - 2030 (USD Billion)
Table 56 Canada bearings market by application, 2017 - 2030 (USD Billion)
Table 57 Europe bearings market by region, 2017 - 2030 (USD Billion)
Table 58 Europe bearings market by product, 2017 - 2030 (USD Billion)
Table 59 Europe roller bearings market by product, 2017 - 2030 (USD Billion)
Table 60 Europe ball bearings market by product, 2017 - 2030 (USD Billion)
Table 61 Europe plain bearings market by product, 2017 - 2030 (USD Billion)
Table 62 Europe bearings market by application, 2017 - 2030 (USD Billion)
Table 68 Western Europe bearings market by country, 2017 - 2030 (USD Billion)
Table 69 Western Europe bearings market by product, 2017 - 2030 (USD Billion)
Table 70 Western Europe roller bearings market by product, 2017 - 2030 (USD Billion)
Table 71 Western Europe ball bearings market by product, 2017 - 2030 (USD Billion)
Table 72 Western Europe plain bearings market by product, 2017 - 2030 (USD Billion)
Table 73 Western Europe bearings market by application, 2017 - 2030 (USD Billion)
Table 74 U.K. bearings market by product, 2017 - 2030 (USD Billion)
Table 75 U.K. roller bearings market by product, 2017 - 2030 (USD Billion)
Table 76 U.K. ball bearings market by product, 2017 - 2030 (USD Billion)
Table 77 U.K. plain bearings market by product, 2017 - 2030 (USD Billion)
Table 78 U.K. bearings market by application, 2017 - 2030 (USD Billion)
Table 79 Germany bearings market by product, 2017 - 2030 (USD Billion)
Table 80 Germany roller bearings market by product, 2017 - 2030 (USD Billion)
Table 81 Germany ball bearings market by product, 2017 - 2030 (USD Billion)
Table 82 Germany plain bearings market by product, 2017 - 2030 (USD Billion)
Table 83 Germany bearings market by application, 2017 - 2030 (USD Billion)
Table 84 France roller bearings market by product, 2017 - 2030 (USD Billion)
Table 85 France ball bearings market by product, 2017 - 2030 (USD Billion)
Table 86 France plain bearings market by product, 2017 - 2030 (USD Billion)
Table 87 France bearings market by application, 2017 - 2030 (USD Billion)
Table 88 Italy roller bearings market by product, 2017 - 2030 (USD Billion)
Table 89 Italy ball bearings market by product, 2017 - 2030 (USD Billion)
Table 90 Italy plain bearings market by product, 2017 - 2030 (USD Billion)
Table 91 Italy bearings market by application, 2017 - 2030 (USD Billion)
Table 92 Eastern Europe bearings market by country, 2017 - 2030 (USD Billion)
Table 93 Eastern Europe bearings market by product, 2017 - 2030 (USD Billion)
Table 94 Eastern Europe roller bearings market by product, 2017 - 2030 (USD Billion)
Table 95 Eastern Europe ball bearings market by product, 2017 - 2030 (USD Billion)
Table 96 Eastern Europe plain bearings market by product, 2017 - 2030 (USD Billion)
Table 97 Eastern Europe bearings market by application, 2017 - 2030 (USD Billion)
Table 98 Russia roller bearings market by product, 2017 - 2030 (USD Billion)
Table 99 Russia ball bearings market by product, 2017 - 2030 (USD Billion)
Table 100 Russia plain bearings market by product, 2017 - 2030 (USD Billion)
Table 101 Russia bearings market by application, 2017 - 2030 (USD Billion)
Table 102 Asia Pacific bearings market by country, 2017 - 2030 (USD Billion)
Table 103 Asia Pacific bearings market by product, 2017 - 2030 (USD Billion)
Table 104 Asia Pacific roller bearings market by product, 2017 - 2030 (USD Billion)
Table 105 Asia Pacific ball bearings market by product, 2017 - 2030 (USD Billion)
Table 106 Asia Pacific plain bearings market by product, 2017 - 2030 (USD Billion)
Table 107 Asia Pacific bearings market by application, 2017 - 2030 (USD Billion)
Table 108 China bearings market by product, 2017 - 2030 (USD Billion)
Table 109 China roller bearings market by product, 2017 - 2030 (USD Billion)
Table 110 China ball bearings market by product, 2017 - 2030 (USD Billion)
Table 111 China plain bearings market by product, 2017 - 2030 (USD Billion)
Table 112 China bearings market by application, 2017 - 2030 (USD Billion)
Table 113 Japan bearings market by product, 2017 - 2030 (USD Billion)
Table 114 Japan roller bearings market by product, 2017 - 2030 (USD Billion)
Table 115 Japan ball bearings market by product, 2017 - 2030 (USD Billion)
Table 116 Japan plain bearings market by product, 2017 - 2030 (USD Billion)
Table 117 Japan bearings market by application, 2017 - 2030 (USD Billion)
Table 118 India bearings market by product, 2017 - 2030 (USD Billion)
Table 119 India roller bearings market by product, 2017 - 2030 (USD Billion)
Table 120 India ball bearings market by product, 2017 - 2030 (USD Billion)
Table 121 India plain bearings market by product, 2017 - 2030 (USD Billion)
Table 122 India bearings market by application, 2017 - 2030 (USD Billion)
Table 123 Latin America bearings market by country, 2017 - 2030 (USD Billion)
Table 124 Latin America bearings market by product, 2017 - 2030 (USD Billion)
Table 125 Latin America roller bearings market by product, 2017 - 2030 (USD Billion)
Table 126 Latin America ball bearings market by product, 2017 - 2030 (USD Billion)
Table 127 Latin America plain bearings market by product, 2017 - 2030 (USD Billion)
Table 128 Latin America bearings market by application, 2017 - 2030 (USD Billion)
Table 129 Brazil bearings market by product, 2017 - 2030 (USD Billion)
Table 130 Brazil roller bearings market by product, 2017 - 2030 (USD Billion)
Table 131 Brazil ball bearings market by product, 2017 - 2030 (USD Billion)
Table 132 Brazil plain bearings market by product, 2017 - 2030 (USD Billion)
Table 133 Brazil bearings market by application, 2017 - 2030 (USD Billion)
Table 134 Mexico bearings market by product, 2017 - 2030 (USD Billion)
Table 135 Mexico roller bearings market by product, 2017 - 2030 (USD Billion)
Table 136 Mexico ball bearings market by product, 2017 - 2030 (USD Billion)
Table 137 Mexico plain bearings market by product, 2017 - 2030 (USD Billion)
Table 138 Mexico bearings market by application, 2017 - 2030 (USD Billion)
Table 139 Middle East & Africa bearings market by product, 2017 - 2030 (USD Billion)
Table 140 Middle East & Africa roller bearings market by product, 2017 - 2030 (USD Billion)
Table 141 Middle East & Africa ball bearings market by product, 2017 - 2030 (USD Billion)
Table 142 Middle East & Africa ball bearings market by product, 2017 - 2030 (USD Billion)
Table 143 Middle East & Africa bearings market by application, 2017 - 2030 (USD Billion)
Table 144 KSA bearings market by product, 2017 - 2030 (USD Billion)
Table 145 KSA roller bearings market by product, 2017 - 2030 (USD Billion)
Table 146 KSA ball bearings market by product, 2017 - 2030 (USD Billion)
Table 147 KSA plain bearings market by product, 2017 - 2030 (USD Billion)
Table 148 KSA bearings market by application, 2017 - 2030 (USD Billion)
Table 147 UAE bearings market by product, 2017 - 2030 (USD Billion)
Table 148 UAE roller bearings market by product, 2017 - 2030 (USD Billion)
Table 149 UAE ball bearings market by product, 2017 - 2030 (USD Billion)
Table 150 UAE plain bearings market by product, 2017 - 2030 (USD Billion)
Table 151 UAE bearings market by application, 2017 - 2030 (USD Billion)
Table 152 South Africa bearings market by product, 2017 - 2030 (USD Billion)
Table 153 South Africa roller bearings market by product, 2017 - 2030 (USD Billion)
Table 154 South Africa ball bearings market by product, 2017 - 2030 (USD Billion)
Table 155 South Africa plain bearings market by product, 2017 - 2030 (USD Billion)
Table 152 South Africa bearings market by application, 2017 - 2030 (USD Billion)
Table 153 Company categorization
List of Figures
Fig. 1 Bearing Market segmentation
Fig. 2 Information procurement
Fig. 3 Data analysis models
Fig. 4 Market formulation and validation
Fig. 5 Data validating & publishing
Fig. 6 Market snapshot
Fig. 7 Segment snapshot, by Product
Fig. 8 Segment snapshot By Application
Fig. 9 Competitive landscape snapshot
Fig. 10 Bearing Market value, 2017–2030 (USD Billion)
Fig. 11 Bearing Market - Industry value chain analysis
Fig. 12 Bearing Market - Market trends
Fig. 13 Bearing Market: Porter’s analysis
Fig. 14 Bearing Market: PESTEL analysis
Fig. 15 Bearing Market, by Product: Key takeaways
Fig. 16 Bearing Market, by Product: Market share, 2023 & 2030
Fig. 17 Ball Bearing, Bearing Market estimates & forecasts, 2017 - 2030 (USD Billion)
Fig. 18 Roller Bearing, Bearing Market estimates & forecasts, 2017 - 2030 (USD Billion)
Fig. 19 Bearing Market, by Application: Key takeaways
Fig. 20 Bearing Market, by Application: Market share, 2023 & 2030
Fig. 21 Automotive Bearing Market estimates & forecasts, 2017 - 2030 (USD Billion)
Fig. 22 Agriculture Bearing Market estimates & forecasts, 2017 - 2030 (USD Billion)
Fig. 23 Electrical Bearing Market estimates & forecasts, 2017 - 2030 (USD Billion)
Fig. 24 Mining & Construction Bearing Market estimates & forecasts, 2017 - 2030 (USD Billion)
Fig. 25 Railway & Aerospace Bearing Market estimates & forecasts, 2017 - 2030 (USD Billion)
Fig. 26 Automotive Aftermarket Bearing Market estimates & forecasts, 2017 - 2030 (USD Billion)
Fig. 27 Others Bearing Market estimates & forecasts, 2017 - 2030 (USD Billion)
Fig. 28 North America Bearing Market estimates & forecasts, 2017 - 2030 (USD Billion)
Fig. 29 U.S. Bearing Market estimates & forecasts, 2017 - 2030 (USD Billion)
Fig. 30 Canada Bearing Market estimates & forecasts, 2017 - 2030 (USD Billion)
Fig. 31 Europe Bearing Market estimates & forecasts, 2017 - 2030 (USD Billion)
Fig. 32 Western Europe Bearing Market estimates & forecasts, 2017 - 2030 (USD Billion)
Fig. 33 U.K. Bearing Market estimates & forecasts, 2017 - 2030 (USD Billion)
Fig. 34 Germany Bearing Market estimates & forecasts, 2017 - 2030 (USD Billion)
Fig. 35 France Bearing Market estimates & forecasts, 2017 - 2030 (USD Billion)
Fig. 36 Italy Bearing Market estimates & forecasts, 2017 - 2030 (USD Billion)
Fig. 37 Eastern Europe Bearing Market estimates & forecasts, 2017 - 2030 (USD Billion)
Fig. 38 Russia Bearing Market estimates & forecasts, 2017 - 2030 (USD Billion)
Fig. 39 Asia Pacific Bearing Market estimates & forecasts, 2017 - 2030 (USD Billion)
Fig. 40 China Bearing Market estimates & forecasts, 2017 - 2030 (USD Billion)
Fig. 41 India Bearing Market estimates & forecasts, 2017 - 2030 (USD Billion)
Fig. 42 Japan Bearing Market estimates & forecasts, 2017 - 2030 (USD Billion)
Fig. 43 Latin America Bearing Market estimates & forecasts, 2017 - 2030 (USD Billion)
Fig. 44 Brazil Bearing Market estimates & forecasts, 2017 - 2030 (USD Billion)
Fig. 45 Mexico Bearing Market estimates & forecasts, 2017 - 2030 (USD Billion)
Fig. 46 Middle East & Africa Bearing Market estimates & forecasts, 2017 - 2030 (USD Billion)
Fig. 47 KSA Bearing Market estimates & forecasts, 2017 - 2030 (USD Billion)
Fig. 48 UAE Bearing Market estimates & forecasts, 2017 - 2030 (USD Billion)
Fig. 49 South Africa Bearing Market estimates & forecasts, 2017 - 2030 (USD Billion)
Fig. 50 Key company categorization
Fig. 51 Bearing Market - Key company market share analysis, 2023
Fig. 52 Strategic framework
Market Segmentation
Bearing industry is shifting toward developing new types of application-specific bearings for the wind energy segment as the world is becoming more concerned about the environment. Wind turbines generate power without carbon-dioxide emissions and have gained widespread acceptance as the cleanest and eco-friendly source of energy. These turbines require large, high-quality, maintenance-free bearings for saving energy and reducing carbon emissions. Utilization of proper bearing solution in wind turbines helps in reducing lubricant consumption, increasing energy production, and enhancing turbine performance & reliability.
Due to the rising number of wind installations worldwide, the product demand has increased significantly. The increasing demand for energy efficiency in a range of applications is continuously leading to an improvement in wind turbine components, including bearing designs. Moreover, countries have accelerated their investments globally in installing offshore wind farms, despite their costly and complex maintenance operations.
Most of the major vehicle manufacturers have introduced some electric vehicle (EV) in recent years. The rising adoption of energy-efficient vehicles has led to innovations in bearings as well. Reduced energy consumption is one of the most imperative objectives in order to save the environment, which can be achieved by reducing friction. So, energy-saving and bearings go hand-in-hand. The main objective is to save energy by reducing the friction caused between mechanical parts, be it during the rotation of shafts of a transmission or the wheel of a vehicle.
A bearing is a key machine element with respect to improving the energy efficiency of a vehicle. Energy-efficient bearings help in increasing mileage for energy-efficient vehicles. Bearings help in lowering the levels of friction and heat dissipation as well as in supporting higher efficiency and operating speeds of an electric motor, thereby addressing the particular requirements of high power density electric motors for electric and hybrid vehicles.
Counterfeiters create counterfeit packaging with identical serial numbers, company logos, and even UPCs of bearings, which is a major restraint. The parts are cheaply manufactured using suspect labor practices and poor-quality materials or are old refurbished bearings. Asian countries, including Taiwan, Hong Kong, and China, are big market for these counterfeit bearings. Infrastructure development and widespread industrialization in the region have resulted in China dominating the bearings manufacturing market. Since counterfeiting hinders the growth of genuine manufacturing, local authorities and international anti-counterfeiting organizations are working together to combat the issue.
This section will provide insights into the contents included in this bearing market report and help gain clarity on the structure of the report to assist readers in navigating smoothly.
Industry overview
Industry trends
Market drivers and restraints
Market size
Growth prospects
Porter’s analysis
PESTEL analysis
Key market opportunities prioritized
Competitive landscape
Company overview
Financial performance
Product benchmarking
Latest strategic developments
Market size, estimates, and forecast from 2018 to 2030
Market estimates and forecast for product segments up to 2030
Regional market size and forecast for product segments up to 2030
Market estimates and forecast for application segments up to 2030
Regional market size and forecast for application segments up to 2030
Company financial performance
A three-pronged approach was followed for deducing the bearing market estimates and forecasts. The process has three steps: information procurement, analysis, and validation. The whole process is cyclical, and steps repeat until the estimates are validated. The three steps are explained in detail below:
Information procurement: Information procurement is one of the most extensive and important stages in our research process, and quality data is critical for accurate analysis. We followed a multi-channel data collection process for bearing market to gather the most reliable and current information possible.
Analysis: We mine the data collected to establish baselines for forecasting, identify trends and opportunities, gain insight into consumer demographics and drivers, and so much more. We utilized different methods of bearing market data depending on the type of information we’re trying to uncover in our research.
Market Research Efforts: Bottom-up Approach for estimating and forecasting demand size and opportunity, top-down Approach for new product forecasting and penetration, and combined approach of both Bottom-up and Top-down for full coverage analysis.
Value-Chain-Based Sizing & Forecasting: Supply-side estimates for understanding potential revenue through competitive benchmarking, forecasting, and penetration modeling.
Demand-side estimates for identifying parent and ancillary markets, segment modeling, and heuristic forecasting.
Qualitative Functional Deployment (QFD) Modelling for market share assessment.
Market formulation and validation: We mine the data collected to establish baselines for forecasting, identify trends and opportunities, gain insight into consumer demographics and drivers, and so much more. We utilize different methods of data analysis depending on the type of information we’re trying to uncover in our research.
Market Formulation: This step involves the finalization of market numbers. This step on an internal level is designed to manage outputs from the Data Analysis step.
Data Normalization: The final market estimates and forecasts are then aligned and sent to industry experts, in-panel quality control managers for validation.
This step also entails the finalization of the report scope and data representation pattern.
Validation: The process entails multiple levels of validation. All these steps run in parallel, and the study is forwarded for publishing only if all three levels render validated results.
The bearing market was categorized into three segments, namely product (Ball Bearings, Roller Bearings,Plain Bearings), application (Automotive, Agriculture, Electrical, Mining & Construction, Railway & Aerospace, Automotive Aftermarket), and regions (North America, Europe, Asia Pacific, Latin America, Middle East & Africa)
The bearing market was segmented into product, application, and regions. The demand at a segment level was deduced using a funnel method. Concepts like the TAM, SAM, SOM, etc., were put into practice to understand the demand. We at GVR deploy three methods to deduce market estimates and determine forecasts. These methods are explained below:
Demand estimation of each product across countries/regions summed up to from the total market.
Variable analysis for demand forecast.
Demand estimation via analyzing paid database, and company financials either via annual reports or paid database.
Primary interviews for data revalidation and insight collection.
Used extensively for new product forecasting or analyzing penetration levels.
Tool used invoice product flow and penetration models Use of regression multi-variant analysis for forecasting Involves extensive use of paid and public databases.
Primary interviews and vendor-based primary research for variable impact analysis.
The bearing market was analyzed at a regional level. The globe was divided into North America, Europe, Asia Pacific, Latin America, and Middle East & Africa, keeping in focus variables like consumption patterns, export-import regulations, consumer expectations, etc. These regions were further divided into fourteen countries, namely, the U.S.; Canada; Western Europe; the UK; Germany; France; Italy; Eastern Europe; Russia; China; India; Japan; Brazil; Mexico.
All three above-mentioned market research methodologies were applied to arrive at regional-level conclusions. The regions were then summed up to form the global market.
The bearing market was analyzed via companies operating in the sector. Analyzing these companies and cross-referencing them to the demand equation helped us validate our assumptions and conclusions. Key market players analyzed include:
HARBIN BEARING MANUFACTURING CO., LTD.: Harbin Bearing Manufacturing Co. Ltd. manufactures and distributes bearing products. The company supplies its products to several industries such as petroleum and chemical engineering, precision machine tool, national defense, motor and electric appliances, mining machinery, engineering machinery, aviation and spaceflight, and automobile.
HKT BEARINGS LIMITED: HKT BEARINGS LIMITED offers a variety of bearings used in steel production, ranging from raw material handling to rolling mill and cooling bed. The company caters to industries such as iron and steel, power generation, marine, cement/mining, and electric motors.
JTEKT CORPORATION: JTEKT is a manufacturer and seller of home accessory equipment, bearings, driveline components, electronic control devices, machine tools, and steering systems. The company offers bearing products under the brand Koyo (Koyo Seiko Co., Ltd.).
NBI Bearings Europe, S.A.: NBI Bearings designs and manufactures bearings including ball, tapered, spherical, and needle roller bearings for cranes and off-shore, gearboxes and drives, pulps and grabs, pulp and paper machinery, steel and iron industry, tubular standers, agricultural machinery, pulleys and sheare blocks, and crushing and shredding.
NSK Ltd.: NSK offers automotive products, precision machinery and parts, and mechatronic products. The company caters to various industries, including steel, mining and construction, automotive, and machine tools.
NTN Bearing Corporation: NTN Bearing Corporation manufactures needle roller bearings, ball bearings, cylindrical, spherical, tapered, and automotive constant velocity joints for the industrial machinery market, the aftermarket & distributor market, and the automotive market.
RBC BEARINGS INC.: RBC Bearings is a manufacturer of engineered precision bearings and products. The company operates through four business segments: plain bearings, roller bearings, ball bearings, and engineered products.
Rheinmetall AG: Rheinmetall AG manufactures actuators, structural components, pumps, engine blocks, solenoid valves, cylinder heads, and plain bearings for cars, stationary engines, trucks, ships, and locomotives.
Schaeffler AG: Schaeffler AG distributes systems and components for linear and rotary movement applications along with services across various sectors. The company develops, manufactures, and supplies components and systems for automotive and industrial applications.
SKF: SKF develops and manufactures products such as seals, bearings, and lubrication systems. It also offers rotating shaft solutions and services for the health assessment of machines, reliability engineering, and remanufacturing.
Supply Side Estimates
Company revenue estimation via referring to annual reports, investor presentations, and Hoover’s.
Segment revenue determination via variable analysis and penetration modeling.
Competitive benchmarking to identify market leaders and their collective revenue shares.
Forecasting via analyzing commercialization rates, pipelines, market initiatives, distribution networks, etc.
Demand side estimates
Identifying parent markets and ancillary markets
Segment penetration analysis to obtain pertinent
revenue/volume
Heuristic forecasting with the help of subject matter experts
Forecasting via variable analysis
Understanding market dynamics (in terms of drivers, restraints, & opportunities) in the countries.
Understanding trends & variables in the individual countries & their impact on growth and using analytical tools to provide high-level insights into the market dynamics and the associated growth pattern.
Understanding market estimates and forecasts (with the base year as 2022, historic information from 2017 to 2021, and forecast from 2023 to 2030). Regional estimates & forecasts for each category are available and are summed up to form the global market estimates.
The report provides market value for the base year 2022 and a yearly forecast till 2030 in terms of revenue/volume or both. The market for each of the segment outlooks has been provided on region & country basis for the above-mentioned forecast period.
The key industry dynamics, major technological trends, and application markets are evaluated to understand their impact on the demand for the forecast period. The growth rates were estimated using correlation, regression, and time-series analysis.
We have used the bottom-up approach for market sizing, analyzing key regional markets, dynamics, & trends for various products and end-users. The total market has been estimated by integrating the country markets.
All market estimates and forecasts have been validated through primary interviews with the key industry participants.
Inflation has not been accounted for to estimate and forecast the market.
Numbers may not add up due to rounding off.
Europe consists of EU-8, Central & Eastern Europe, along with the Commonwealth of Independent States (CIS).
Asia Pacific includes South Asia, East Asia, Southeast Asia, and Oceania (Australia & New Zealand).
Latin America includes Central American countries and the South American continent
Middle East includes Western Asia (as assigned by the UN Statistics Division) and the African continent.
GVR strives to procure the latest and unique information for reports directly from industry experts, which gives it a competitive edge. Quality is of utmost importance to us, therefore every year we focus on increasing our experts’ panel. Primary interviews are one of the critical steps in identifying recent market trends and scenarios. This process enables us to justify and validate our market estimates and forecasts to our clients. With more than 8,000 reports in our database, we have connected with some key opinion leaders across various domains, including healthcare, technology, consumer goods, and the chemical sector. Our process starts with identifying the right platform for a particular type of report, i.e., emails, LinkedIn, seminars, or telephonic conversation, as every report is unique and requires a differentiated approach.
We send out questionnaires to different experts from various regions/ countries, which is dependent on the following factors:
Report/Market scope: If the market study is global, we send questionnaires to industry experts across various regions, including North America, Europe, Asia Pacific, Latin America, and MEA.
Market Penetration: If the market is driven by technological advancements, population density, disease prevalence, or other factors, we identify experts and send out questionnaires based on region or country dominance.
The time to start receiving responses from industry experts varies based on how niche or well-penetrated the market is. Our reports include a detailed chapter on the KoL opinion section, which helps our clients understand the perspective of experts already in the market space.
"The quality of research they have done for us has been excellent."