
Transformers Procurement Intelligence Report, 2024 - 2030 (Revenue Forecast, Supplier Ranking & Matrix, Emerging Technologies, Pricing Models, Cost Structure, Engagement & Operating Model, Competitive Landscape)
- Published Date: Jul, 2024
- Base Year for Estimate: 2023
- Report ID: GVR-P-10592
- Format: Electronic (PDF)
- Historical Data: 2021 - 2022
- Number of Pages: 60
Transformers - Procurement Trends
“Rising focus on grid modernization and growth of decentralized power generation are driving the expansion of the transformers market.”
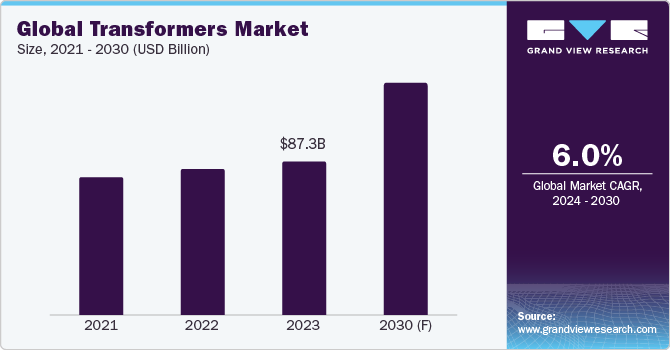
Transformers procurement facilitates several benefits to buyers, such as efficient electricity transmission, regulation of voltage levels as required, consistent electricity supply, and improvement in the safety of electrical equipment. The global market is projected to grow at a CAGR of 6% from 2024 to 2030. Key driving factors of this industry include rising focus on grid modernization, growth of decentralized power generation, robust economic growth and energy consumption, increasing investments towards power grids, expansion of renewable energy capacity, and heightened demand for electric vehicle (EV) charging stations.
The key trends in this industry include the rising adoption of High-Voltage Direct Current (HVDC) transformers, the deployment of smart transformers and smart grids, and the increased adoption of Solid-State Transformers (SSTs). For instance, the adoption of HVDC systems in long-distance and undersea power transmission has been accelerating in recent times. Moreover, HVDCs are becoming increasingly critical for interconnecting national grids and facilitating cross-border power trade, especially in Europe and APAC. Besides, the proliferation of smart grids is driving the need for smart transformers that are equipped with sensors and real-time data analytics. They have features such as dynamic load balancing, automated fault detection, and predictive maintenance, thus enhancing grid reliability and efficiency. Similarly, SSTs are increasingly gaining traction due to their superior efficiency, reduced size, and ability to handle high-frequency power conversion. Their application in EV charging infrastructure, data centers, and renewable energy systems is expanding rapidly.
The industry is currently facing several challenges, such as raw material price volatility, modernization costs due to aging infrastructure, high capital investments, supply chain disruptions, and difficulties in energy transition management. The prices of essential raw materials such as copper, steel, and insulation oils have been highly volatile, which has been directly impacting manufacturing costs and margins. Further, several existing transformers in developed countries are aging, thus causing inefficiencies and increased failure rates. The costs of upgrading or replacing them with modern, efficient ones are substantial. Moreover, the production and deployment of advanced transformers, especially those equipped with relatively new technologies such as solid-state designs, involve high capital investments. Additionally, managing the transition from traditional fossil fuel-based power generation to renewable energy sources requires careful planning and investment.
The global transformers market size was projected at USD 87.3 billion in 2023. During the COVID-19 pandemic, this industry was substantially affected by supply chain disturbances, component shortages, logistical bottlenecks, manufacturing delays, and demand fluctuations. For instance, several manufacturing plants were forced to close temporarily or reduce their operations during lockdowns to comply with social distancing measures. This led to a backlog of orders and delays in production schedules. Simultaneously, there was a significant drop in demand for transformers due to several industries, such as automotive and construction, operating at reduced capacity or halting operations entirely. However, since 2023, global supply chains have largely stabilized, with manufacturers implementing strategies to mitigate future disruptions. Some of the post-pandemic measures applied by suppliers include diversifying supplier bases, increasing inventory buffers, and enhancing logistics coordination.
The key technological trends and innovations in 2024 include IoT-integrated smart transformers, digital twins, the use of High-Temperature Superconductors (HTS), 3D printing, and enhanced cooling technologies. In essence, smart transformers equipped with IoT sensors are capable of real-time monitoring, data collection, and remote management, thus providing end-users with enhanced visibility into performance, in addition to facilitating proactive maintenance. In another instance, digital twins entail creating a virtual replica of a physical transformer. These virtual/digital models simulate the physical device's behavior and performance in real time, thus allowing end-users to conduct simulations, optimize operations, and predict maintenance needs. Furthermore, the use of HTS materials in the windings of these devices facilitates significant efficiency improvements and reduced energy losses. The use of HTS-based materials also improves power densities and temperatures, making this equipment ideal for high-demand applications.
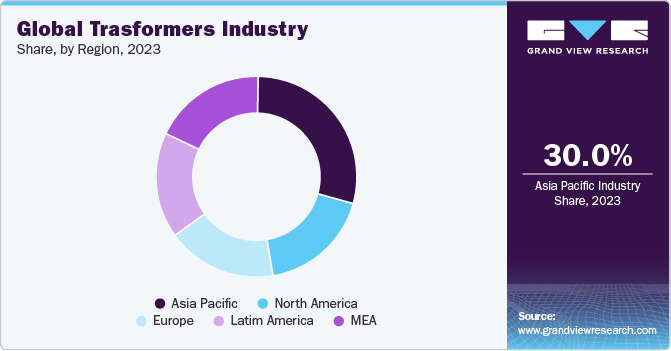
APAC dominates the global industry, accounting for 30% of the global market share in 2023. The region’s growth can be attributed to rapid urbanization and industrialization, growing energy demand, renewable energy expansion, technological advancements, and government incentives. For instance, rapid urbanization in countries such as India and China is driving the need for extensive infrastructure development, including the construction of new power grids and the upgradation of existing ones. Moreover, several APAC countries have set ambitious renewable energy targets as part of their climate action plans. The integration of renewable energy sources (such as solar and wind) into power grids requires advanced transformers capable of handling variable power generation requirements.
Supplier Intelligence
"What are the characteristics of the transformers market, and who are the key players involved?"
The global industry is fragmented, with intense competition among key players. Prominent suppliers are emphasizing technological innovation, diversification of product portfolio, durability, compliance, and customer service. Suppliers are looking to offer a wide range of equipment, such as power, distribution, and specialty transformers (e.g., pad-mounted units) for various applications.
In 2024, energy efficiency has been one of the key priorities for suppliers. Hence, manufacturing equipment that minimizes energy losses is crucial. Companies are increasingly investing in R&D to create such advanced, eco-friendly transformers that comply with energy regulations and also help in the reduction of greenhouse gas emissions.
In terms of the demand landscape, some of the key considerations that buyers look at during procurement of transformers include technical specifications, quality and reliability, lead time, and application specific requirements. For instance, power rating is one of the key specifications, as it ensures that transformers can handle larger loads. Other specifications that are important for buyers include voltage levels, frequency, impedance, and cooling methods (such as oil-cooled or air-cooled/dry type).
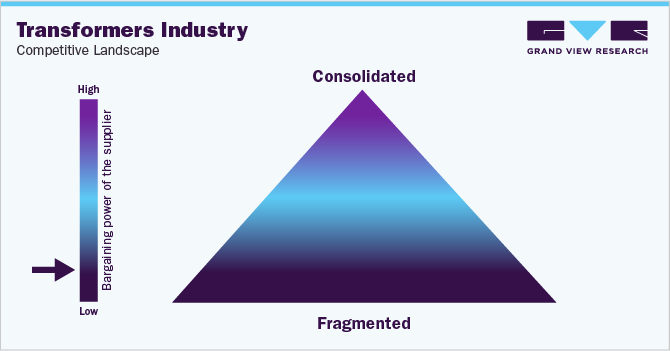
High capital investment, technological expertise, and compliance with stringent regulatory standards create significant barriers to entry for new players striving to establish themselves. Moreover, larger firms benefit from economies of scale, making it difficult for new companies to compete on cost. Additionally, established brands (such as ABB, Hitachi, and General Electric), that have a combination of reliability, performance, and a strong market presence make it tough for entrants to build trust quickly. Utility companies and large industrial clients often purchase the equipment in bulk and have significant negotiating power due to their larger purchasing volumes. While some product differentiation may exist in terms of specifications and performance, transformers are viewed as relatively standardized products, which increases the buyers’ bargaining power.
Prominent suppliers covered in the industry:
-
ABB Ltd.
-
Alstom SA
-
CG Power & Industrial Solutions Ltd.
-
Eaton Corporation plc
-
General Electric Company
-
Hitachi Energy Ltd.
-
Hyosung Heavy Industries
-
Hyundai Heavy Industries Co., Ltd.
-
Mitsubishi Electric Corporation
-
Schneider Electric SE
-
Siemens AG
-
Toshiba Corporation
Pricing and Cost Intelligence
“What are the main components of the cost structure for transformers, and what are the factors impacting the prices?"
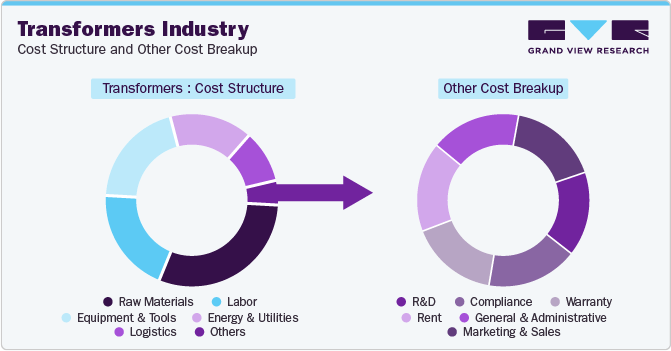
Buyers need to carefully consider several factors related to cost and pricing during procurement and sourcing. This industry has raw materials, labor, equipment and tools, energy and utilities, logistics, and others as the key cost-structure components. Other costs include R&D, compliance, warranty, rent, general and administrative, and marketing and sales. Raw materials account for the major component in the cost composition, followed by labor.
The chart below showcases the breakdown of cost components. Other costs may be broken down as depicted below:
The transformer core is typically made from high-grade silicon steel, which is essential for reducing core losses. Copper or aluminum are the key materials used in the primary and secondary windings of this equipment. Copper is relatively expensive compared to aluminum but offers superior conductivity and efficiency. Moreover, high-quality insulating materials, such as oil, resin, paper, and insulating tapes, are crucial for ensuring the durability and performance of the equipment. All of these raw materials, along with structural components, such as tanks, cladding, and cooling systems, fall within the bracket of raw materials expenses.
Manufacturing transformers require highly skilled labor for tasks, such as winding, assembly, testing, and quality assurance. Moreover, labor costs also include the expenses associated with engineering and design personnel. Additionally, salaries of maintenance, supervision, and other operational personnel are also considered within this bracket.
The prices of transformers alter on the basis of several circumstances. Key factors causing variations in prices include raw material price fluctuations, design and specifications, demand and supply fluctuations, and transportation and logistics. For instance, alterations in copper and steel prices have led to a significant impact on the overall prices. In 2024, copper prices experienced notable fluctuations driven by supply constraints and increasing demand. The average global price of copper in May 2024 was approximately USD 10,139 per metric ton, up from USD 9,464 in April 2024 and USD 8,689 in March 2024. These fluctuations were influenced by tightened supply, particularly from key mines such as First Quantum Mineral’ ‘Cobre Panama,’ along with production cuts by Chinese smelters due to low treatment and refining charges.
Similarly, steel prices in 2024 also saw significant variations. In March 2024, steel prices in the U.S. averaged USD 805 per metric ton, witnessing a 12.9% decline as compared to February 2024. Key reasons affecting steel prices included supply chain disruptions, changes in raw material costs (such as iron ore and coking coal), and variations in demand from construction and automotive sectors.
In 2024, the average prices (global) of power transformers typically ranged from USD 75,000 to USD 250,000, depending on their capacity and specifications. Average prices (global) of oil-immersed distribution transformers spanned in the range of USD 6,000 to USD 11,000, based on factors such as efficiency, insulation, and cooling systems. The average prices (global) of dry-type transformers varied in the range of USD 9,000 to USD 16,000, based on their voltage specifications (typically low- or medium-voltage), as well as other features and customizations.
Key players in this market deploy various pricing models, including cost-plus pricing. In this pricing model, the price is determined by adding a standard margin to the total production cost. This model ensures that manufacturers cover their costs and achieve a profit. Another key pricing model being implemented is volume-based pricing, wherein the price per unit of a transformer decreases as the quantity purchased increases. This pricing model allows manufacturers to offer discounts on bulk purchases. Other key pricing structures used in this industry are demand-based pricing and competition-based pricing.
Sourcing Intelligence
“What methods or models do buyers of transformers implement while they engage with their suppliers?”
In terms of sourcing and procurement intelligence, buyers usually adopt an approved provider operating model for engaging with suppliers, which involves a pre-qualification process wherein suppliers are vetted based on certain criteria before being approved to bid on contracts. The evaluation criteria may include technical capabilities, compliance with industry regulations, and performance.
Approved suppliers are subject to ongoing performance monitoring and periodic re-evaluation to ensure they continue to meet required standards. This operating model entails several benefits, such as quality assurance, risk mitigation, cost savings, and strengthened supplier relationships. Buyers prefer to sign long-term contracts (spanning 3-10 years) for stability, supply chain resilience, and improved capacity planning.
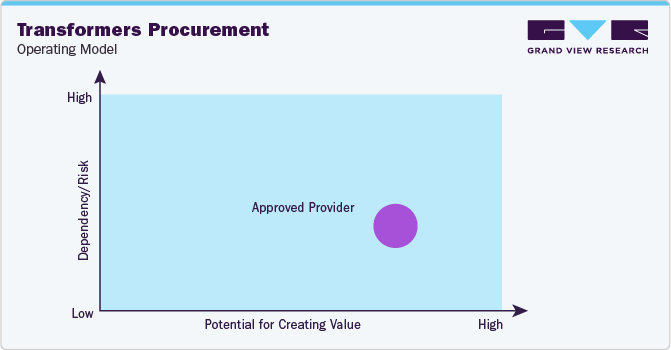
"An approved provider is a vendor that matches a predefined set of selection criteria such as quality standards, prior-proven performances, qualifications, or others."
Buyers may opt for local or regional sourcing to improve supply chain-related costs and procurement costs. However, buyers may, at times, prefer global sourcing when seeking certain cutting-edge technology features or specialized capabilities. Within APAC, India, China, and Vietnam are the preferred low-cost countries for sourcing. China is one of the world's largest producers of transformers and offers competitive pricing due to low labor costs and economies of scale. The country also has a well-developed manufacturing infrastructure and a wide supplier base, making it a preferred destination for sourcing. India has a growing number of players that are offering competitive pricing, along with cheap labor costs, a conducive business environment, and favorable government policies. Within LATAM, Mexico, Colombia, and Brazil are considered cost-effective destinations for sourcing. Key reasons include a well-developed industrial infrastructure, a skilled labor force, and favorable trade agreements.
The report also provides details regarding peer analysis, recent supplier developments, supply-demand analysis, competitive landscape, KPIs, SLAs, risk assessment, negotiation strategies, and low-cost/best-cost sourcing analysis. In this report, we have tried to provide a holistic industry perspective, an overview of the supplier landscape - the presence of different types of players and the competitive pressure within the industry as a whole (PORTER’s). Raw materials form the largest cost component of transformers. Similarly, the supply chain practices under sourcing and procurement are also covered. One such instance is the operating model that encompasses all the business processes conducted within an organization. It is an integral aspect of the company's operations and plays a crucial role in its success
Transformers Procurement Intelligence Report Scope
|
Report Attribute |
Details |
|
Growth Rate |
CAGR of 6% from 2024 to 2030 |
|
Base Year for Estimation |
2023 |
|
Pricing Growth Outlook |
5% - 10% increase (Annually) |
|
Pricing Models |
Cost-plus pricing, volume-based pricing, demand-based pricing, competition-based pricing |
|
Supplier Selection Scope |
Cost and pricing, past engagements, productivity, geographical presence |
|
Supplier Selection Criteria |
Geographical service provision, industries served, years in service, employee strength, revenue generated, key clientele, regulatory certifications, transformer type (power/distributed/SST/others), voltage type (high/medium/low), cooling type (oil-cooled/air-cooled), customer service, lead time, and others |
|
Report Coverage |
Revenue forecast, supplier ranking, supplier matrix, emerging technology, pricing models, cost structure, competitive landscape, growth factors, trends, engagement, and operating model |
|
Key Companies Profiled |
ABB Ltd., Alstom SA, CG Power & Industrial Solutions Ltd., Eaton Corporation plc, General Electric Company, Hitachi Energy Ltd., Hyosung Heavy Industries, Hyundai Heavy Industries Co., Ltd., Mitsubishi Electric Corporation, Schneider Electric SE, Siemens AG, and Toshiba Corporation |
|
Regional Scope |
Global |
|
Revenue Forecast in 2030 |
USD 131.3 billion |
|
Historical Data |
2021 - 2022 |
|
Quantitative Units |
Revenue in USD billion and CAGR from 2024 to 2030 |
|
Customization Scope |
Up to 48 hours of customization free with every report. |
|
Pricing and Purchase Options |
Avail customized purchase options to meet your exact research needs. Explore purchase options |
Frequently Asked Questions About This Report
b. The global transformers market size was estimated at approximately USD 87.3 billion in 2023 and is projected to grow at a CAGR of 6% from 2024 to 2030.
b. Rising focus on grid modernization, growth of decentralized power generation, rising economic growth and energy consumption, increasing investments towards power grids, expansion of renewable energy capacity, and rising demand for electric vehicle (EV) charging stations are driving the growth of this industry.
b. According to the LCC/BCC sourcing analysis, India, China, Vietnam, Mexico, and Colombia are the cost-effective countries in their respective regions for sourcing transformers.
b. This industry displays a fragmented landscape, with an intense level of competition. Some of the key players are ABB Ltd., Alstom SA, CG Power & Industrial Solutions Ltd., Eaton Corporation plc, General Electric Company, Hitachi Energy Ltd., Hyosung Heavy Industries, Hyundai Heavy Industries Co., Ltd., Mitsubishi Electric Corporation, Schneider Electric SE, Siemens AG, and Toshiba Corporation.
b. Raw materials, labor, equipment & tools, energy & utilities, logistics, and others are the major cost components in transformers. Other costs include R&D, compliance, warranty, rent, general & administrative, and marketing & sales.
b. In transformers procurement, the best practices for selecting suppliers include comparing the prices quoted by suppliers, assessing geographical service capabilities, checking years of experience, comparing insulation materials used, checking power ratings, assessing cooling type, checking use of sustainable materials, and evaluating lead time.
Add-on Services
Should Cost Analysis
Component wise cost break down for better negotiation for the client, highlights the key cost drivers in the market with future price fluctuation for different materials (e.g.: steel, aluminum, etc.) used in the production process
Rate Benchmarking
Offering cost transparency for different products / services procured by the client. A typical report involves 2-3 case scenarios helping clients to select the best suited engagement with the supplier
Salary Benchmarking
Determining and forecasting salaries for specific skill set labor to make decision on outsourcing vs in-house.
Supplier Newsletter
A typical newsletter study by capturing latest information for specific suppliers related to: M&As, technological innovations, expansion, litigations, bankruptcy etc.


