
Promotional Products Procurement Intelligence Report, 2024 - 2030 (Revenue Forecast, Supplier Ranking & Matrix, Emerging Technologies, Pricing Models, Cost Structure, Engagement & Operating Model, Competitive Landscape)
- Published Date: Jul, 2024
- Base Year for Estimate: 2023
- Report ID: GVR-P-10595
- Format: Electronic (PDF)
- Historical Data: 2021 - 2022
- Number of Pages: 60
Promotional Products - Procurement Trends
“Rise in sale of specialty products is fueling the growth of the industry.”
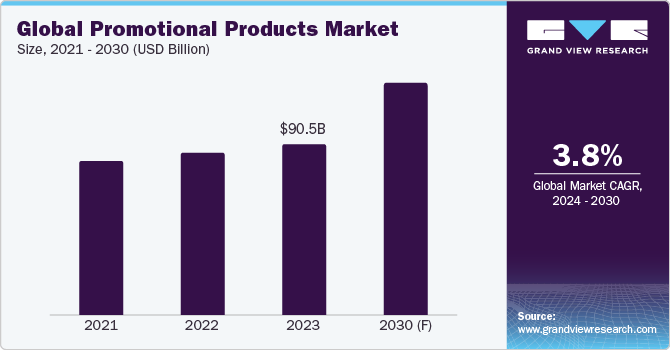
Procurement of promotional products enables businesses to reach out to more potential clients at a reasonable cost. The global market is anticipated to grow at a CAGR of 3.75% from 2024 to 2030. It is a low-budget customer acquisition technique that well-known international brands even use. These products enable startups and small enterprises to reduce their marketing expenses while still capturing consumers' attention. Key factors driving the growth include a rise in sales of specialty products (such as pens, caps, and t-shirts), increased offering of value-added services (such as value-engineering, relevant market inputs, and design inputs) by the suppliers, and growing investments in memorable and customizable products to attract customers.
However, a lack of innovation is anticipated to hinder growth during the projected timeframe. For instance, polypropylene tote bags hasn’t witnessed any notable advancements since it became popular, a decade back. It is also thought that pricing demands from manufacturers and suppliers are a major factor in the slow rate of innovation.
Research shows that products offered in the industry raise brand awareness. Consumers perceive it as the most effective type of advertising. When a business invests in an engaging marketing tool, its audience is more likely to remember it when they need the brand's product or services. The brand name on a promotional product is remembered by over 75.9% of consumers. When promotional merchandise is offered as a gift with purchase in a bundle at the point of sale, it sells more than when it is discounted separately.
Twenty billion dollars are spent annually on promotional materials by American businesses. The largest corporations in the world use these tools to promote their brands, cultivate a loyal consumer base, and more. They use them to build brand awareness, recognition, and equity while fostering consumer connections, sharing the company's distinctive tales, expressing gratitude, and inspiring certain activities. As per a recent consumer study survey, over 93.9% admitted that they like receiving the industry's products, and over 82.9% admitted that their experiences are enhanced with promotional merchandise.
The global promotional products market size was valued at USD 90.5 billion in 2023. Growth is being fueled by the growing attention of major end-user sectors, such as healthcare, non-profit organizations, real estate, education, finance, and government. Healthcare has emerged as a promising sector utilizing marketing products. Branded products are used for promotional purposes by a variety of clientele, including clinics, hospitals, outpatient clinics, and surgery centers. Using branded products helps medical practices and outpatient surgery clinics build their reputation and confidence in the community. Custom ice packs, medication boxes, and first aid kits are just a few of the many promotional choices available. Likewise, many non-profits always look forward to promoting their causes (by utilizing products such as lanyards, tote bags, tumblers and silicone wristbands). In order to promote people's participation, they wish to call attention to what they are doing. To gain momentum for their work, they rely on donations, community support, and word-of-mouth.
Products that seamlessly integrate technology are becoming more and more popular in today's technologically driven environment. Products that combine functionality with novelty, such as Bluetooth-enabled speakers, smart water bottles with hydration tracking features, and wireless charging pads, increase brand awareness in the tech-savvy consumer base. These products suit the flexible and connected lifestyle of modern customers while also showcasing innovation.
In addition, customized and individualized products are still a major force in the market. Companies are using digital tools for customization and cutting-edge printing processes to make products that cater to the unique tastes and passions of their customers. Personalization enhances the emotional bond between the business and the recipient and gives a sense of exclusivity, whether it takes the form of designing bespoke socks or engraving a customer's name on a premium pen.
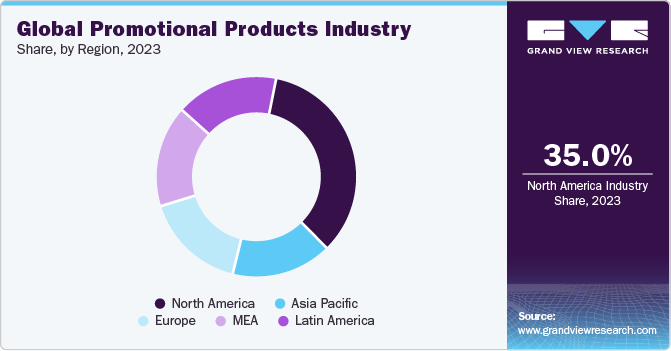
The North America region accounts for the largest share in the global market. Product procurement has witnessed growth due to an increase in corporate profits and the number of business enterprises. These businesses utilize these products to build brand awareness and favorability among consumers.
However, the COVID-19 pandemic briefly reversed the industry's growth in 2020 as stay-at-home orders and the ensuing economic slowdown made it more difficult for enterprises facing declining revenue to spend. In 2021, manufacturers had a sharp increase in sales as corporate profits skyrocketed due to the rebound. Since then, as interest rates have increased, corporate profit has continued to regress and even drop-beginning in 2023, which had an impact on the promotional product's demand. The products find their largest markets in the insurance and banking sectors. Businesses in these industries use promotional materials for about 24.9% of their marketing expenditures.
Supplier Intelligence
“What best describes the nature of the Promotional Products industry? Who are the key players operating in the market?”
This industry exhibits a fragmented landscape, with the presence of a large number of regional and global players who needs to be reached out for the procurement of promotional products. With an objective to expand their global footprint and enhance their product portfolio, key players in the industry are implementing strategic initiatives, such as new product launches, mergers and acquisitions and collaborations. In addition, the players are also making significant investments to ensure covering electronic items, including power banks and wireless chargers, tablet and phone accessories, computer accessories and tech gadgets. Electronic items are witnessing high demand these days by various sectors. For instance, these days, consumers are constantly searching for wireless products (such as Bluetooth keyboards, mouse and wireless speakers). Customers are thinking about decluttering since personal and professional lives are becoming increasingly similar.
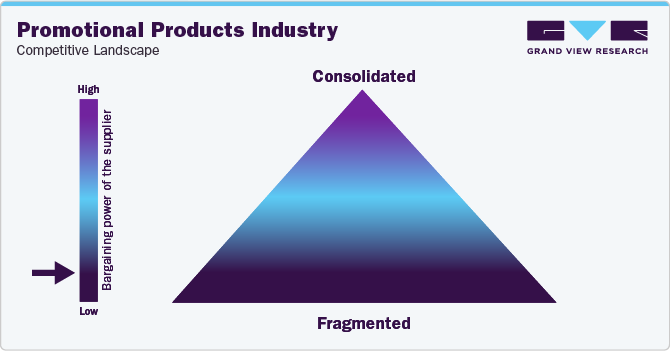
Suppliers possess the low capability to negotiate with the buyers as the buyers have an edge to choose the supplier of their choice due to the availability of a large supply base and low switching cost. Therefore, the suppliers are bound to stay soft in terms of pricing and product range. The intensity of the competition allows the suppliers to stay more flexible towards the buyers as they need to hold a substantial share of the market to have an edge against their competitors.
The threat from substitute products/services is low to moderate, owing to the growing competition from online and digital media. The market is under increasing pressure as more businesses direct their advertising budgets towards internet and mobile platforms; however, it still has a key role in providing tangible, memorable brand experiences.
Key suppliers covered in the industry:
-
4imprint Group plc
-
American Business Forms & Envelopes
-
BDS Connected Solutions, LLC
-
Brand Addition Limited
-
HALO Branded Solutions, Inc.
-
HH Global Group Limited
-
IGC Global Promotions
-
iPROMOTEu
-
Prominate Limited
-
Smidt‐imex
-
Total Merchandise Ltd.
-
VistaPrint
Pricing and Cost Intelligence
“What are the key cost components for Promotional Products industry? What factors influence the charges/ prices?"
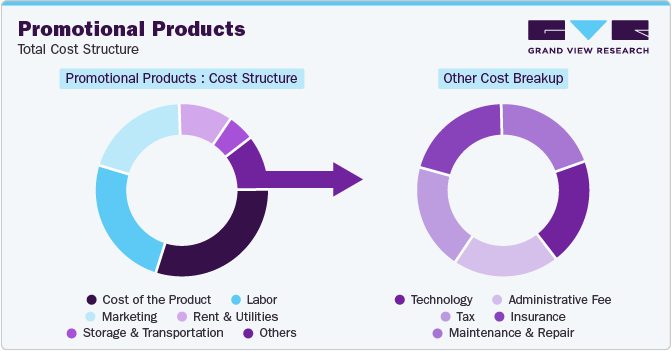
The cost structure of the global promotional products industry is constituted by printing & engraving equipment, software tools, cost of the product, labor, marketing, rent and utilities, and others.Other costs include storage and transportation, printing ink and toner, maintenance & repair, administrative fees, and tax. The cost of the printing and engraving equipment holds the largest percentage of the cost component. It may cost high or low depending on the technology, such as UV printer, laser printer, 3D printer, garment printer, and digital printer.
Key variables that influence the price of a promotional products include the cost of printing & engraving a respective product, the cost of an undecorated product, decorations expenses, setup expenses, and delivery expenses. The cost of an undecorated product is the price of the basic product alone, without any extra decorations. The cost of the undecorated item will vary based on its design and quality. Economies of scale generally apply to bigger quantities (the more ordered, the cheaper it gets per unit). Decoration expenses comprise the adorning of a product with a custom print or decoration. It is often charged per spot color and position. The price increases with the number of colors or positions required. “Spot color” printing, also known as pad or screen printing, prevents gradients and shades from being produced because each color is printed using its ink.
The price of UV printers ranges between USD 1,799 and USD 13,099 in the U.S. These prices vary based on brand and various technical specifications, such as print speed, type of head (single/dual array) and substrate thickness. The price of commercial laser printers ranges between USD 339 and USD 6,339 in the U.S. Similar to the UV printers, the prices for these also vary based on the brand and certain technical specifications.
In the U.S., the procurement of promotional items will be based on the prices - drinkware (such as mugs, insulated bottles and glasses) ranging between USD 0.70 and USD 214.4. Clothing items (such as t-shirts, sweatshirts and caps) range between USD 2.79 and USD 289.3. Technology products (such as accessories, power banks, chargers and flash drives) range between USD 1.08 and USD 221.4. Office supplies (such as pens, notebooks, calendars and journals) range between USD 0.16 and USD 253.4. Leisure items (such as ponchos and umbrellas, golf accessories and travel essentials) range between USD 0.20 and USD 97.44.
The cost structure is broken down in the accompanying chart. Other costs can depend on multiple cost components, which have been illustrated below:
Sourcing Intelligence
“How do buyers of Promotional Products engage with their suppliers? What is the type of engagement model?”
The sourcing intelligence for promotional products suggests that the buyers (business enterprises) opt for full services outsourcing model to engage with the suppliers for the procurement of products, as business enterprises may find it difficult to produce in-house by merely deploying additional staff. Promotional products include a variety of different products, from a piece of cloth to any sophisticated gadget. Therefore, business enterprises ideally collaborate with manufacturers/distributors who can cover the maximum range of products, meeting the specific needs of their clients.
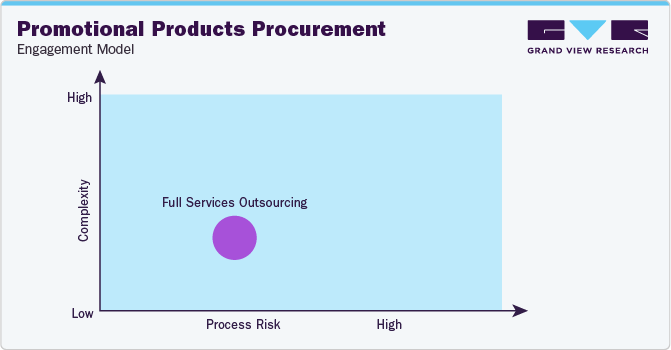
"In the full services outsourcing model, the client outsources the complete operation/manufacturing to a single or multiple companies."
Buyers opt for a ‘basic provider’ to procure their products. A basic provider is a supplier that operates under a simple buy-sell arrangement where buyers typically pay a set “transaction” price for products or services. Since the products that are offered in the industry don’t often require to be very sophisticated, buyers predominantly opt for a supplier who is just capable of meeting the requirements in terms of customization, range, and lead time. In addition, it is sometimes beneficial for businesses to collaborate with new and different suppliers as it offers a better understanding of the pricing and add-ons and enables them to negotiate in a better way.
China can be considered the low / best country for sourcing promotional products. The Asian powerhouse is the largest manufacturer of promotional products globally. Businesses buying from China can select from thousands of designs and styles to promote their brand name. Compared to the previous year, China's manufacturing exports increased by 6.9% in January and February 2024, expressed in US dollars. However, as a result of a glut of Chinese output and declining pricing for many of these products, export volume and market share are growing significantly faster. China currently has manufacturing surpluses in excess of twice the size of the global economy.
The report also provides details regarding peer analysis, recent supplier developments, supply-demand analysis, competitive landscape, KPIs, SLAs, risk assessment, negotiation strategies, and low-cost/best-cost sourcing analysis. In the report, we have tried to provide a holistic industry perspective, an overview of the supplier landscape - the presence of different types of players and the competitive pressure within the industry as a whole (PORTER’s). The key benefit of procuring promotional products is that it acts as a business card, which enables the customer to recall the name of the firm for a longer time duration. Similarly, the supply chain practices under sourcing are also covered. One such instance is the operating or engagement model which encompasses all the business processes conducted within an organization. It is an integral aspect of the company's operations and plays a crucial role in its success.
Promotional Products Procurement Intelligence Report Scope
|
Report Attribute |
Details |
|
Growth Rate |
CAGR of 3.75% from 2024 to 2030 |
|
Base Year for Estimation |
2023 |
|
Pricing Growth Outlook |
5% - 10% increase (Annually) |
|
Pricing Models |
Cost-plus pricing, Fixed pricing, Competition-based pricing |
|
Supplier Selection Scope |
Cost and pricing, Past engagements, Productivity, Geographical presence |
|
Supplier Selection Criteria |
Industries served, years in service, geographic service provision, revenue generated, employee strength, key clients, types of products (office supplies / drinkware / clothing / mugs / bags / others), customization options, eco-friendly options, customer support, lead time, and others |
|
Report Coverage |
Revenue forecast, supplier ranking, supplier matrix, emerging technology, pricing models, cost structure, competitive landscape, growth factors, trends, engagement, and operating model |
|
Key Companies Profiled |
4imprint Group plc, American Business Forms & Envelopes, BDS Connected Solutions, LLC, Brand Addition Limited, HALO Branded Solutions, Inc., HH Global Group Limited, IGC Global Promotions, iPROMOTEu, Prominate Limited, Smidt‐imex, Total Merchandise Ltd., and VistaPrint |
|
Regional Scope |
Global |
|
Revenue Forecast in 2030 |
USD 117.1 billion |
|
Historical Data |
2021 - 2022 |
|
Quantitative Units |
Revenue in USD billion and CAGR from 2024 to 2030 |
|
Customization Scope |
Up to 48 hours of customization free with every report. |
|
Pricing and Purchase Options |
Avail customized purchase options to meet your exact research needs. Explore purchase options |
Frequently Asked Questions About This Report
b. The global promotional products market size was valued at approximately USD 90.5 billion in 2023 and is estimated to witness a CAGR of 3.75% from 2024 to 2030.
b. Rise in sales of specialty products (such as pens, caps, and t-shirts), increased offering of value-added services (such as value-engineering, relevant market inputs, and design inputs) by the suppliers, and growing investments in memorable and customizable items with an objective to attract customers are driving the growth of the industry.
b. According to the LCC/BCC sourcing analysis, China, India, Germany, U.K., and France are the ideal destinations for sourcing promotional products.
b. This industry exhibits a fragmented landscape with intense competition. Some of the key players are 4imprint Group plc, American Business Forms & Envelopes, BDS Connected Solutions, LLC, Brand Addition Limited, HALO Branded Solutions, Inc., HH Global Group Limited, IGC Global Promotions, iPROMOTEu, Prominate Limited, Smidt‐imex, Total Merchandise Ltd., and VistaPrint.
b. Printing & engraving equipments, software tools, cost of the product, labor, marketing, rent & utilities, and others are the key cost components for promotional products. Other costs can be further bifurcated into storage & transportation, printing ink & toner, maintenance & repair, administrative fee, and tax.
b. Ensuring if the supplier offers eco-friendly products, comparing the prices and product range offered by different suppliers, reviewing the geographical services presence of the suppliers, assessing the product quality of the suppliers, and ensuring that a particular suppliers cover customization options are some of the best sourcing practices considered by the procurement professionals in this category.
Add-on Services
Should Cost Analysis
Component wise cost break down for better negotiation for the client, highlights the key cost drivers in the market with future price fluctuation for different materials (e.g.: steel, aluminum, etc.) used in the production process
Rate Benchmarking
Offering cost transparency for different products / services procured by the client. A typical report involves 2-3 case scenarios helping clients to select the best suited engagement with the supplier
Salary Benchmarking
Determining and forecasting salaries for specific skill set labor to make decision on outsourcing vs in-house.
Supplier Newsletter
A typical newsletter study by capturing latest information for specific suppliers related to: M&As, technological innovations, expansion, litigations, bankruptcy etc.


