- Home
- »
- Market Trend Reports
- »
-
Analysis Of Diagnostic Imaging Procedure Volumes/Number of Studies By Modality
Overview of the U.S. Diagnostic Imaging Services Industry
The U.S. diagnostic imaging services industry plays a crucial role in modern healthcare, providing essential tools for the detection, diagnosis, and treatment of various medical conditions. This industry encompasses a wide range of imaging modalities, including X-ray, computed tomography (CT), magnetic resonance imaging (MRI), ultrasound, nuclear medicine, and positron emission tomography (PET). The diagnostic imaging market has witnessed significant growth over the past decade, driven by technological advancements, an aging population, and an increasing prevalence of chronic diseases.
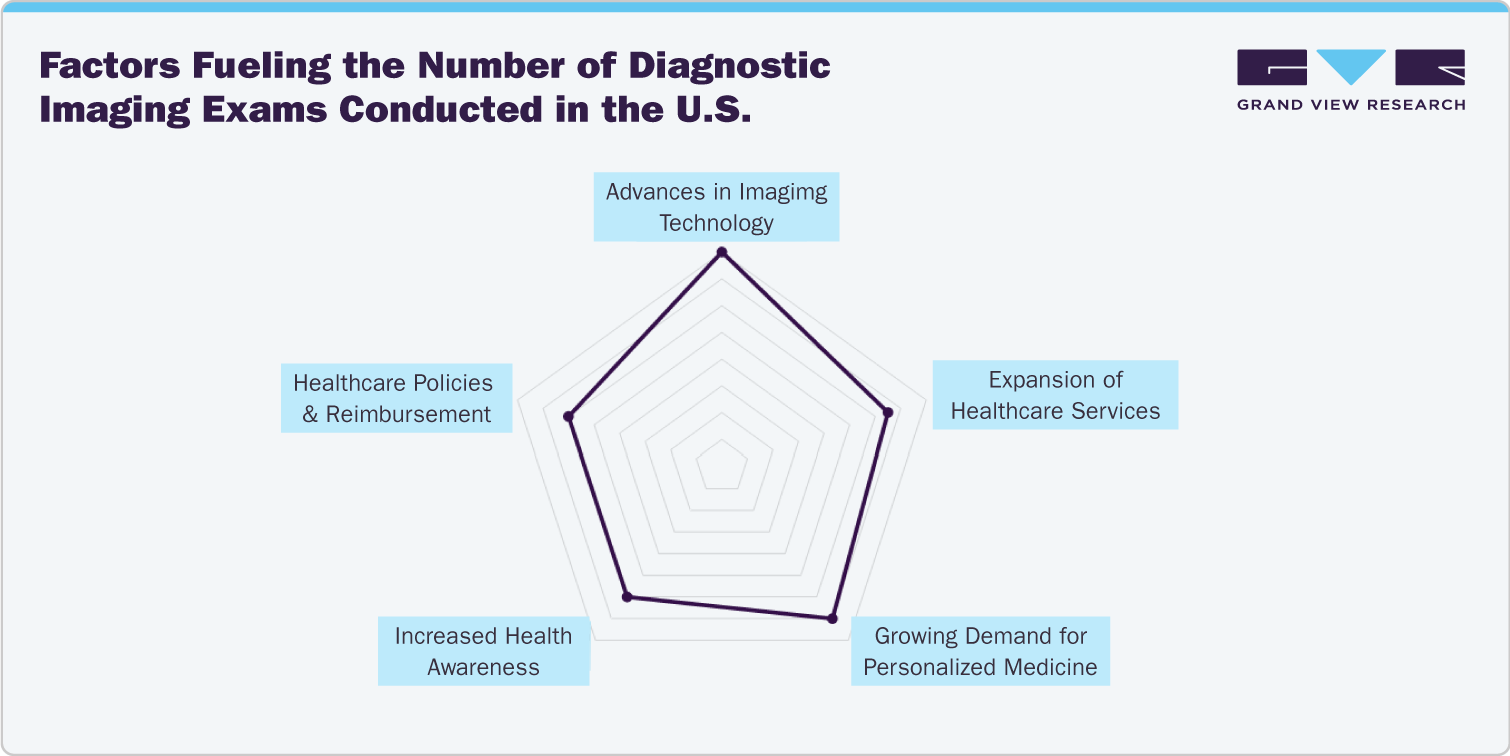
Factors Fueling the Number of Diagnostic Imaging Exams Conducted in the U.S.
Several factors contribute to the increasing number of diagnostic imaging exams conducted in the U.S.

-
Advances in Imaging Technology: Continuous improvements in imaging technology have made procedures faster, safer, and more accurate, increasing their adoption in clinical practice.
-
Expansion of Healthcare Services: The expansion of healthcare services, including the establishment of more imaging centers and facilities, has improved access to diagnostic imaging.
-
Growing Demand for Personalized Medicine: The shift towards personalized medicine, which relies heavily on detailed imaging for tailored treatment plans, has boosted the demand for diagnostic imaging.
-
Increased Health Awareness: Rising health awareness and proactive healthcare management have led to an increase in routine screenings and preventive imaging studies.
-
Healthcare Policies and Reimbursement: Favorable healthcare policies and reimbursement structures have made diagnostic imaging more accessible and affordable for patients.
Trends in the Number of Radiology Studies and A Decline in Radiation Dose
A special report published (19th December 2022) in Radiology provided an overview of the number of radiology exams performed worldwide and the associated radiation doses patients receive, revealing a decline in overall radiation exposure from medical imaging over the past decade. The report includes data from the U.S. National Council on Radiation Protection and Measurements (NCRP) and the United Nations Scientific Committee on the Effects of Atomic Radiation (UNSCEAR) for 2009 to 2018. Researchers from Johns Hopkins University School of Medicine, the CDC, and the University of New Mexico analyzed the frequency of radiologic and nuclear medicine studies and radiation doses in the U.S. for 2016 compared to global estimates from 2009 to 2018.
Key trends noted in the report include:
-
The number of CT exams in the U.S. increased by about 20% from 2006 to 2016, while the global number nearly doubled. Despite this, the effective dose per capita for CT in the U.S. decreased by nearly 20%.
-
Mammography usage increased significantly in both the U.S. and globally.
-
Conventional radiography procedures (excluding dental) decreased both globally and in the U.S.
-
Nuclear medicine procedures (excluding dental) saw a small global increase but a marked decrease in the U.S.
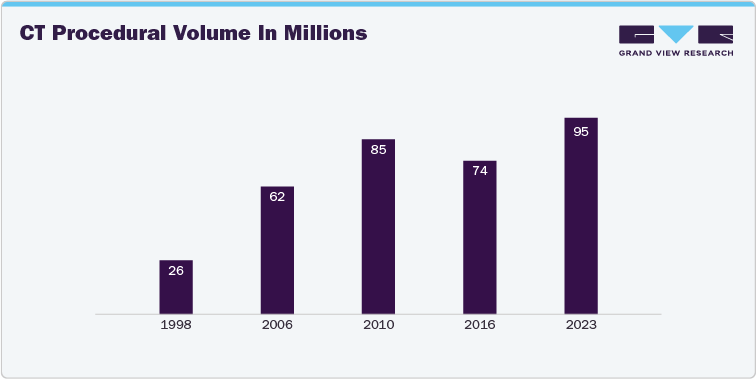
Furthermore, CT scan volumes have increased dramatically since the mid-1970s.

By 1998, an estimated 26 million CT exams were performed in the U.S., rising to 62 million by 2006 and peaking at 85 million in 2010. The number then stabilized at approximately 74 million through 2016, with about 230 CT procedures per 1,000 people. The largest categories were abdomen and pelvis (20.1 million), brain (15.3 million), and chest (12.7 million). Globally, UNSCEAR estimated 403 million CT exams from 2009 to 2018, nearly double the 220 million estimated for 2006. Head CT was the most frequent, followed by chest and abdominal CT.
Nuclear imaging in the U.S. grew rapidly until 2005, peaking at 17.2 million exams, but then decreased by more than 20% from 2006 to 2016, dropping to 13.5 million exams. This decline was largely due to fewer cardiac studies, which were partially replaced by stress echocardiography and cardiac CT. However, there was an increase in hybrid nuclear imaging with CT, such as SPECT-CT and PET-CT, which made up 16% of nuclear procedures in 2016. PET-CT for tumor imaging rose from 1.3 million in 2006 to 1.9 million in 2016, while SPECT-CT exams were estimated at 315,000 in 2016. The collective effective dose from nuclear medicine decreased by 40%, and the average individual effective dose decreased by 44% in the U.S. due to fewer nuclear exams being performed. The report also covers trends in interventional procedures, dental radiography, and radiation oncology procedures.
The " Analysis of Diagnostic Imaging Procedure Volumes/Number of Studies by Modality: 2018-2030" trend report by Grand View Research delivers an in-depth analysis of the number of diagnostic imaging studies and procedures performed in the United States from 2018 to 2030. This extensive report evaluates the volume of imaging studies for each modality, including X-ray, CT, MRI, Ultrasound, Nuclear Medicine Scans, and Mammography. It also provides a detailed breakdown by end user segments, encompassing hospitals and specialty clinics, diagnostic imaging centers/outpatient facilities, and other end users.
The term "Number of Studies/Number of Procedures" refers to the total count of imaging captures or sets of images interpreted for specific diagnostic purposes. A single study may include multiple scans or images, depending on the clinical requirements.
Furthermore, the report features analyst perspectives and an executive summary, offering insights into the current and anticipated growth in imaging study volumes. It also explores the factors driving this growth, presenting a comprehensive overview of the trends and dynamics within the U.S. diagnostic imaging market.
Attributes
Details
Report Coverage
Diagnostic Imaging Studies/Procedural Volume for U.S.
Report Study Period
2018 to 2030
Report Representation
Diagnostic Imaging Studies Database (Excel Sheet)
Executive Summary (PDF Format)
Contents of Report
Diagnostic Imaging Studies/Procedural Volume Database for U.S., By Modality and by End User
- Number of X-ray Procedures in the U.S. by:
- Hospitals and Specialty Clinics
- Diagnostic Imaging Centers/Outpatient Facilities
- Others
- Number of CT Procedures in the U.S. by:
- Hospitals and Specialty Clinics
- Diagnostic Imaging Centers/Outpatient Facilities
- Others
- Number of Nuclear Medicine Procedures in the U.S. by:
- Hospitals and Specialty Clinics
- Diagnostic Imaging Centers/Outpatient Facilities
- Others
- Number of MRI Procedures in the U.S. by:
- Hospitals and Specialty Clinics
- Diagnostic Imaging Centers/Outpatient Facilities
- Others
- Number of Ultrasound Procedures in the U.S. by:
- Hospitals and Specialty Clinics
- Diagnostic Imaging Centers/Outpatient Facilities
- Others
- Number of Mammography Procedures in the U.S. by:
- Hospitals and Specialty Clinics
- Diagnostic Imaging Centers/Outpatient Facilities
- Others
Share this report with your colleague or friend.
GET A FREE SAMPLE
This FREE sample includes market data points, ranging from trend analyses to market estimates & forecasts. See for yourself.
![gvr icn]()
NEED A CUSTOM REPORT?
We can customize every report - free of charge - including purchasing stand-alone sections or country-level reports, as well as offer affordable discounts for start-ups & universities.
Contact us now to get our best pricing.
![esomar icon]()
ESOMAR certified & member
![ISO]()
ISO Certified
We are GDPR and CCPA compliant! Your transaction & personal information is safe and secure. For more details, please read our privacy policy.
-
We are committed towards customer satisfaction, and quality service.
Client Testimonials

"The quality of research they have done for us has been excellent..."
ISO Certified


