Mergers and Acquisitions
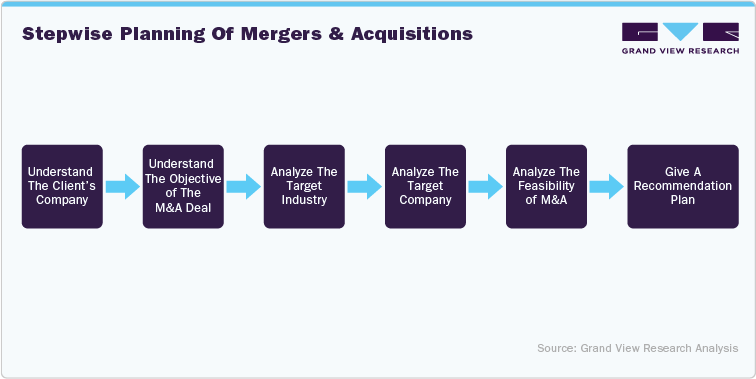
Mergers & acquisitions comprise of various steps ranging from planning, research, due diligence, negotiation, closing, and implementation. The key steps involved in mergers and acquisitions are:
-
Decoding the reason for the merger or acquisition
-
Quantifying the specific goal or target of the transaction
-
Panning out the merger and acquisition framework and work through the transaction
-
Delivering recommendations and strategizing the next plan of action
Mergers And Acquisitions Framework Analysis
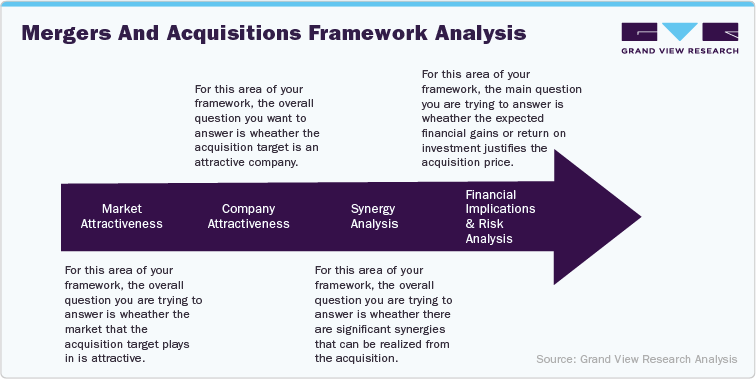
Detailed Insights: Market Attractiveness
|
Factors Influencing the Market Attractiveness |
|
Market Size: Estimated and Forecasted |
|
Market Growth Rate: Short Term vs Long Term |
|
Industry Profitability |
|
Average Profit Margins in Market |
|
Porter's 5 Forces & Impact on Market |
Various parameters such as market size, market growth rate, industry profit margins, and Porter’s 5 Forces were taken into consideration and these parameters were scored based on their performance and relevance held in the matrix. Amongst the parameters considered the most crucial parameters influencing the matrix score are market growth rates (short term and long term) and industry profitability.
|
Market Attractiveness of Telehealthcare/ Telemedicine/ Teleconsultation Industry |
|||||||
|
Parameters |
Sub-Parameter |
Unit |
Data |
Benchmark |
Score Given |
Total Score |
Individual Parameter Score (%) |
|
Market Size (2023) |
|
USD Billion |
4.11 |
40 |
10.275 |
100 |
10.3% |
|
Market Forecast (2030) |
|
USD Billion |
30.47 |
40 |
76.175 |
100 |
76.2% |
|
Market Growth Rate |
Overall Compound Annual Growth Rate (2024-30) |
% |
33.40% |
50% |
66.8 |
100 |
66.8% |
|
Short Term Compound Annual Growth Rate (2024-27) |
% |
23.60% |
50% |
16.52 |
35 |
47.2% |
|
|
Long Term Compound Annual Growth Rate (2027-30) |
% |
34.10% |
50% |
44.33 |
65 |
68.2% |
|
|
Average Profit Margins of Telehealthcare/ Telemedicine/ Teleconsultation Industry (EBITDA) |
|
% |
|
|
|
100 |
0.0% |
|
2023-2026 |
% |
(50.33%)-(15.33%) |
12% |
-57.4875 |
45 |
|
|
|
2027-2030 |
% |
(10.33%)-5.67% |
12% |
25.9875 |
55 |
47.3% |
|
|
Porter 5 Forces |
|
|
|
|
83 |
100 |
83.0% |
|
Buyer Power |
|
Moderate |
|
14 |
20 |
70.0% |
|
|
Supplier Power |
|
Moderate |
|
15 |
20 |
75.0% |
|
|
New Entrants Threat |
|
Low |
|
18 |
20 |
90.0% |
|
|
Substitutes Threat |
|
Moderate |
|
16 |
20 |
80.0% |
|
|
Competitive Rivalry |
|
High |
|
20 |
20 |
100.0% |
|
|
|
Total |
|
|
|
204.75 |
500 |
41.0% |
In the above-mentioned table, we have drawn insights from an exhaustive market study on the Telehealthcare/Telemedicine/Teleconsultation industry. The market attractiveness analysis, provides an answer whether the industry the acquisition target plays is attractive or not, also provides insights about the industry profitability, while estimating the total addressable market (TAM). Within this analysis, we have assigned weighted scores as per their relevant impact on shaping the merger & acquisition.
Detailed Insights: Company Attractiveness
|
Factors Influencing the Company Attractiveness |
|
Company Revenue Performance & Profitability (Net Income, Gross Margin, EBIDTA) |
|
Financial Valuation of Company |
|
Company Profitability |
|
SWOT Analysis of Company |
|
Company Growth Rate (Past 5 Years) |
|
Direct & Indirect Competition (Fragmented/ Consolidated) |
|
Company Differentiation & Competitive Advantages |
Within the company attractiveness analysis, the business matrix or competition/product matrix (intangibles) and the financial matrix (tangibles) are analyzed. The financial matrix includes various parameters such as the topline, bottom line, revenue earnings, gross margins, cost of goods sold (COGS), customer acquisition costs (CAC), EBIDTA, net income, historical revenue growth rates, and other unit economies. Similarly, the business or competition matrix analysis is composed of qualitative insights derived from company differentiation, SWOT analysis, competitive advantages, competitive landscape scenario (direct vs indirect)
|
Category |
Parameter |
Unit |
Company A |
Company B |
Company C |
Company D |
|
|
Revenue Performance and Company Profitability |
Revenue |
2019 |
USD Mn |
553.31 |
xx |
xx |
xx |
|
2020 |
USD Mn |
xx |
xx |
xx |
xx |
||
|
2021 |
USD Mn |
xx |
xx |
xx |
xx |
||
|
2022 |
USD Mn |
xx |
xx |
xx |
xx |
||
|
2023 |
USD Mn |
xx |
xx |
xx |
xx |
||
|
Revenue Y-o-Y Growth |
2020 |
% |
97.7% |
xx |
xx |
xx |
|
|
2021 |
% |
xx |
xx |
xx |
xx |
||
|
2022 |
% |
xx |
xx |
xx |
xx |
||
|
2023 |
% |
xx |
xx |
xx |
xx |
||
|
Revenue 5 Year Growth Rate |
Compounded Annual Growth Rate (2019-2023) |
% |
47.3% |
xx |
xx |
xx |
|
|
Average Annual Growth Rate (2019-2023) |
% |
xx |
xx |
xx |
xx |
||
|
Revenue Forecast (2024-2030) USD Million |
|
|
Revenue |
Revenue |
Revenue |
Revenue |
|
|
|
2024 |
xx |
xx |
xx |
xx |
||
|
|
2025 |
xx |
xx |
xx |
xx |
||
|
|
2026 |
xx |
xx |
xx |
xx |
||
|
|
2027 |
xx |
xx |
xx |
xx |
||
|
|
2028 |
xx |
xx |
xx |
xx |
||
|
|
2029 |
xx |
xx |
xx |
xx |
||
|
|
2030 |
xx |
xx |
xx |
xx |
||
|
Net Loss |
|
|
Net Loss |
Net Loss |
Net Loss |
Net Loss |
|
|
2019 |
USD Mn |
xx |
xx |
xx |
xx |
||
|
2020 |
USD Mn |
xx |
xx |
xx |
xx |
||
|
2021 |
USD Mn |
xx |
xx |
xx |
xx |
||
|
2022 |
USD Mn |
xx |
xx |
xx |
xx |
||
|
2023 |
USD Mn |
xx |
xx |
xx |
xx |
||
|
EBITDA (Earnings Before Interest, Taxes, Depreciation, and Amortization) |
2019 |
USD Mn |
xx |
xx |
|
xx |
|
|
2020 |
USD Mn |
xx |
xx |
xx |
xx |
||
|
2021 |
USD Mn |
xx |
xx |
xx |
xx |
||
|
2022 |
USD Mn |
xx |
xx |
xx |
xx |
||
|
2023 |
USD Mn |
xx |
xx |
xx |
xx |
||
|
EBITDA Y-o-Y Growth |
2019 |
% |
|
|
|
|
|
|
2020 |
% |
xx |
xx |
xx |
xx |
||
|
2021 |
% |
xx |
xx |
467.1% |
xx |
||
|
2022 |
% |
xx |
xx |
xx |
xx |
||
|
2023 |
% |
xx |
xx |
xx |
xx |
||
|
EBITDA 5 Year Growth Rate |
Compounded Annual Growth Rate (2019-2023) |
% |
xx |
xx |
xx |
xx |
|
|
Average Annual Growth Rate (2019-2023) |
% |
425.7% |
xx |
xx |
-213.0% |
||
|
EBIDTA Margin |
2019 |
% |
|
xx |
|
xx |
|
|
2020 |
% |
-40% |
xx |
xx |
xx |
||
|
2021 |
% |
-3% |
xx |
xx |
xx |
||
|
2022 |
% |
0% |
xx |
xx |
xx |
||
|
2023 |
% |
3% |
xx |
xx |
xx |
||
|
Company Revenue Growth Rate (5 Years) |
Compounded Annual Growth Rate (2019-2023) |
% |
47.3% |
xx |
xx |
xx |
|
|
Average Annual Growth Rate (2019-2023) |
% |
52.5% |
xx |
xx |
xx |
||
|
Operating Costs |
2019 |
USD Mn |
xx |
xx |
xx |
xx |
|
|
2020 |
USD Mn |
xx |
xx |
xx |
xx |
||
|
2021 |
USD Mn |
xx |
xx |
xx |
xx |
||
|
2022 |
USD Mn |
xx |
xx |
xx |
xx |
||
|
2023 |
USD Mn |
xx |
xx |
xx |
xx |
|
Valuation |
Latest Valuation of Company |
Revenue Multiplier |
|||||
|
2023 |
USD Mn |
xx |
xx |
xx |
xx |
||
|
Acquisition Cost |
USD Mn |
xx |
xx |
xx |
xx |
||
|
User Base Multiplier |
|||||||
|
2023 |
USD Mn |
xx |
xx |
xx |
xx |
||
|
Acquisition Cost |
USD Mn |
xx |
xx |
xx |
xx |
||
In the above-mentioned table, we have drawn insights from a comparative analysis amongst selective market players from the industry eligible/willing for merger & acquisition. The market valuation of every company was drawn by analyzing the various financial parameters and competitive landscape parameters. The market valuation analysis was derived using the revenue multipliers as well as user base multipliers, which led to deriving the acquisition cost of each company.
The comparative analysis along with the financial metrics and competitive landscape metrics, enables setting benchmarks for the target company that is eligible for merger and/or acquisition.
Detailed Insights: Synergy Analysis
|
Types of Synergies |
||
|
Revenue Synergies |
Cost Synergies |
|
|
Revenue synergies help the company increase revenues. |
Cost synergies help the company reduce overall costs. |
|
|
Examples |
||
|
Accessing New Distribution Channels |
Consolidating Redundant Costs |
|
|
Accessing New Customer Segments |
Procuring Increased Buyer Power |
|
|
Cross-Selling Products |
Procuring Increased Buyer Power |
|
|
Up-Selling Products |
|
|
|
Bundling Products |
|
|
Within the synergy analysis, the significant synergies involved in the transaction are studied. Several revenue synergies and cost synergies are analyzed, which can be realized from the transaction.
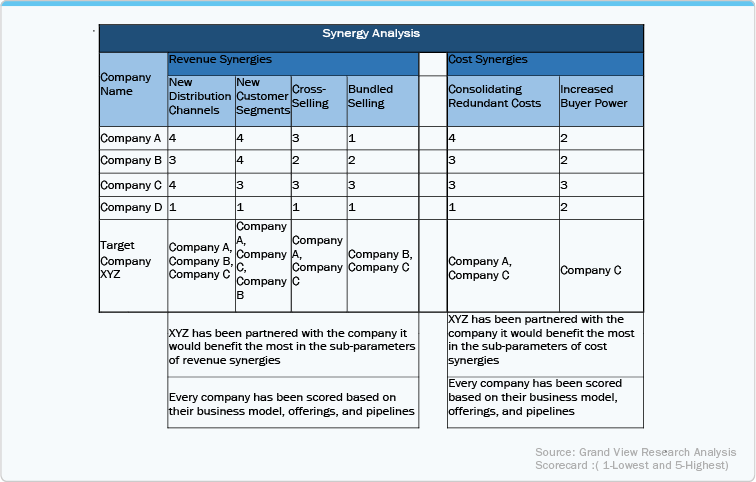
In the above-mentioned table, a comparative analysis is drawn by scoring the companies under the study scope against various parameters under revenue synergies and cost synergies. This analysis allows, matching of the goals & attributes of the target company with the benchmarked companies.
Detailed Insights: Financial Implications and Risk Analysis
|
Financial Implications |
Risk Analysis |
|
|
Acquisition Price Analysis & Justification |
Internal Risk Factors |
External Risk Factors |
|
Break Even Analysis |
||
|
Annual Revenue Growth Rate |
Inadequate Due Diligence |
Legal And Regulatory Risks |
|
Overpayment For Market Volatility |
Market Volatility |
|
|
Expected Cost Savings |
Integration Challenges |
Geopolitical Risks |
|
Cultural Misalignment |
Economic And Financial Risks |
|
|
Projected Return on Investment |
Technological Disruptions |
|
|
Industry Threats |
|
|
|
Market Entry Barriers |
|
|
The financial implications and risk analysis framework, answers the main question whether the expected financial gains, return on investment, and risks involved justify the acquisition price.
|
Company Name |
Financial Implications |
||||||
|
Annual Revenue Growth Rate (2019-2023) (%) |
EBITDA (2023) (USD Million) |
Break Even Analysis |
Projected Return on Investment |
Acqusition Price Analysis |
Expected Cost Savings |
||
|
AAGR |
CAGR |
||||||
|
Company A |
xx |
xx |
xx |
xx |
xx |
xx |
xx |
|
Company B |
xx |
xx |
xx |
xx |
xx |
xx |
xx |
|
Company C |
xx |
xx |
xx |
xx |
xx |
xx |
xx |
|
Company D |
xx |
xx |
xx |
xx |
xx |
xx |
xx |
|
Total Score |
|
|
|
xx |
xx |
xx |
xx |
|
XYZ |
|
|
|
|
|
|
|
In the above-mentioned table, by implementing a comparative analysis, companies have been benchmarked by scoring against several parameters such as average annual growth rate (AAGR), compounded annual growth rate (CAGR), company profitability, breakeven point, projected return on investment, acquisition price, and expected cost savings.
|
Company Name |
Risk Analysis |
||||||||
|
Internal Risks |
External Risks |
||||||||
|
Integration Challenges |
Cultural Misalignment |
Industry Threats |
Market Entry Barriers |
Legal & Regulatory |
Market Volatility |
Geopolitical Risks |
Economic & Financial Risks |
Technological Disruptions |
|
|
Company A |
4 |
3 |
2 |
3 |
2 |
2 |
3 |
3 |
4 |
|
Company B |
3 |
3 |
2 |
3 |
2 |
2 |
3 |
2 |
3 |
|
Company C |
2 |
2 |
1 |
2 |
2 |
1 |
2 |
3 |
3 |
|
Company D |
2 |
2 |
1 |
2 |
1 |
1 |
1 |
2 |
2 |
|
Total Sore |
|
|
|
|
|
|
|
|
|
|
XYZ |
|
|
|
|
|
|
|
|
|
This parameter is analyzed by using a comparative scorecard analysis basis of various factors impacting the risk involved.
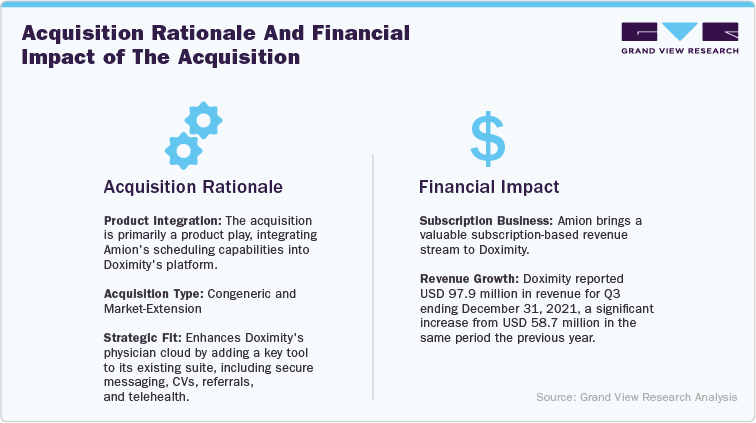
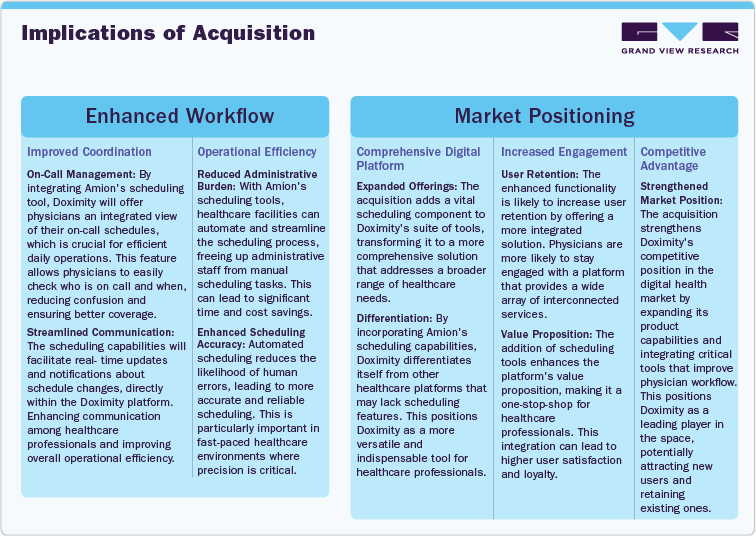
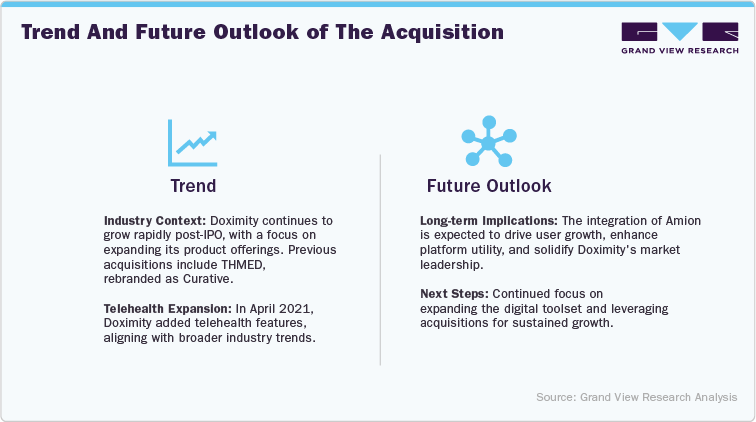
Case Study Analysis: Doximity Acquires Amion
Case Study Title: DOximity’s strategic acquisition of Amion, to enhance the physician cloud platform
Objective: To explore the rationale, impact, and future implications of the acquisition on Doximity;s growth and market position.
Company Introductions
|
Doximity |
Amion |
|
Doximity, Inc., is a digital platform specifically designed for medical professionals. It provides a suite of tools and services to help them connect, communicate, and collaborate more efficiently. The platform combines elements of social networking with professional resources to forge a unique space where healthcare professionals can stay informed, share insights, and maintain their professional relationships. Doximity was formerly known as 3MD Communications, Inc. and was founded in 2010. Headquarters: U.S. Employee Count (2024): 827 |
AMiON, a company specializing in scheduling solutions for medical staff and doctors on call, is known for its comprehensive software that streamlines the process of creating and managing complex medical schedules. Their platform serves a critical role in healthcare settings, ensuring that staffing matches the fluctuating demands of patient care effectively and efficiently. Amion's software provides: A user-friendly interface. Allowing easy access and adjustments to schedules by both administrators and staff members. Thus fostering a more organized and collaborative environment. This functionality is particularly important in the fast-paced medical field, where the accurate scheduling of doctors on call can significantly impact both patient care and staff well-being. |
