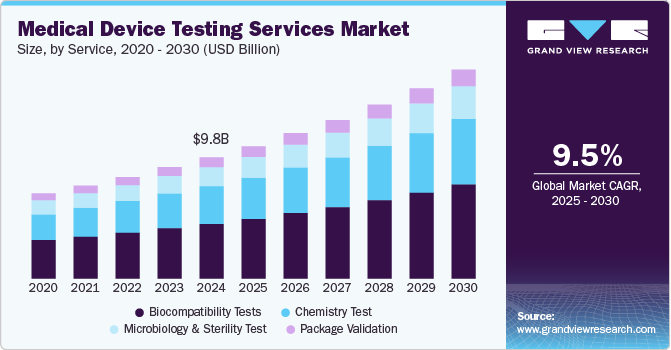
The global medical device testing services market size was valued at USD 9.76 billion in 2024 and is expected to grow at a CAGR of 9.49% from 2025 to 2030. Complexity in product design, intensifying competition, increasing number of small-sized medical device manufacturers, and strict approval norms are key factors driving the market growth. Currently, the medical device industry is witnessing fierce competition where companies use offensive and defensive marketing strategies to sustain short- & long-term competition. Key strategies include new product launches, extensive R&D, competitive pricing, collaborative development, regional expansion, and mergers & acquisitions.
Moreover, intense competition requires rapid product development and market entry. Medical device testing services are crucial in expediting the regulatory approval process. Stringent product approval processes for medical devices induce medical device companies to outsource testing services to specialized firms, thereby accelerating market demand. Thus, service providers offering efficient and timely testing contribute to reducing time-to-market for medical devices and offering companies a competitive advantage.
In addition, favorable government support is expected to drive the market. To obtain approvals & clearances, companies need to comply with an elaborate list of standards provided by regulatory bodies and maintain complete documentation of the same. These requirements must be met as per the stipulated formats and specifications to ensure the products are permitted for sale. The regulatory authorities also perform routine post-market surveillance by levying a fee on the manufacturer. Receipt of any complaints about drawbacks of the product can entail its withdrawal from the market, thereby proving the stringent nature of the regulations governing these procedures.
Moreover, a large number of medical device companies have outsourced testing operations to minimize business risks, hasten product market entry, and reduce costs. This leads to a significant rise in expenditure levels. Therefore, medical device OEMs are rapidly switching to outsourcing an effective cost-cutting approach. Implantable Medical Devices (IMDs) are increasingly used to improve patients' medical outcomes. Designers of IMDs have to balance complexity, reliability, power consumption, and costs. Consequently, companies are shifting their focus to innovation rather than noncore activities, outsourcing the latter to launch efficient devices. All these factors are expected to boost the medical device testing services industry over the forecast period.
Further, increasing capital investment among small companies to establish in-house testing facilities requires substantial capital investment in equipment, skilled personnel, and compliance with regulatory standards. Outsourcing testing services allows SMEs to avoid these high upfront costs, making it a more cost-effective option. Moreover, outsourcing testing services can expedite the product development process for small medical device companies. Companies can reduce their time-to-market and gain a competitive edge by relying on external laboratories specializing in efficient and timely testing. Furthermore, the medical device industry must comply with stringent regulatory standards. Testing service providers are often well-versed in these regulations and have established protocols to ensure compliance. Small companies benefit from partnering with these providers to navigate complex regulatory landscapes.
The medical device testing services sector is expected to experience various opportunities due to the increasing complexity of medical technologies, the growth of personalized medicine, and expanding regulatory scrutiny. The rising adoption of digital health solutions, such as AI-driven diagnostics and software-as-a-medical-device (SaMD) is expected to drive demand for specialized software validation and cybersecurity testing. As home-use medical devices become more common, usability and human factors testing have emerged as critical areas of focus. In addition, emerging global market trends present new market growth opportunities as regulatory frameworks strengthen and local manufacturers grow their presence. Subsequently, the trend of outsourcing is expected to continue growing, supported by enhanced integrated service offerings, real-time compliance tracking, and rapid turnaround times.
Furthermore, the integration of AI and IoT into medical devices will increase the need for comprehensive lifecycle testing to ensure reliability, interoperability, and regulatory compliance. Therefore, growing demand for medical device testing to mitigate risks associated with in-house testing, offering flexibility in resource allocation, scalability, and access to a broader range of testing capabilities based on project requirements is further providing new growth opportunities for the market.
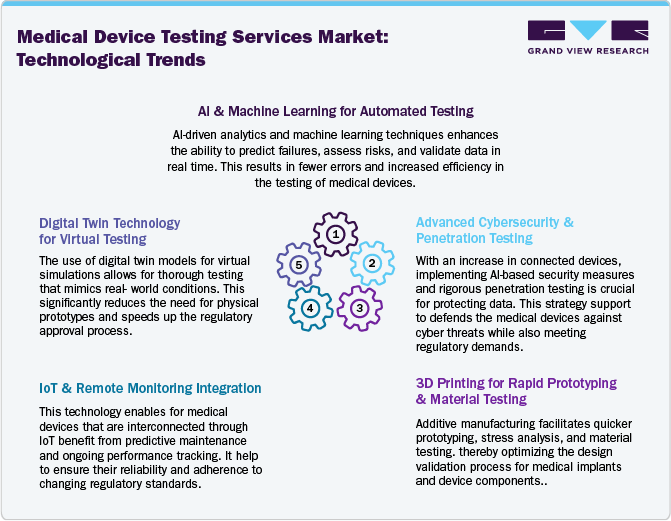
Outsourcing companies in the medical device testing industry are adopting advanced technologies to improve efficiency, accuracy, and regulatory compliance. Evolving medical device technologies, such AI and machine learning streamline risk assessment, failure analysis, and real-time data validation, while robotic process automation (RPA) ensures precise mechanical and endurance testing. Furthermore, ethical practices, including transparency, data privacy, and patient safety support to enhance credibility and trust among clients and stakeholders. In addition, cloud-based platforms enable real-time data sharing and regulatory compliance tracking for FDA, EU MDR, and ISO 13485. Digital twin technology allows virtual simulations, reducing reliance on physical prototypes, while IoT enhances predictive maintenance and real-time monitoring. Cybersecurity testing is also expanding with AI-driven threat detection. With 3D printing advancing material testing, outsourcing firms provide faster, cost-effective solutions, ensuring product safety, regulatory adherence, and accelerated market entry.
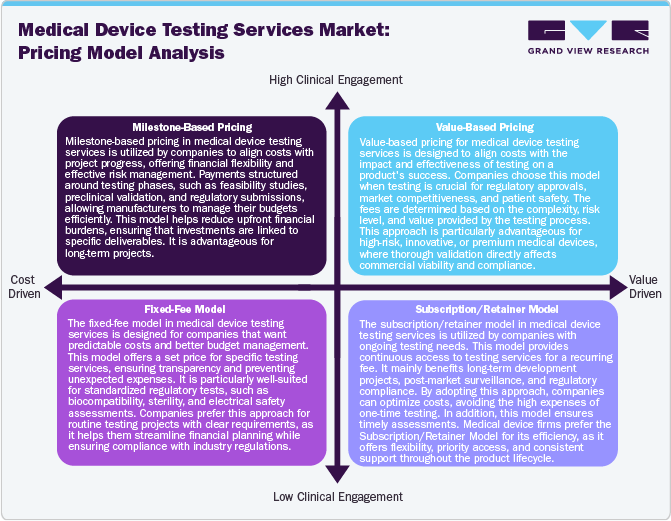
The market utilizes various pricing strategies to maximize cost efficiency and profitability while complying with regulatory standards. Milestone-based pricing structures payments around project phases, ensuring financial flexibility by aligning costs with development progress. This approach is suitable for long-term testing projects where costs can be distributed over the period of time Furthermore, the fixed-free model offers a predetermined price for specific testing services. This model enhances budget predictability and is particularly useful for standard regulatory assessments. Value-based pricing is gaining increasing attention, where fees are linked to the impact of testing on product success, particularly for high-risk or innovative medical devices requiring extensive validation. In addition, the subscription/retainer model provides ongoing access to testing services for a recurring fee, benefiting companies with continuous testing needs, such as post-market surveillance and iterative product development. Moreover, hybrid approach combining these models is emerging, allowing flexibility in cost management while enhancing testing quality, regulatory compliance, and profitability for service providers.
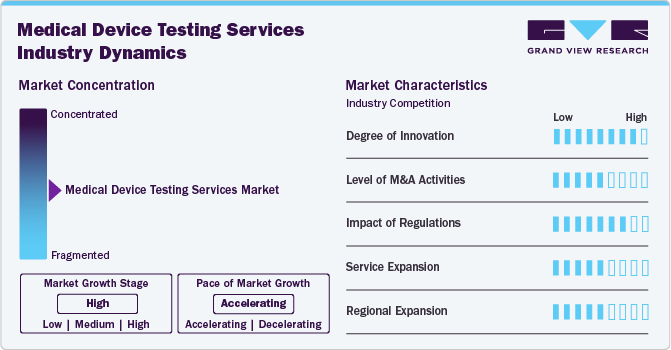
The market growth stage is medium, and growth is accelerating. The market is characterized by regulatory considerations, evolving technologies, materials innovation, and globalization & outsourcing of services.
ASCA's emphasis on conformity assessment encourages advancements in testing methodologies and technology adoption. Accredited labs are encouraged to continually improve and innovate, aligning with evolving regulatory expectations. Besides, innovations in testing technologies and methodologies, such as the adoption of AI, IoT, or robotics in testing processes, can significantly influence the medical device testing services industry.
Regulatory bodies, such as the U.S. FDA and EMA, continually upgrade the regulatory guidelines for safety, efficacy, & quality standards for medical devices. This growth in regulatory requirements compels medical device manufacturers to conduct more comprehensive and rigorous testing to meet these stringent standards. Thus, stringent approval norms necessitate specialized and extensive testing protocols.
The medical device testing services industry is highly competitive, characterized by numerous established and emerging players offering a wide array of testing services. Differentiation based on expertise, technology, regulatory compliance, and service quality is crucial for market positioning. Companies leveraging advanced types of medical device testing technologies and innovative methodologies gain a competitive edge. Investment in innovative equipment and the ability to offer specialized, high-value testing solutions strengthens market growth.
The medical device testing services industry is expanding due to rising regulatory requirements, technological advancements, and increasing complexity in device designs. Companies are outsourcing testing to specialized service providers to enhance compliance, accelerate market entry, and reduce costs. The market growth is driven by stringent quality standards, globalization of manufacturing, and demand for faster product approvals. Emerging markets and personalized medical devices further boost demand. Strategic partnerships and acquisitions among testing firms enhance capabilities, fostering competitive differentiation and global market penetration.
Changes in global healthcare trends, emerging markets, and shifts in research priorities are major factors impacting on the demand for medical device testing services. Besides, the growing presence of local market players along with competitive pricing, rapid technological advancements, growing demand for new & cost-effective medical devices, and high healthcare expenditure fuels the market growth.
On the basis of service segment, the market is classified into biocompatibility testing, chemistry testing, microbiology & sterility testing, and package validation. Biocompatibility tests held the largest share of 45.42% in 2024. The biocompatibility test plays a major role for medical devices to move medical devices successfully to market. The test is a critical step for medical device development where an assessment of biocompatibility helps medical device manufacturers ensure the device’s safety for patients & provides data that can be used to support regulatory compliance. In addition, stringent regulations, technological advancements, and a focus on personalized healthcare are expected to boost the growth of biocompatibility testing within the medical device testing services industry. Moreover, biocompatibility tests help to determine the potential toxicity of a material resulting from contact of devices or products with the body. Such tests are performed to ensure the safety of devices. In addition, the tests comply with the guidelines issued by various organizations such as FDA & ISO.
Besides, the chemistry test segment is expected to grow at a lucrative CAGR of 9.77%. Chemistry tests support the medical device industry throughout the value chain. These tests ensure that medical devices do not cause reactions when in contact with the human body. The tests check if any solutes and/or chemicals are present on the surface of medical devices, which may leach out into the surroundings when used with the intended liquids. Besides, the test is used for regulatory submissions while remaining flexible to deliver against rapid problem-solving, manufacturing quality control & internal medical device component R&D requirements. These tests support the review of the safety parameters of medical devices. Hence, the FDA is facilitating additional data analysis of polymer & colorant examinations to provide a more holistic view of the safety of these tests. This is expected to positively impact the segment growth over the forecast period.
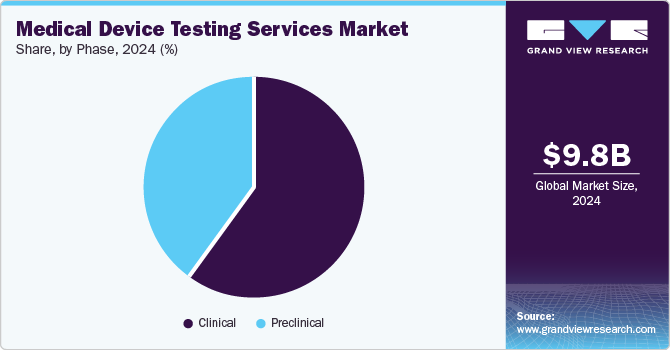
On the basis of phase segment, the market is segregated into preclinical and clinical. The clinical segment accounted for the largest market share in 2024. The segment growth is due to a rise in product pipeline and continuous upgradation of regulatory standards. Growing emphasis on clinical evidence for new device approvals accelerates the demand for robust testing services during clinical trials. Moreover, the growing preference for market participants that offer advanced testing methodologies with affordable cost & reduced turnaround time for diverse clinical studies is expected to drive segment growth.
The preclinical market segment is expected to grow at the fastest CAGR over the forecast period. The preclinical is further segment into small animals, large animals, and others. Preclinical testing is crucial in the development & evaluation of medical devices before they are approved for human use. Leading CROs like Charles River Laboratories provide biocompatibility, safety testing, and pathology services during this stage. For devices and high-risk medical devices that lack appropriate clinical data, preclinical tests are conducted to demonstrate compliance with the requirements for CE marking. These tests determine the efficacy, safety, and performance of the devices, to mitigate potential risks & enhance patient outcomes. Moreover, among small animals, and large animals, the demand for small animal research is increasing due to the rise of domestic medical device manufacturers putting more effort into developing medical devices that can be used for such research. Besides, it helps address regulatory safety concerns and reduce risks associated with product validation, which further contributes to market growth.
The North America Medical Device Testing Services market is projected to grow at the fastest CAGR over the forecast period. The market growth is due to continuous growth owing to the presence of established manufacturing hubs of highly reliable, complex, and high-end medical devices in the region. In addition, many Original Equipment Manufacturers (OEMs) have shifted their focus to electronics manufacturing service providers to efficiently handle the increasing volume of electronic components in current medical devices. This has led to the rise in demand for medical device testing activities for efficient healthcare in the region and is expected to be one of the major factors propelling the development of the market.
The Medical Device Testing Services market in the U.S. held the largest market in North America. This can be attributed to the presence of established companies offering medical device testing services for medical devices within the U.S. Moreover, medical device testing services enable medical device companies to focus on their core capabilities, share associated risks, and improve device delivery, which helps companies gain competitive advantages. In addition, the country has witnessed positive growth in the demand for medical devices due to innovations, product launches, and the acquisition of international medical device testing services to expand reach globally. For instance, in January 2025, NAMSA has announced its acquisition of WuXi AppTec's medical device testing operations in the U.S. This includes facilities located in Minnesota and Georgia. The acquisition will accelerate innovation in the MedTech sector and assist sponsors in delivering life-saving medical technologies across the globe.
Europe Medical Device Testing Services market is driven by the presence of advanced technologies as well as well-established infrastructure. Currently the medical device testing services are witnessing rising demand due extensive knowledge of complexity in product design among market players that are seeking entry into the European market. In addition, small & mid-sized medical device companies have rising requirements for medical device testing services for the performance and safety of medical devices in the region. In addition, the market is expected to grow lucratively due to stringent regulatory policies.
The UK Medical Device Testing Services market is anticipated to grow significantly over the forecast period. The country's market growth is due to the presence of various medical device companies, growing R&D investments, presence of well-established healthcare infrastructure, high healthcare spending, and rapidly evolving demand for medical device testing for the development of new devices.
The Medical Device Testing Services market in Germany held a significant share in 2024. The country's growth is due to increasing demand for medical device testing outsourcing. In addition, various benefits associated with medical outsourcing are optimization of R&D activities for higher productivity & greater regulatory compliance, which significantly enable for easy penetration into the market.
Asia Pacific accounted for the largest market share of 41.18% in 2024. The evolving medical device testing services are expected to increase the market demand in the region, owing to established healthcare infrastructure with government initiatives. Furthermore, the presence of a large & diverse patient pool and demand for affordable treatment options are supporting market growth. In addition, the presence of well-established medical device companies in the region and increasing number of collaborative partnerships & strategic alliances are creating growth opportunities in the market. Moreover, government initiatives such as tax exemption and revamping regulatory policies are fueling market growth in Asia Pacific.
The Medical Device Testing Services market in China is expected to grow over the forecast period. In recent years, China has been one of the biggest attractions for the medical device testing services market owing to rapid technological advancements, growing demand for new & cost-effective medical devices, & high healthcare expenditure. Other factors contributing to market growth are rising investments, growing medical devices industry, and high standards for medical device development in the country.
Japan Medical Device Testing Services market is witnessing significant growth over the forecast period. The market's growth is due to the growing medical devices industry, rapid technological advancements, increasing demand for outsourcing services, and rising healthcare expenditure. In addition, the expanding service portfolio for preventive care is boosting the requirement for medical device testing services market.
India Medical Device Testing Services market is witnessing considerable growth as the country is the preferred sites for medical device companies to outsource their medical device testing services to due to its diversified patient pool, lower costs of labor, improved healthcare infrastructure, and availability of large number of technical experts. Moreover, growing investments from overseas firms for R&D are expected to further support market growth over the forecast period.
Market players are undertaking various strategic initiatives, such as the launch of new product partnerships, collaborations, and mergers & acquisitions, to strengthen their service portfolio and provide a competitive advantage. For instance, in January 2025, STEMart announced the expansion of its medical device testing capabilities by introducing Balloon Catheter Testing Services. These new testing services are designed to help ensure the development of safe medical devices, meeting the industry's compliance requirements and assisting manufacturers in minimizing compliance risks.
The following are the leading companies in the medical device testing services market. These companies collectively hold the largest market share and dictate industry trends.
View a comprehensive list of companies in the Medical Device Testing Services Market.
In January 2025, IMQ Group launched Elettra Tech Labs in India as a joint venture that provide testing & inspection services for medical devices and electrical and electronic products. Such service expansions strengthened company’s offerings in the significant market.
In March 2024, Stryker expanded its prototype and testing facility in India, representing a major step in enhancing its research and development footprint in the country. This advanced facility spans 55,600 square feet integrates cutting-edge infrastructure along with improved microbiology capabilities. This expansion broadened company’s operational capabilities in the market.
In June 2023, TÜV SÜD opened a new laboratory in Minnesota. It is ISO 17025 accredited for the biological & chemical testing of medical devices. It is a part of the company’s commitment to providing high-quality medical device services.
Report Attribute |
Details |
Market size value in 2025 |
USD 10.66 billion |
Revenue forecast in 2030 |
USD 16.78 billion |
Growth rate |
CAGR of 9.49% from 2025 to 2030 |
Historical Year |
2018 - 2024 |
Forecast period |
2025 - 2030 |
Quantitative units |
Revenue in USD million and CAGR from 2025 to 2030 |
Report coverage |
Revenue forecast, company ranking, competitive landscape, growth factors, and trends |
Segments covered |
Service, phase, region |
Regional scope |
North America, Europe, Asia Pacific, Latin America, MEA |
Country scope |
U.S.; Canada; Mexico; UK; Germany; France; Italy; Spain; Denmark; Sweden; Norway; Netherlands; Belgium; Switzerland; Japan; China; India; Australia; South Korea; Malaysia; Indonesia; Singapore; Philippines; Thailand; Brazil; Argentina; Colombia; Chile; South Africa; Saudi Arabia; UAE; Kuwait; Israel; Egypt |
Key companies profiled |
SGS SA; Nelson Laboratories, LLC; Laboratory Corporation of America Holdings; TÜV SÜD; Charles River Laboratories; Eurofins Scientific; Element Minnetonka; Pace Analytical Services LLC; Intertek Group Plc; North America Science Associates Inc. (NAMSA) (WuXi AppTec) |
Customization scope |
Free report customization (equivalent up to 8 analysts working days) with purchase. Addition or alteration to country, regional & segment scope. |
Pricing and purchase options |
Avail customized purchase options to meet your exact research needs. Explore purchase options |
This report forecasts revenue growth at global, regional, and country levels and provides an analysis of the latest industry trends in each of the sub-segments from 2018 to 2030. For this study, Grand View Research has segmented the global medical device testing services market report based on service, phase and region:
Service Outlook (Revenue, USD Million; 2018 - 2030)
Biocompatibility Tests
Cardiovascular Device's Biocompatibility Tests
Orthopedic Device's Biocompatibility Tests
Dental Implant Devices' Biocompatibility Tests
Dermal Filler's Biocompatibility Tests
General Surgery Implantation Devices Biocompatibility Tests
Neurosurgical Implantation Devices Biocompatibility Tests
Ophthalmic Implantation Device's Biocompatibility Tests
Others
Chemistry Test
Chemical characterization (E&L)
Analytical method development and validation
Toxicological Risk Assessment and consulting
Microbiology & Sterility Test
Bioburden Determination
Pyrogen & Endotoxin Testing
Sterility Test & Validation
Antimicrobial Testing
Others
Package Validation
Phase Outlook (Revenue, USD Million; 2018 - 2030)
Preclinical
Large animal research
Biocompatibility Tests
Chemistry Test
Microbiology & Sterility Test
Small animal research
Biocompatibility Tests
Chemistry Test
Microbiology & Sterility Test
Clinical
Regional Outlook (Revenue, USD Million; 2018 - 2030)
North America
U.S.
Canada
Mexico
Europe
UK
Germany
France
Italy
Spain
Denmark
Sweden
Norway
Netherlands
Belgium
Switzerland
Asia Pacific
Japan
China
India
Australia
South Korea
Malaysia
Indonesia
Singapore
Philippines
Thailand
Latin America
Brazil
Argentina
Colombia
Chile
Middle East & Africa
South Africa
Saudi Arabia
UAE
Kuwait
Israel
Egypt
b. The global medical device testing services market size was estimated at USD 9.76 billion in 2024 and is expected to reach USD 10.66 billion in 2025.
b. The global medical device testing services market is expected to grow at a compound annual growth rate of 9.49% from 2025 to 2030 to reach USD 16.78 billion by 2030.
b. Asia Pacific dominated the medical device testing services market with a share of 41.18% in 2024. This is attributable to stringent regulatory requirements, growing healthcare infrastructure, and increasing medical device production. Rising demand for cost-effective outsourcing, technological advancements, and strong government support further fuel regional expansion. Additionally, the region's growing aging population and increased adoption of advanced medical technologies boost the need for thorough testing services.
b. Some key players operating in the medical device testing services market include SGS SA, Nelson Laboratories, LLC, Laboratory Corporation of America Holdings, TÜV SÜD, Charles River Laboratories, Eurofins Scientific, Element Minnetonka, Pace Analytical Services LLC, Intertek Group Plc, North America Science Associates Inc. (NAMSA).
b. Key factors that are driving the market growth include a by stringent regulatory requirements, increasing device complexity, and the need for faster product approvals. Rising outsourcing trends, technological advancements, and globalization of manufacturing further accelerating market demand. Growth in personalized and connected medical devices, along with expanding healthcare infrastructure in emerging markets, also contributes to the industry's expansion.
Table of Contents
Chapter 1. Research Methodology and Scope
1.1. Market Segmentation & Scope
1.2. Segment Definitions
1.2.1. Service
1.2.2. Phase
1.3. Research Methodology
1.4. Information Procurement
1.4.1. Purchased Database
1.4.2. GVR’s Internal Database
1.4.3. Secondary Sources
1.4.4. Primary Research
1.5. Information Or Data Analysis
1.5.1. Data Analysis Models
1.6. Market Formulation & Validation
1.7. Model Details
1.7.1. Commodity Flow Analysis
1.7.2. Parent Market Analysis
1.8. List Of Secondary Sources
1.9. List Of Abbreviations
1.10. Objectives
Chapter 2. Executive Summary
2.1. Market Outlook
2.2. Segment Outlook
2.3. Competitive Insights
Chapter 3. Medical Device Testing Services Market Variables, Trends & Scope
3.1. Market Lineage Outlook
3.1.1. Parent Market Outlook
3.1.2. Related/Ancillary Market Outlook
3.2. Market Dynamics
3.2.1. Market Driver Analysis
3.2.1.1. Complexity in product design of medical device testing services
3.2.1.2. Intense Competition in Medical Device Industry
3.2.1.3. Increasing number of smaller Players lacking in-house testing capabilities
3.2.1.4. Strict Approval Norms
3.2.2. Market Restraint Analysis
3.2.2.1. Legal and Regulatory Issues
3.2.2.2. Delays in contractual obligations
3.3. Technological Advancements
3.4. Pricing Model Analysis
3.5. Market Analysis Tools
3.5.1. Porter’s Five Analysis
3.5.2. PESTEL by SWOT Analysis
3.5.3. COVID-19 Impact Analysis
Chapter 4. Medical Device Testing Services Market: Service Estimates & Trend Analysis
4.1. Medical Device Testing Services Market, By Service: Segment Dashboard
4.2. Medical Device Testing Services Market, By Service: Movement Analysis
4.3. Medical Device Testing Services Market Estimates & Forecasts, By Service, 2018 - 2030
4.4. Biocompatibility Tests
4.4.1. Biocompatibility Tests Market Estimates and Forecasts, 2018 - 2030 (USD Million)
4.4.2. Cardiovascular Device's Biocompatibility Tests
4.4.2.1. Cardiovascular Device's Biocompatibility Tests Market Estimates and Forecasts, 2018 - 2030 (USD Million)
4.4.3. Orthopedic Device's Biocompatibility Tests
4.4.3.1. Orthopedic Device's Biocompatibility Tests Market Estimates and Forecasts, 2018 - 2030 (USD Million)
4.4.4. Dental Implant Devices' Biocompatibility Tests
4.4.4.1. Dental Implant Devices' Biocompatibility Tests Market Estimates and Forecasts, 2018 - 2030 (USD Million)
4.4.5. Dermal Filler's Biocompatibility Tests
4.4.5.1. Dermal Filler's Biocompatibility Tests Market Estimates and Forecasts, 2018 - 2030 (USD Million)
4.4.6. General Surgery Implantation Devices Biocompatibility Tests
4.4.6.1. General Surgery Implantation Devices Biocompatibility Tests Market Estimates and Forecasts, 2018 - 2030 (USD Million)
4.4.7. Neurosurgical Implantation Devices Biocompatibility Tests
4.4.7.1. Neurosurgical Implantation Devices Biocompatibility Tests Market Estimates and Forecasts, 2018 - 2030 (USD Million)
4.4.8. Ophthalmic Implantation Device's Biocompatibility Tests
4.4.8.1. Ophthalmic Implantation Device's Biocompatibility Tests Market Estimates and Forecasts, 2018 - 2030 (USD Million)
4.4.9. Others
4.4.9.1. Others Market Estimates and Forecasts, 2018 - 2030 (USD Million)
4.5. Chemistry Test
4.5.1. Chemistry Test Market Estimates and Forecasts, 2018 - 2030 (USD Million)
4.5.2. Chemical characterization (E&L)
4.5.2.1. Chemical Characterization (E&L) Market Estimates and Forecasts, 2018 - 2030 (USD Million)
4.5.3. Analytical method development and validation
4.5.3.1. Analytical Method Development and Validation Market Estimates and Forecasts, 2018 - 2030 (USD Million)
4.5.4. Toxicological Risk Assessment and consulting
4.5.4.1. Toxicological Risk Assessment and Consulting Market Estimates and Forecasts, 2018 - 2030 (USD Million)
4.6. Microbiology & Sterility Testing
4.6.1. Microbiology & Sterility Testing Market Estimates and Forecasts, 2018 - 2030 (USD Million)
4.6.2. Bioburden Determination
4.6.2.1. Bioburden Determination Market Estimates and Forecasts, 2018 - 2030 (USD Million)
4.6.3. Pyrogen & Endotoxin Testing
4.6.3.1. Pyrogen & Endotoxin Testing Market Estimates and Forecasts, 2018 - 2030 (USD Million)
4.6.4. Sterility Test & Validation
4.6.4.1. Sterility Test & Validation Market Estimates and Forecasts, 2018 - 2030 (USD Million)
4.6.5. Antimicrobial Testing
4.6.5.1. Antimicrobial Testing Market Estimates and Forecasts, 2018 - 2030 (USD Million)
4.6.6. Others
4.6.6.1. Others Market Estimates and Forecasts, 2018 - 2030 (USD Million)
4.7. Package Validation
4.7.1. Package Validation Market Estimates and Forecasts, 2018 - 2030 (USD Million)
Chapter 5. Medical Device Testing Services Market: Phase Estimates & Trend Analysis
5.1. Medical Device Testing Services Market, By Phase: Segment Dashboard
5.2. Medical Device Testing Services Market, By Phase: Movement Analysis
5.3. Medical Device Testing Services Market Estimates & Forecasts, By Phase, 2018 - 2030
5.4. Preclinical
5.4.1. Preclinical Market Estimates and Forecasts, 2018 - 2030 (USD Million)
5.4.2. Small Animals
5.4.2.1. Small Animals Market Estimates and Forecasts, 2018 - 2030 (USD Million)
5.4.2.2. Biocompatibility Tests
5.4.2.2.1. Biocompatibility Tests Market Estimates and Forecasts, 2018 - 2030 (USD Million)
5.4.2.3. Chemistry Tests
5.4.2.3.1. Chemistry Tests Market Estimates and Forecasts, 2018 - 2030 (USD Million)
5.4.2.4. Microbiology & Sterility Tests
5.4.2.4.1. Microbiology & Sterility Tests Market Estimates and Forecasts, 2018 - 2030 (USD Million)
5.4.3. Large Animals
5.4.3.1. Large Animals Market Estimates and Forecasts, 2018 - 2030 (USD Million)
5.4.3.2. Biocompatibility Tests
5.4.3.2.1. Biocompatibility Tests Market Estimates and Forecasts, 2018 - 2030 (USD Million)
5.4.3.3. Chemistry Tests
5.4.3.3.1. Chemistry Tests Market Estimates and Forecasts, 2018 - 2030 (USD Million)
5.4.3.4. Microbiology & Sterility Tests
5.4.3.4.1. Microbiology & Sterility Tests Market Estimates and Forecasts, 2018 - 2030 (USD Million)
5.4.4. Others
5.4.4.1. Others Market Estimates and Forecasts, 2018 - 2030 (USD Million)
5.5. Clinical
5.5.1. Clinical Market Estimates and Forecasts, 2018 - 2030 (USD Million)
Chapter 6. Medical Device Testing Services Market: Regional Estimates & Trend Analysis
6.1. Regional Market Share Analysis, 2024 & 2030
6.2. Regional Market Dashboard
6.3. Global Regional Market Snapshot
6.4. North America
6.4.1. North America Market Estimates and Forecasts, 2018 - 2030 (USD Million)
6.4.2. U.S
6.4.2.1. Key Country Dynamics
6.4.2.2. Competitive Scenario
6.4.2.3. Regulatory Framework
6.4.2.4. U.S. Market Estimates and Forecasts, 2018 - 2030 (USD Million)
6.4.3. Canada
6.4.3.1. Key Country Dynamics
6.4.3.2. Competitive Scenario
6.4.3.3. Regulatory Framework
6.4.3.4. Canada Market Estimates and Forecasts, 2018 - 2030 (USD Million)
6.4.4. Mexico
6.4.4.1. Key Country Dynamics
6.4.4.2. Competitive Scenario
6.4.4.3. Regulatory Framework
6.4.4.4. Mexico Market Estimates and Forecasts, 2018 - 2030 (USD Million)
6.5. Europe
6.5.1. Europe Market Estimates and Forecasts, 2018 - 2030 (USD Million)
6.5.2. UK
6.5.2.1. Key Country Dynamics
6.5.2.2. Competitive Scenario
6.5.2.3. Regulatory Framework
6.5.2.4. UK Market Estimates and Forecasts, 2018 - 2030 (USD Million)
6.5.3. Germany
6.5.3.1. Key Country Dynamics
6.5.3.2. Competitive Scenario
6.5.3.3. Regulatory Framework
6.5.3.4. Germany Market Estimates and Forecasts, 2018 - 2030 (USD Million)
6.5.4. France
6.5.4.1. Key Country Dynamics
6.5.4.2. Competitive Scenario
6.5.4.3. Regulatory Framework
6.5.4.4. France Market Estimates and Forecasts, 2018 - 2030 (USD Million)
6.5.5. Italy
6.5.5.1. Key Country Dynamics
6.5.5.2. Competitive Scenario
6.5.5.3. Regulatory Framework
6.5.5.4. Italy Market Estimates and Forecasts, 2018 - 2030 (USD Million)
6.5.6. Spain
6.5.6.1. Key Country Dynamics
6.5.6.2. Competitive Scenario
6.5.6.3. Regulatory Framework
6.5.6.4. Spain Market Estimates and Forecasts, 2018 - 2030 (USD Million)
6.5.7. Denmark
6.5.7.1. Key Country Dynamics
6.5.7.2. Competitive Scenario
6.5.7.3. Regulatory Framework
6.5.7.4. Denmark Market Estimates and Forecasts, 2018 - 2030 (USD Million)
6.5.8. Sweden
6.5.8.1. Key Country Dynamics
6.5.8.2. Competitive Scenario
6.5.8.3. Regulatory Framework
6.5.8.4. Sweden Market Estimates and Forecasts, 2018 - 2030 (USD Million)
6.5.9. Norway
6.5.9.1. Key Country Dynamics
6.5.9.2. Competitive Scenario
6.5.9.3. Regulatory Framework
6.5.9.4. Norway Market Estimates and Forecasts, 2018 - 2030 (USD Million)
6.5.10. Netherlands
6.5.10.1. Key Country Dynamics
6.5.10.2. Competitive Scenario
6.5.10.3. Regulatory Framework
6.5.10.4. Netherlands Market Estimates and Forecasts, 2018 - 2030 (USD Million)
6.5.11. Belgium
6.5.11.1. Key Country Dynamics
6.5.11.2. Competitive Scenario
6.5.11.3. Regulatory Framework
6.5.11.4. Belgium Market Estimates and Forecasts, 2018 - 2030 (USD Million)
6.5.12. Switzerland
6.5.12.1. Key Country Dynamics
6.5.12.2. Competitive Scenario
6.5.12.3. Regulatory Framework
6.5.12.4. Switzerland Market Estimates and Forecasts, 2018 - 2030 (USD Million)
6.6. Asia Pacific
6.6.1. Asia Pacific Market Estimates and Forecasts, 2018 - 2030 (USD Million)
6.6.2. Japan
6.6.2.1. Key Country Dynamics
6.6.2.2. Competitive Scenario
6.6.2.3. Regulatory Framework
6.6.2.4. Japan Market Estimates and Forecasts, 2018 - 2030 (USD Million)
6.6.3. China
6.6.3.1. Key Country Dynamics
6.6.3.2. Competitive Scenario
6.6.3.3. Regulatory Framework
6.6.3.4. China Market Estimates and Forecasts, 2018 - 2030 (USD Million)
6.6.4. India
6.6.4.1. Key Country Dynamics
6.6.4.2. Competitive Scenario
6.6.4.3. Regulatory Framework
6.6.4.4. India Market Estimates and Forecasts, 2018 - 2030 (USD Million)
6.6.5. Australia
6.6.5.1. Key Country Dynamics
6.6.5.2. Competitive Scenario
6.6.5.3. Regulatory Framework
6.6.5.4. Australia Market Estimates and Forecasts, 2018 - 2030 (USD Million)
6.6.6. South Korea
6.6.6.1. Key Country Dynamics
6.6.6.2. Competitive Scenario
6.6.6.3. Regulatory Framework
6.6.6.4. South Korea Market Estimates and Forecasts, 2018 - 2030 (USD Million)
6.6.7. Malaysia
6.6.7.1. Key Country Dynamics
6.6.7.2. Competitive Scenario
6.6.7.3. Regulatory Framework
6.6.7.4. Malaysia Market Estimates and Forecasts, 2018 - 2030 (USD Million)
6.6.8. Indonesia
6.6.8.1. Key Country Dynamics
6.6.8.2. Competitive Scenario
6.6.8.3. Regulatory Framework
6.6.8.4. Indonesia Market Estimates and Forecasts, 2018 - 2030 (USD Million)
6.6.9. Singapore
6.6.9.1. Key Country Dynamics
6.6.9.2. Competitive Scenario
6.6.9.3. Regulatory Framework
6.6.9.4. Singapore Market Estimates and Forecasts, 2018 - 2030 (USD Million)
6.6.10. Philippines
6.6.10.1. Key Country Dynamics
6.6.10.2. Competitive Scenario
6.6.10.3. Regulatory Framework
6.6.10.4. Thailand Market Estimates and Forecasts, 2018 - 2030 (USD Million)
6.6.11. Thailand
6.6.11.1. Key Country Dynamics
6.6.11.2. Competitive Scenario
6.6.11.3. Regulatory Framework
6.6.11.4. Thailand Market Estimates and Forecasts, 2018 - 2030 (USD Million)
6.7. Latin America
6.7.1. Latin America Market Estimates and Forecasts, 2018 - 2030 (USD Million)
6.7.2. Brazil
6.7.2.1. Key Country Dynamics
6.7.2.2. Competitive Scenario
6.7.2.3. Regulatory Framework
6.7.2.4. Brazil Market Estimates and Forecasts, 2018 - 2030 (USD Million)
6.7.3. Argentina
6.7.3.1. Key Country Dynamics
6.7.3.2. Competitive Scenario
6.7.3.3. Regulatory Framework
6.7.3.4. Argentina Market Estimates and Forecasts, 2018 - 2030 (USD Million)
6.7.4. Colombia
6.7.4.1. Key Country Dynamics
6.7.4.2. Competitive Scenario
6.7.4.3. Regulatory Framework
6.7.4.4. Colombia Market Estimates and Forecasts, 2018 - 2030 (USD Million)
6.7.5. Chile
6.7.5.1. Key Country Dynamics
6.7.5.2. Competitive Scenario
6.7.5.3. Regulatory Framework
6.7.5.4. Chile Market Estimates and Forecasts, 2018 - 2030 (USD Million)
6.8. MEA
6.8.1. MEA Market Estimates and Forecasts, 2018 - 2030 (USD Million)
6.8.2. South Africa
6.8.2.1. Key Country Dynamics
6.8.2.2. Competitive Scenario
6.8.2.3. Regulatory Framework
6.8.2.4. South Africa Market Estimates and Forecasts, 2018 - 2030 (USD Million)
6.8.3. Saudi Arabia
6.8.3.1. Key Country Dynamics
6.8.3.2. Competitive Scenario
6.8.3.3. Regulatory Framework
6.8.3.4. Saudi Arabia Market Estimates and Forecasts, 2018 - 2030 (USD Million)
6.8.4. UAE
6.8.4.1. Key Country Dynamics
6.8.4.2. Competitive Scenario
6.8.4.3. Regulatory Framework
6.8.4.4. UAE Market Estimates and Forecasts, 2018 - 2030 (USD Million)
6.8.5. Kuwait
6.8.5.1. Key Country Dynamics
6.8.5.2. Competitive Scenario
6.8.5.3. Regulatory Framework
6.8.5.4. Kuwait Market Estimates and Forecasts, 2018 - 2030 (USD Million)
6.8.6. Israel
6.8.6.1. Key Country Dynamics
6.8.6.2. Competitive Scenario
6.8.6.3. Regulatory Framework
6.8.6.4. Israel Market Estimates and Forecasts, 2018 - 2030 (USD Million)
6.8.7. Egypt
6.8.7.1. Key Country Dynamics
6.8.7.2. Competitive Scenario
6.8.7.3. Regulatory Framework
6.8.7.4. Egypt Market Estimates and Forecasts, 2018 - 2030 (USD Million)
Chapter 7. Competitive Landscape
7.1. Market Participant Categorization
7.2. Company Market Share Analysis, 2024
7.3. Company Profiles
7.3.1. SGS SA
7.3.1.1. Company Overview
7.3.1.2. Financial Performance
7.3.1.3. Service Benchmarking
7.3.1.4. Strategic Initiatives
7.3.2. Laboratory Corporation of America Holdings
7.3.2.1. Company Overview
7.3.2.2. Financial Performance
7.3.2.3. Service Benchmarking
7.3.2.4. Strategic Initiatives
7.3.3. Nelson Laboratories, LLC
7.3.3.1. Company Overview
7.3.3.2. Financial Performance
7.3.3.3. Service Benchmarking
7.3.3.4. Strategic Initiatives
7.3.4. TÜV SÜD
7.3.4.1. Company Overview
7.3.4.2. Financial Performance
7.3.4.3. Service Benchmarking
7.3.4.4. Strategic Initiatives
7.3.5. Charles River Laboratories
7.3.5.1. Company Overview
7.3.5.2. Financial Performance
7.3.5.3. Service Benchmarking
7.3.5.4. Strategic Initiatives
7.3.6. Element Minnetonka
7.3.6.1. Company Overview
7.3.6.2. Financial Performance
7.3.6.3. Service Benchmarking
7.3.6.4. Strategic Initiatives
7.3.7. Eurofins Scientific
7.3.7.1. Company Overview
7.3.7.2. Financial Performance
7.3.7.3. Service Benchmarking
7.3.7.4. Strategic Initiatives
7.3.8. Pace Analytical Services LLC
7.3.8.1. Company Overview
7.3.8.2. Financial Performance
7.3.8.3. Service Benchmarking
7.3.8.4. Strategic Initiatives
7.3.9. Intertek Group Plc
7.3.9.1. Company Overview
7.3.9.2. Financial Performance
7.3.9.3. Service Benchmarking
7.3.9.4. Strategic Initiatives
7.3.10. North America Science Associates Inc. (NAMSA) (WuXi AppTec)
7.3.10.1. Company Overview
7.3.10.2. Financial Performance
7.3.10.3. Service Benchmarking
7.3.10.4. Strategic Initiatives
List of Tables
Table 1 List of abbreviation
Table 2 North America Medical Device Testing Services Market Estimates and Forecasts, by Region, 2018 - 2030 (USD Million)
Table 3 North America Medical Device Testing Services Market Estimates and Forecasts, by Service, 2018 - 2030 (USD Million)
Table 4 North America Medical Device Testing Services Market Estimates and Forecasts, by Phase, 2018 - 2030 (USD Million)
Table 5 U.S. Medical Device Testing Services Market Estimates and Forecasts, by Service, 2018 - 2030 (USD Million)
Table 6 U.S. Medical Device Testing Services Market Estimates and Forecasts, by Phase, 2018 - 2030 (USD Million)
Table 7 Mexico Medical Device Testing Services Market Estimates and Forecasts, by Service, 2018 - 2030 (USD Million)
Table 8 Mexico Medical Device Testing Services Market Estimates and Forecasts, by Phase, 2018 - 2030 (USD Million)
Table 9 Canada Medical Device Testing Services Market Estimates and Forecasts, by Service, 2018 - 2030 (USD Million)
Table 10 Canada Medical Device Testing Services Market Estimates and Forecasts, by Phase, 2018 - 2030 (USD Million)
Table 11 Europe Medical Device Testing Services Market Estimates and Forecasts, by Region, 2018 - 2030 (USD Million)
Table 12 Europe Medical Device Testing Services Market Estimates and Forecasts, by Service, 2018 - 2030 (USD Million)
Table 13 Europe Medical Device Testing Services Market Estimates and Forecasts, by Phase, 2018 - 2030 (USD Million)
Table 14 UK Medical Device Testing Services Market Estimates and Forecasts, by Service, 2018 - 2030 (USD Million)
Table 15 UK Medical Device Testing Services Market Estimates and Forecasts, by Phase, 2018 - 2030 (USD Million)
Table 16 Germany Medical Device Testing Services Market Estimates and Forecasts, by Service, 2018 - 2030 (USD Million)
Table 17 Germany Medical Device Testing Services Market Estimates and Forecasts, by Phase, 2018 - 2030 (USD Million)
Table 18 France Medical Device Testing Services Market Estimates and Forecasts, by Service, 2018 - 2030 (USD Million)
Table 19 France Medical Device Testing Services Market Estimates and Forecasts, by Phase, 2018 - 2030 (USD Million)
Table 20 Italy Medical Device Testing Services Market Estimates and Forecasts, by Service, 2018 - 2030 (USD Million)
Table 21 Italy Medical Device Testing Services Market Estimates and Forecasts, by Phase, 2018 - 2030 (USD Million)
Table 22 Spain Medical Device Testing Services Market Estimates and Forecasts, by Service, 2018 - 2030 (USD Million)
Table 23 Spain Medical Device Testing Services Market Estimates and Forecasts, by Phase, 2018 - 2030 (USD Million)
Table 24 Denmark Medical Device Testing Services Market Estimates and Forecasts, by Service, 2018 - 2030 (USD Million)
Table 25 Denmark Medical Device Testing Services Market Estimates and Forecasts, by Phase, 2018 - 2030 (USD Million)
Table 26 Sweden Medical Device Testing Services Market Estimates and Forecasts, by Service, 2018 - 2030 (USD Million)
Table 27 Sweden Medical Device Testing Services Market Estimates and Forecasts, by Phase, 2018 - 2030 (USD Million)
Table 28 Norway Medical Device Testing Services Market Estimates and Forecasts, by Service, 2018 - 2030 (USD Million)
Table 29 Norway Medical Device Testing Services Market Estimates and Forecasts, by Phase, 2018 - 2030 (USD Million)
Table 30 Netherlands Medical Device Testing Services Market Estimates and Forecasts, by Service, 2018 - 2030 (USD Million)
Table 31 Netherlands Medical Device Testing Services Market Estimates and Forecasts, by Phase, 2018 - 2030 (USD Million)
Table 32 Belgium Medical Device Testing Services Market Estimates and Forecasts, by Service, 2018 - 2030 (USD Million)
Table 33 Belgium Medical Device Testing Services Market Estimates and Forecasts, by Phase, 2018 - 2030 (USD Million)
Table 34 Switzerland Medical Device Testing Services Market Estimates and Forecasts, by Service, 2018 - 2030 (USD Million)
Table 35 Switzerland Medical Device Testing Services Market Estimates and Forecasts, by Phase, 2018 - 2030 (USD Million)
Table 36 Asia Pacific Medical Device Testing Services Market Estimates and Forecasts, by Region, 2018 - 2030 (USD Million)
Table 37 Asia Pacific Medical Device Testing Services Market Estimates and Forecasts, by Service, 2018 - 2030 (USD Million)
Table 38 Asia Pacific Medical Device Testing Services Market Estimates and Forecasts, by Phase, 2018 - 2030 (USD Million)
Table 39 Japan Medical Device Testing Services Market Estimates and Forecasts, by Service, 2018 - 2030 (USD Million)
Table 40 Japan Medical Device Testing Services Market Estimates and Forecasts, by Phase, 2018 - 2030 (USD Million)
Table 41 China Medical Device Testing Services Market Estimates and Forecasts, by Service, 2018 - 2030 (USD Million)
Table 42 China Medical Device Testing Services Market Estimates and Forecasts, by Phase, 2018 - 2030 (USD Million)
Table 43 India Medical Device Testing Services Market Estimates and Forecasts, by Service, 2018 - 2030 (USD Million)
Table 44 India Medical Device Testing Services Market Estimates and Forecasts, by Phase, 2018 - 2030 (USD Million)
Table 45 Australia Medical Device Testing Services Market Estimates and Forecasts, by Service, 2018 - 2030 (USD Million)
Table 46 Australia Medical Device Testing Services Market Estimates and Forecasts, by Phase, 2018 - 2030 (USD Million)
Table 47 South Korea Medical Device Testing Services Market Estimates and Forecasts, by Service, 2018 - 2030 (USD Million)
Table 48 South Korea Medical Device Testing Services Market Estimates and Forecasts, by Phase, 2018 - 2030 (USD Million)
Table 49 Malaysia Medical Device Testing Services Market Estimates and Forecasts, by Service, 2018 - 2030 (USD Million)
Table 50 Malaysia Medical Device Testing Services Market Estimates and Forecasts, by Phase, 2018 - 2030 (USD Million)
Table 51 Indonesia Medical Device Testing Services Market Estimates and Forecasts, by Service, 2018 - 2030 (USD Million)
Table 52 Indonesia Medical Device Testing Services Market Estimates and Forecasts, by Phase, 2018 - 2030 (USD Million)
Table 53 Singapore Medical Device Testing Services Market Estimates and Forecasts, by Service, 2018 - 2030 (USD Million)
Table 54 Singapore Medical Device Testing Services Market Estimates and Forecasts, by Phase, 2018 - 2030 (USD Million)
Table 55 Philippines Medical Device Testing Services Market Estimates and Forecasts, by Service, 2018 - 2030 (USD Million)
Table 56 Philippines Medical Device Testing Services Market Estimates and Forecasts, by Phase, 2018 - 2030 (USD Million)
Table 57 Thailand Medical Device Testing Services Market Estimates and Forecasts, by Service, 2018 - 2030 (USD Million)
Table 58 Thailand Medical Device Testing Services Market Estimates and Forecasts, by Phase, 2018 - 2030 (USD Million)
Table 59 Latin America Medical Device Testing Services Market Estimates and Forecasts, by Region, 2018 - 2030 (USD Million)
Table 60 Latin America Medical Device Testing Services Market Estimates and Forecasts, by Service, 2018 - 2030 (USD Million)
Table 61 Latin America Medical Device Testing Services Market Estimates and Forecasts, by Phase, 2018 - 2030 (USD Million)
Table 62 Brazil Medical Device Testing Services Market Estimates and Forecasts, by Service, 2018 - 2030 (USD Million)
Table 63 Brazil Medical Device Testing Services Market Estimates and Forecasts, by Phase, 2018 - 2030 (USD Million)
Table 64 Argentina Medical Device Testing Services Market Estimates and Forecasts, by Service, 2018 - 2030 (USD Million)
Table 65 Argentina Medical Device Testing Services Market Estimates and Forecasts, by Phase, 2018 - 2030 (USD Million)
Table 66 Colombia Medical Device Testing Services Market Estimates and Forecasts, by Service, 2018 - 2030 (USD Million)
Table 67 Colombia Medical Device Testing Services Market Estimates and Forecasts, by Phase, 2018 - 2030 (USD Million)
Table 68 Chile Medical Device Testing Services Market Estimates and Forecasts, by Service, 2018 - 2030 (USD Million)
Table 69 Chile Medical Device Testing Services Market Estimates and Forecasts, by Phase, 2018 - 2030 (USD Million)
Table 70 MEA Medical Device Testing Services Market Estimates and Forecasts, by Region, 2018 - 2030 (USD Million)
Table 71 MEA Medical Device Testing Services Market Estimates and Forecasts, by Service, 2018 - 2030 (USD Million)
Table 72 MEA Medical Device Testing Services Market Estimates and Forecasts, by Phase, 2018 - 2030 (USD Million)
Table 73 South Africa Medical Device Testing Services Market Estimates and Forecasts, by Service, 2018 - 2030 (USD Million)
Table 74 South Africa Medical Device Testing Services Market Estimates and Forecasts, by Phase, 2018 - 2030 (USD Million)
Table 75 Saudi Arabia Medical Device Testing Services Market Estimates and Forecasts, by Service, 2018 - 2030 (USD Million)
Table 76 Saudi Arabia Medical Device Testing Services Market Estimates and Forecasts, by Phase, 2018 - 2030 (USD Million)
Table 77 UAE Medical Device Testing Services Market Estimates and Forecasts, by Service, 2018 - 2030 (USD Million)
Table 78 UAE Medical Device Testing Services Market Estimates and Forecasts, by Phase, 2018 - 2030 (USD Million)
Table 79 Kuwait Medical Device Testing Services Market Estimates and Forecasts, by Service, 2018 - 2030 (USD Million)
Table 80 Kuwait Medical Device Testing Services Market Estimates and Forecasts, by Phase, 2018 - 2030 (USD Million)
Table 81 Israel Medical Device Testing Services Market Estimates and Forecasts, by Service, 2018 - 2030 (USD Million)
Table 82 Israel Medical Device Testing Services Market Estimates and Forecasts, by Phase, 2018 - 2030 (USD Million)
Table 83 Egypt Medical Device Testing Services Market Estimates and Forecasts, by Service, 2018 - 2030 (USD Million)
Table 84 Egypt Medical Device Testing Services Market Estimates and Forecasts, by Phase, 2018 - 2030 (USD Million)
Table 85 Financial performance
List of Figures
Fig. 1 Market research process
Fig. 2 Information procurement
Fig. 3 Primary research pattern
Fig. 4 Market research approaches
Fig. 5 Market formulation & validation
Fig. 6 Commodity flow analysis
Fig. 7 Value-chain-based sizing & forecasting
Fig. 8 QFD model sizing & forecasting
Fig. 9 Bottom-up approach
Fig. 10 Market snapshot
Fig. 11 Segment snapshot 1
Fig. 12 Segment snapshot 2
Fig. 13 Competitive landscape snapshot
Fig. 14 Parent market outlook, 2024 (USD Billion)
Fig. 15 Ancillary market outlook, 2024 (USD Billion)
Fig. 16 Medical Device Testing Services Market dynamics
Fig. 17 Porter’s five forces analysis
Fig. 18 PESTEL analysis
Fig. 19 Medical Device testing services market: Service outlook and key takeaways
Fig. 20 Medical device testing services market: Service movement analysis
Fig. 21 Biocompatibility tests market estimates and forecasts, 2018 - 2030 (USD Million)
Fig. 22 Cardiovascular device's biocompatibility tests market estimates and forecasts, 2018 - 2030 (USD Million)
Fig. 23 Orthopedic device's biocompatibility tests market estimates and forecasts, 2018 - 2030 (USD Million)
Fig. 24 Dental Implant devices' biocompatibility tests market estimates and forecasts, 2018 - 2030 (USD Million)
Fig. 25 Dermal filler's biocompatibility tests market estimates and forecasts, 2018 - 2030 (USD Million)
Fig. 26 General surgery implantation devices biocompatibility tests market estimates and forecasts, 2018 - 2030 (USD Million)
Fig. 27 Neurosurgical implantation devices biocompatibility tests market estimates and forecasts, 2018 - 2030 (USD Million)
Fig. 28 Ophthalmic implantation device's biocompatibility tests market estimates and forecasts, 2018 - 2030 (USD Million)
Fig. 29 Others market estimates and forecasts, 2018 - 2030 (USD Million) market estimates and forecasts, 2018 - 2030 (USD Million)
Fig. 30 Chemistry test market estimates and forecasts, 2018 - 2030 (USD Million) market estimates and forecasts, 2018 - 2030 (USD Million)
Fig. 31 Chemical Characterization (E&L) market estimates and forecasts, 2018 - 2030 (USD Million)
Fig. 32 Analytical method development and validation market estimates and forecasts, 2018 - 2030 (USD Million)
Fig. 33 Toxicological risk assessment and consulting market estimates and forecasts, 2018 - 2030 (USD Million)
Fig. 34 Microbiology & sterility test market estimates and forecasts, 2018 - 2030 (USD Million)
Fig. 35 Bioburden determination market estimates and forecasts, 2018 - 2030 (USD Million)
Fig. 36 Pyrogen & endotoxin testing market estimates and forecasts, 2018 - 2030 (USD Million)
Fig. 37 Sterility test & validation market estimates and forecasts, 2018 - 2030 (USD Million)
Fig. 38 Antimicrobial testing market estimates and forecasts, 2018 - 2030 (USD Million)
Fig. 39 Others market estimates and forecasts, 2018 - 2030 (USD Million)
Fig. 40 Package validation market estimates and forecasts, 2018 - 2030 (USD Million)
Fig. 41 Medical device testing services market: Phase outlook and key takeaways
Fig. 42 Medical device testing services market: Phase movement analysis
Fig. 43 Preclinical market estimates and forecasts, 2018 - 2030 (USD Million)
Fig. 44 Large animal research market estimates and forecasts, 2018 - 2030 (USD Million)
Fig. 45 Biocompatibility tests market estimates and forecasts, 2018 - 2030 (USD Million)
Fig. 46 Chemistry test market estimates and forecasts, 2018 - 2030 (USD Million)
Fig. 47 Microbiology & sterility test market estimates and forecasts, 2018 - 2030 (USD Million)
Fig. 48 Small animal research market estimates and forecasts, 2018 - 2030 (USD Million)
Fig. 49 Biocompatibility tests market estimates and forecasts, 2018 - 2030 (USD Million)
Fig. 50 Chemistry test market estimates and forecasts, 2018 - 2030 (USD Million)
Fig. 51 Microbiology & sterility test market estimates and forecasts, 2018 - 2030 (USD Million)
Fig. 52 Clinical market estimates and forecasts, 2018 - 2030 (USD Million)
Fig. 53 Regional Marketplace: Key Takeaways
Fig. 54 North America medical device testing services market estimates and forecasts, 2018 - 2030 (USD Million)
Fig. 55 Key country dynamics
Fig. 56 U.S. medical device testing services market estimates and forecasts, 2018 - 2030 (USD Million)
Fig. 57 Key country dynamics
Fig. 58 Canada medical device testing services market estimates and forecasts, 2018 - 2030 (USD Million)
Fig. 59 Key country dynamics
Fig. 60 Mexico medical device testing services market estimates and forecasts, 2018 - 2030 (USD Million)
Fig. 61 Europe medical device testing services market estimates and forecasts, 2018 - 2030 (USD Million)
Fig. 62 Key country dynamics
Fig. 63 UK medical device testing services market estimates and forecasts, 2018 - 2030 (USD Million)
Fig. 64 Key country dynamics
Fig. 65 Germany medical device testing services market estimates and forecasts, 2018 - 2030 (USD Million)
Fig. 66 Key country dynamics
Fig. 67 France medical device testing services market estimates and forecasts, 2018 - 2030 (USD Million)
Fig. 68 Key country dynamics
Fig. 69 Italy medical device testing services market estimates and forecasts, 2018 - 2030 (USD Million)
Fig. 70 Key country dynamics
Fig. 71 Spain medical device testing services market estimates and forecasts, 2018 - 2030 (USD Million)
Fig. 72 Key country dynamics
Fig. 73 Denmark medical device testing services market estimates and forecasts, 2018 - 2030 (USD Million)
Fig. 74 Key country dynamics
Fig. 75 Sweden medical device testing services market estimates and forecasts, 2018 - 2030 (USD Million)
Fig. 76 Key country dynamics
Fig. 77 Norway medical device testing services market estimates and forecasts, 2018 - 2030 (USD Million)
Fig. 78 Key country dynamics
Fig. 79 Netherlands medical device testing services market estimates and forecasts, 2018 - 2030 (USD Million)
Fig. 80 Key country dynamics
Fig. 81 Belgium medical device testing services market estimates and forecasts, 2018 - 2030 (USD Million)
Fig. 82 Key country dynamics
Fig. 83 Switzerland medical device testing services market estimates and forecasts, 2018 - 2030 (USD Million)
Fig. 84 Asia Pacific medical device testing services market estimates and forecasts, 2018 - 2030 (USD Million)
Fig. 85 Key country dynamics
Fig. 86 Japan medical device testing services market estimates and forecasts, 2018 - 2030 (USD Million)
Fig. 87 Key country dynamics
Fig. 88 China medical device testing services market estimates and forecasts, 2018 - 2030 (USD Million)
Fig. 89 Key country dynamics
Fig. 90 India medical device testing services market estimates and forecasts, 2018 - 2030 (USD Million)
Fig. 91 Key country dynamics
Fig. 92 Australia medical device testing services market estimates and forecasts, 2018 - 2030 (USD Million)
Fig. 93 Key country dynamics
Fig. 94 South Korea medical device testing services market estimates and forecasts, 2018 - 2030 (USD Million)
Fig. 95 Key country dynamics
Fig. 96 Malaysia medical device testing services market estimates and forecasts, 2018 - 2030 (USD Million)
Fig. 97 Key country dynamics
Fig. 98 Indonesia medical device testing services market estimates and forecasts, 2018 - 2030 (USD Million)
Fig. 99 Key country dynamics
Fig. 100 Singapore medical device testing services market estimates and forecasts, 2018 - 2030 (USD Million)
Fig. 101 Key country dynamics
Fig. 102 Philippines medical device testing services market estimates and forecasts, 2018 - 2030 (USD Million)
Fig. 103 Key country dynamics
Fig. 104 Thailand medical device testing services market estimates and forecasts, 2018 - 2030 (USD Million)
Fig. 105 Latin America medical device testing services market estimates and forecasts, 2018 - 2030 (USD Million)
Fig. 106 Key country dynamics
Fig. 107 Brazil medical device testing services market estimates and forecasts, 2018 - 2030 (USD Million)
Fig. 108 Key country dynamics
Fig. 109 Argentina medical device testing services market estimates and forecasts, 2018 - 2030 (USD Million)
Fig. 110 Key country dynamics
Fig. 111 Colombia medical device testing services market estimates and forecasts, 2018 - 2030 (USD Million)
Fig. 112 Key country dynamics
Fig. 113 Chile medical device testing services market estimates and forecasts, 2018 - 2030 (USD Million)
Fig. 114 MEA medical device testing services market estimates and forecasts, 2018 - 2030 (USD Million)
Fig. 115 Key country dynamics
Fig. 116 South Africa medical device testing services market estimates and forecasts, 2018 - 2030 (USD Million)
Fig. 117 Key country dynamics
Fig. 118 Saudi Arabia medical device testing services market estimates and forecasts, 2018 - 2030 (USD Million)
Fig. 119 Key country dynamics
Fig. 120 UAE medical device testing services market estimates and forecasts, 2018 - 2030 (USD Million)
Fig. 121 Key country dynamics
Fig. 122 Kuwait medical device testing services market estimates and forecasts, 2018 - 2030 (USD Million)
Fig. 123 Key country dynamics
Fig. 124 Israel medical device testing services market estimates and forecasts, 2018 - 2030 (USD Million)
Fig. 125 Key country dynamics
Fig. 126 Egypt medical device testing services market estimates and forecasts, 2018 - 2030 (USD Million)
Fig. 127 Key company categorization
Fig. 128 Service heat map analysis
Fig. 129 Strategic framework
Market Segmentation
Report content
Qualitative Analysis
Quantitative Analysis
Research Methodology
Grand View Research employs a comprehensive and iterative research methodology focused on minimizing deviance in order to provide the most accurate estimates and forecast possible. The company utilizes a combination of bottom-up and top-down approaches for segmenting and estimating quantitative aspects of the market. In Addition, a recurring theme prevalent across all our research reports is data triangulation that looks market from three different perspectives. Critical elements of the methodology employed for all our studies include:
Preliminary data mining
Raw market data is obtained and collated on a broad front. Data is continuously filtered to ensure that only validated and authenticated sources are considered. In addition, data is also mined from a host of reports in our repository, as well as a number of reputed paid databases. For a comprehensive understanding of the market, it is essential to understand the complete value chain, and in order to facilitate this; we collect data from raw material suppliers, distributors as well as buyers.
Technical issues and trends are obtained from surveys, technical symposia, and trade journals. Technical data is also gathered from an intellectual property perspective, focusing on white space and freedom of movement. Industry dynamics with respect to drivers, restraints, pricing trends are also gathered. As a result, the material developed contains a wide range of original data that is then further cross-validated and authenticated with published sources.
Statistical model
Our market estimates and forecasts are derived through simulation models. A unique model is created customized for each study. Gathered information for market dynamics, technology landscape, application development, and pricing trends are fed into the model and analyzed simultaneously. These factors are studied on a comparative basis, and their impact over the forecast period is quantified with the help of correlation, regression, and time series analysis. Market forecasting is performed via a combination of economic tools, technological analysis, industry experience, and domain expertise.
Econometric models are generally used for short-term forecasting, while technological market models are used for long-term forecasting. These are based on an amalgamation of the technology landscape, regulatory frameworks, economic outlook, and business principles. A bottom-up approach to market estimation is preferred, with key regional markets analyzed as separate entities and integration of data to obtain global estimates. This is critical for a deep understanding of the industry as well as ensuring minimal errors. Some of the parameters considered for forecasting include:
• Market drivers and restraints, along with their current and expected impact
• Raw material scenario and supply v/s price trends
• Regulatory scenario and expected developments
• Current capacity and expected capacity additions up to 2030
We assign weights to these parameters and quantify their market impact using weighted average analysis, to derive an expected market growth rate.
Primary validation
This is the final step in estimating and forecasting for our reports. Exhaustive primary interviews are conducted, face to face as well as over the phone to validate our findings and assumptions used to obtain them. Interviewees are approached from leading companies across the value chain including suppliers, technology providers, domain experts, and buyers so as to ensure a holistic and unbiased picture of the market. These interviews are conducted across the globe, with language barriers overcome with the aid of local staff and interpreters. Primary interviews not only help in data validation but also provide critical insights into the market, current business scenario, and future expectations and enhance the quality of our reports. All our estimates and forecast are verified through exhaustive primary research with Key Industry Participants (KIPs) which typically include:
• Market-leading companies
• Raw material suppliers
• Product distributors
• Buyers
The key objectives of primary research are as follows:
• To validate our data in terms of accuracy and acceptability
• To gain an insight in to the current market and future expectations
Data Collection Matrix
Perspective |
Primary research |
Secondary research |
Supply-side |
|
|
Demand-side |
|
|
Industry Analysis Matrix
Qualitative analysis |
Quantitative analysis |
|
|
"The quality of research they have done for us has been excellent."