Liquefied Natural Gas Market Size, Share & Trends Analysis Report By Application (Transportation Fuel, Power Generation), By Region (North America, Europe, Asia Pacific, Middle East & Africa), And Segment Forecasts, 2025 - 2030
- Report ID: GVR-1-68038-553-3
- Number of Report Pages: 110
- Format: PDF
- Historical Range: 2018 - 2023
- Forecast Period: 2025 - 2030
- Industry: Energy & Power
Liquefied Natural Gas Market Size & Trends
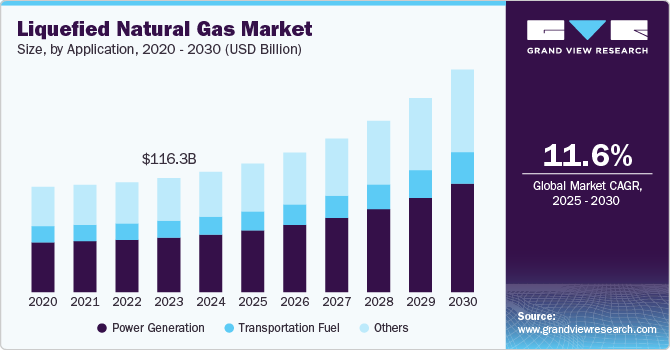
The global liquefied natural gas market size was valued at USD 122.60 billion in 2024 and is expected to grow at a CAGR of 11.6% from 2025 to 2030. The growing demand for electric power through clean energy sources is likely to propel market growth over the coming years. A growing focus on projects related to distributed power & utility is anticipated to bolster the market growth over the next eight years. The projected growth in natural gas in the power generation business is also likely to create more demand for liquefied natural gas (LNG) across various countries.

Coal is the major source of generating electricity worldwide; however, considering the degradation of coal reserves and its adverse environmental impact, there has been a rise in the use of natural gas and other renewable sources of energy for the production of electricity.
Drivers, Opportunities & Restraints
The growth of the liquefied natural gas (LNG) market in power generation is driven by several key factors. Increasing Energy Demand: Rapid industrialization and urbanization, particularly in developing regions, are escalating the need for reliable energy sources.
Stricter regulations favoring cleaner fuels are pushing industries toward LNG, which emits significantly lower carbon emissions compared to coal. Innovations in LNG production and distribution technologies are enhancing efficiency and reducing costs. Additionally, the expansion of LNG infrastructure, including liquefaction and regasification facilities, supports the growing adoption of LNG in power generation, making it a crucial player in the transition to cleaner energy sources.
The liquefied natural gas (LNG) market faces several significant restraints that hinder its growth. The development of the necessary infrastructure for transporting and regasifying LNG is capital-intensive, which can limit the expansion into new importing regions.
Application Insights
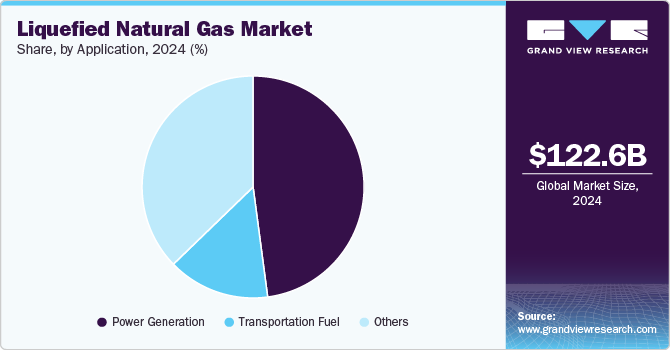
Based on application, power generation led the market with the largest revenue share of 47.90% in 2024. The liquefied natural gas (LNG) market in power generation is primarily driven by the rising energy demand. Rapid industrialization and urbanization, especially in developing countries, are increasing the need for reliable energy sources. Stricter policies favoring cleaner fuels over coal have led to a significant shift toward LNG, which emits approximately half the carbon emissions of coal when burned, making it an attractive transitional fuel as the world seeks to reduce greenhouse gas emissions.

Investments in natural gas transmission and distribution networks are enhancing the supply chain for LNG, facilitating its use in power generation. Additionally, the flexibility of LNG allows for mobile and offshore power generation solutions, addressing energy needs in remote areas where traditional infrastructure is lacking. These factors collectively position LNG as a crucial component in the global transition toward cleaner energy sources.
Regional Insights
North America liquefied natural gas market is driven by several key factors, including abundant natural gas reserves, significant infrastructure expansion, and increasing global demand for cleaner energy sources. The region's extensive shale gas resources provide a solid foundation for LNG production, enabling the U.S. to emerge as a leading exporter, with export capacity expected to double by 2028.
U.S. Liquefied Natural Gas Market Trends
The liquefied natural gas market in the U.S. is characterized by several distinctive features that set it apart from its global counterparts. Firstly, the U.S. benefits from abundant natural gas reserves, primarily due to the shale gas revolution, positioning it as a leading exporter with significant production capacity. The infrastructure supporting LNG exports is extensive, featuring the longest network of pipelines and a robust system for gas processing and storage, which enhances market efficiency. U.S. LNG contracts typically offer destination flexibility, allowing buyers to choose where to send their cargoes, a shift from traditional rigid contract terms that dominated the market.
Asia Pacific Liquefied Natural Gas Market Trends
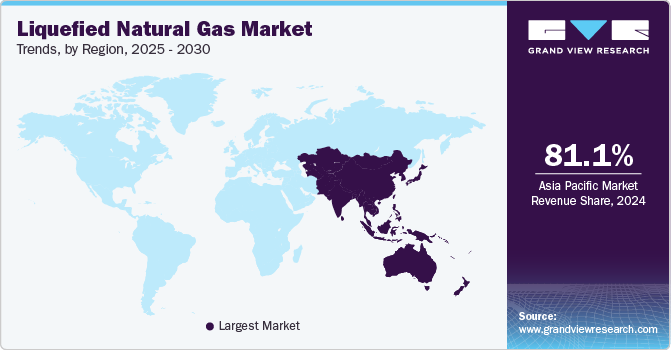
The liquefied natural gas market in Asia Pacific dominated the global industry and accounted for the largest revenue share of over 81.1% in 2024. The Asia-Pacific LNG market is primarily driven by a combination of increasing energy demand, environmental regulations, and the transition from coal to gas for power generation. The region's rapid industrialization and urbanization have led to a surge in electricity consumption, prompting countries to seek cleaner energy alternatives, particularly as aging oil-fired power plants are replaced with more efficient gas-fired units.

China liquefied natural gas market is experiencing significant growth, driven by a combination of increasing energy demand, government policies aimed at reducing air pollution, and the need for energy diversification. In 2024, China's LNG imports are projected to rise by 8.1% year-on-year to 77.11 million metric tons, reflecting a recovery from previous years and a strategic pivot away from coal reliance.
The liquefied natural gas market in Japan has been on a downward trajectory, reflecting significant shifts in its energy landscape. Since 2014, Japan's LNG consumption has decreased by approximately 25%, driven by a resurgence in nuclear power generation and increased reliance on renewable energy sources as part of the country's long-term climate goals.
Europe Liquefied Natural Gas Market Trends
The liquefied natural gas market in Europe is characterized by a significant shift toward diversification of supply sources, driven largely by geopolitical factors and the need for energy security following the reduction of Russian gas imports. Historically reliant on pipeline gas, Europe has rapidly expanded its LNG import infrastructure, now boasting 57 operational terminals, with ongoing projects to enhance regasification capacity.
Germany liquefied natural gas market is primarily driven by the urgent need to diversify energy sources following the reduction of Russian gas imports due to the Ukraine conflict. This geopolitical shift has prompted Germany to accelerate the development of its LNG infrastructure, including the establishment of several floating import terminals, which are designed to enhance supply flexibility and security.
The liquefied natural gas market in the UK is driven by several key factors, including the urgent need for sustainability and the transition to renewable energy sources. As the UK aims to reduce carbon emissions and achieve net-zero targets, AI technologies are increasingly being adopted to optimize energy generation, enhance grid management, and improve Others.
Central & South America Liquefied Natural Gas Market Trends
The liquefied natural gas market in Central and South America is driven by several factors, including the need for energy diversification, increasing demand for cleaner energy sources, and the region's evolving infrastructure. Countries like Brazil and Colombia are experiencing heightened LNG imports due to declining domestic natural gas production and the impacts of climate change on hydropower generation, which has historically been a primary energy source.
Middle East & Africa Liquefied Natural Gas Market Trends
The liquefied natural gas market in the Middle East and Africa is driven by several key factors, including the region's significant natural gas reserves, increasing global demand for cleaner energy, and geopolitical dynamics. Countries like Qatar, the UAE, and Algeria are major exporters, with Qatar alone accounting for approximately 70% of the region's LNG exports, which have remained strong despite increased competition from the U.S. and Australia.
Key Liquefied Natural Gas Company Insights
Key players include BP, Chevron, and ExxonMobil, which dominate through strategic investments and long-term contracts. The Asia Pacific region leads in demand, particularly from China and Japan, while North America, driven by shale gas reserves and clean energy initiatives, is expected to grow rapidly. The market is also influenced by the transition from coal to cleaner energy sources, with LNG being favored for its lower emissions and versatility in applications such as power generation and transportation fuel.
Key Liquefied Natural Gas Companies:
The following are the leading companies in the liquefied natural gas market. These companies collectively hold the largest market share and dictate industry trends.
- British Petroleum (BP) p.l.c.
- Chevron Corporation
- China Petroleum & Chemical Corporation
- Eni SpA
- Equinor ASA
- Exxon Mobil Corporation
- Gazprom Energy
- PetroChina Company Limited
- Royal Dutch Shell PLC
- Total S.A.
Recent Developments
-
In October 2024, SEFE and ConocoPhillips initiated a long-term gas partnership, with SEFE set to purchase up to nine billion cubic meters of natural gas from ConocoPhillips over the next decade. This agreement significantly enhances energy supply security for Germany and Europe. Frederic Barnaud, SEFE's Chief Commercial Officer, remarked that "this agreement marks a crucial milestone in our efforts to diversify our natural gas portfolio."
-
In June 2024. Indian State-owned Oil and Natural Gas Corporation (ONGC) and Indian Oil Corporation (IOC) have formalized an agreement to establish a small-scale liquefied natural gas (LNG) plant near the Hatta gas field in Madhya Pradesh, India.
Liquefied Natural Gas Market Report Scope
|
Report Attribute |
Details |
|
Market size value in 2025 |
USD 131.14 billion |
|
Revenue forecast in 2030 |
USD 226.97 billion |
|
Growth rate |
CAGR of 11.6% from 2025 to 2030 |
|
Historical data |
2018 - 2023 |
|
Base Year |
2024 |
|
Forecast period |
2025 - 2030 |
|
Report updated |
October 2024 |
|
Quantitative units |
Volume in million tons; revenue in USD million/billion, and CAGR from 2025 to 2030 |
|
Report coverage |
Revenue forecast, Volume forecast, competitive landscape, growth factors and trends |
|
Segments covered |
Application, region |
|
Regional scope |
North America; Europe; Asia Pacific; Central & South America; Middle East & Africa |
|
Country Scope |
U.S.; Canada; Mexico; Germany; France; UK; Italy; Spain; Russia; China; India; Japan; Australia; Brazil; Argentina; Saudi Arabia; South Africa; UAE |
|
Key companies profiled |
British Petroleum (BP) p.l.c.; Chevron Corporation; China Petroleum & Chemical Corporation; Eni SpA; Equinor ASA; Exxon Mobil Corporation; Gazprom Energy; PetroChina Company Limited; Royal Dutch Shell PLC; Total S.A. |
|
Customization scope |
Free report customization (equivalent up to 8 analyst’s working days) with purchase. Addition or alteration to country, regional & segment scope |
|
Pricing and purchase options |
Avail customized purchase options to meet your exact research needs. Explore purchase options |
Global Liquefied Natural Gas Market Report Segmentation
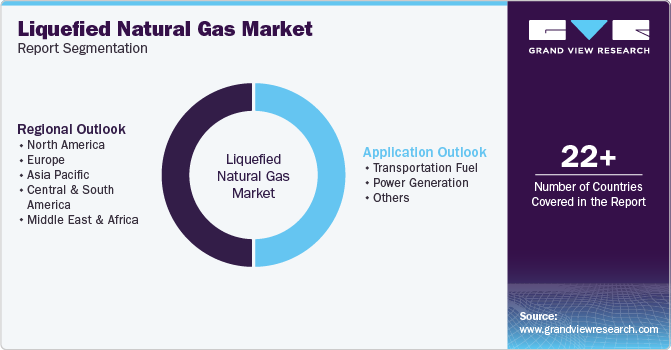
This report forecasts volume & revenue growth at the global, regional, and country levels and provides an analysis of the latest industry trends in each of the sub-segments from 2018 to 2030. For this study, Grand View Research has segmented the global liquefied natural gas market report on the basis of application and region:

-
Application Outlook (Volume, Million Tons; Revenue, USD Million, 2018 - 2030)
-
Transportation Fuel
-
Power Generation
-
Others
-
-
Regional Outlook (Volume, Million Tons; Revenue, USD Million, 2018 - 2030)
-
North America
-
U.S.
-
Canada
-
Mexico
-
-
Europe
-
Germany
-
UK
-
Italy
-
Spain
-
France
-
Russia
-
-
Asia Pacific
-
China
-
India
-
Japan
-
Australia
-
-
Central & South America
-
Brazil
-
Argentina
-
-
Middle East & Africa
-
Saudi Arabia
-
South Africa
-
UAE
-
-
Frequently Asked Questions About This Report
b. The global liquefied natural gas market size was estimated at USD 122.60 billion in 2024 and is expected to reach USD 131.14 billion in 2025.
b. The global liquefied natural gas market is expected to witness a compound annual growth rate of 11.6% from 2025 to 2030 to reach USD 226.97 billion by 2030.
b. Asia Pacific LNG market conquered the global demand accounting for the majority of the revenue share in 2024 and is projected to be the fastest-growing market, owing to the rising demand for LNG economies such as China and India for the various end-use industries.
b. Some key players operating in the LNG market include TBritish Petroleum (BP) p.l.c., Chevron Corporation, China Petroleum & Chemical Corporation, Eni SpA, Equinor ASA, Exxon Mobil Corporation, Gazprom Energy and PetroChina Company Limited
b. The global LNG market is expected to register substantial growth owing to the rapid growth of electric power through clean energy sources and increasing focus on projects related to distributed power & utility.
We are committed towards customer satisfaction, and quality service.
"The quality of research they have done for us has been excellent."


