The global home infusion therapy market size was valued at USD 35.96 billion in 2023 and is expected to grow at a compound annual growth rate (CAGR) of 8.1% from 2024 to 2030. Home infusion therapy involves delivering therapeutic treatments, medications, or fluids directly into a patient's bloodstream through intravenous (IV) infusion, usually in the comfort and convenience of their home.
The growth of the market is driven by several key factors, including the expanding geriatric population characterized by decreased mobility, a rising preference for home care, and the swift evolution of technological advancements. Infusion therapy, encompassing essential components like IV therapy and IV hydration therapy, plays a crucial role in addressing conditions such as immune deficiencies, cancer, and congestive heart failure, where oral medication is not a viable treatment option. The increasing demand for these therapies stems from the need for long-term treatment among patients, positioning home infusion therapy as a notably cost-effective alternative to hospital-based care. The incorporation of IV therapy and IV hydration therapy serves as a driving force, providing patients with enhanced accessibility to effective and personalized medical solutions in the comfort of their homes.
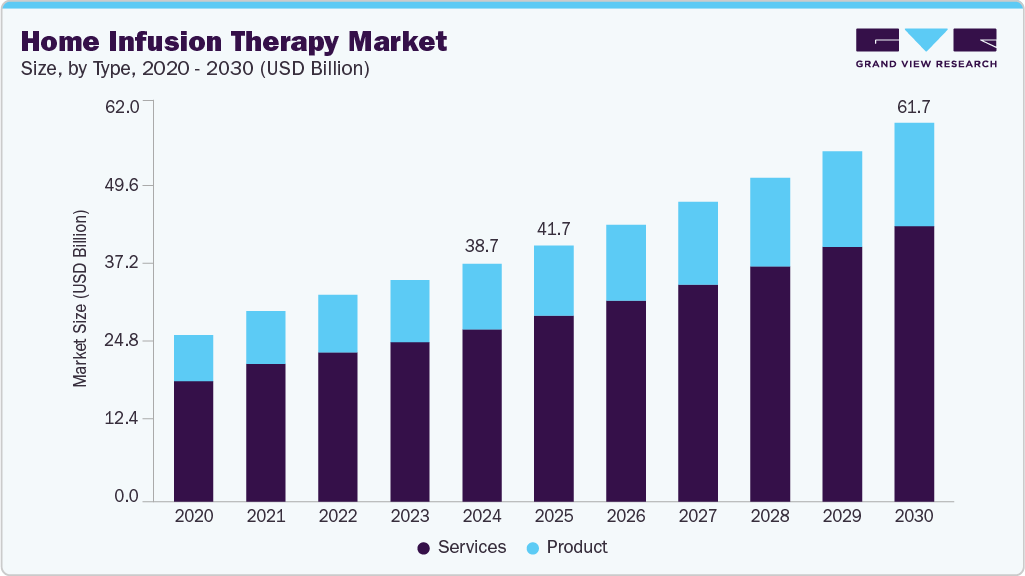
The home infusion market experienced a positive shift during the COVID-19 pandemic, with home infusion becoming a crucial necessity as healthcare facilities faced a surge in COVID patients. Despite the challenges posed by regional and country-wide lockdowns, causing disruptions in operations and supply chains, the market witnessed a substantial increase in 2020. As reported by Medtech Dive in October 2020, Baxter disclosed third-quarter sales of USD 2.97 billion, marking a 4% growth attributed to the rising demand for its COVID-related medical products. Furthermore, Baxter reported operational sales growth of 6% (reaching 3.2 billion) in Q3 2021 compared to 3.0 billion in Q3 2020, indicating a sustained recovery from the pandemic's impact.
Moreover, the market's expansion is propelled by the enhanced outcomes observed in patients and the cost-effectiveness and convenience provided by home infusion therapy. The increasing demographic of baby boomers struggling with diminished mobility due to conditions such as paralysis, osteoarthritis, and diabetes is expected to amplify the demand for home infusion therapy. The growing imperative to reduce the duration of inpatient stays is a pivotal factor poised to contribute significantly to the market's growth. Remarkably, continuous subcutaneous (SC) apomorphine infusion emerges as an exceptionally effective treatment for Parkinson's disease (PD), with diverse drug formulations available for the management of PD through subcutaneous delivery. In response to the mounting burden of PD, there is a notable surge in the demand for subcutaneous infusion therapy. For instance, in line with the Parkinson's Foundation's 2022 data update, approximately 90,000 individuals receive a PD diagnosis annually in the U.S. Furthermore, the anticipated number of people living with PD in the country is projected to soar to nearly 1.2 million by the year 2030.
The home infusion therapy market is characterized by a robust demand for patient-centric healthcare solutions, with a notable emphasis on personalized treatment in the comfort of one's home. This dynamic landscape is further marked by an increasing integration of advanced technologies, fostering innovations in infusion devices, remote monitoring, and data-driven healthcare delivery.
Moreover, strategic collaborations between healthcare providers, pharmaceutical companies, and technology firms contribute to the market's vibrancy, ensuring a comprehensive and evolving approach to home-based infusion therapy.
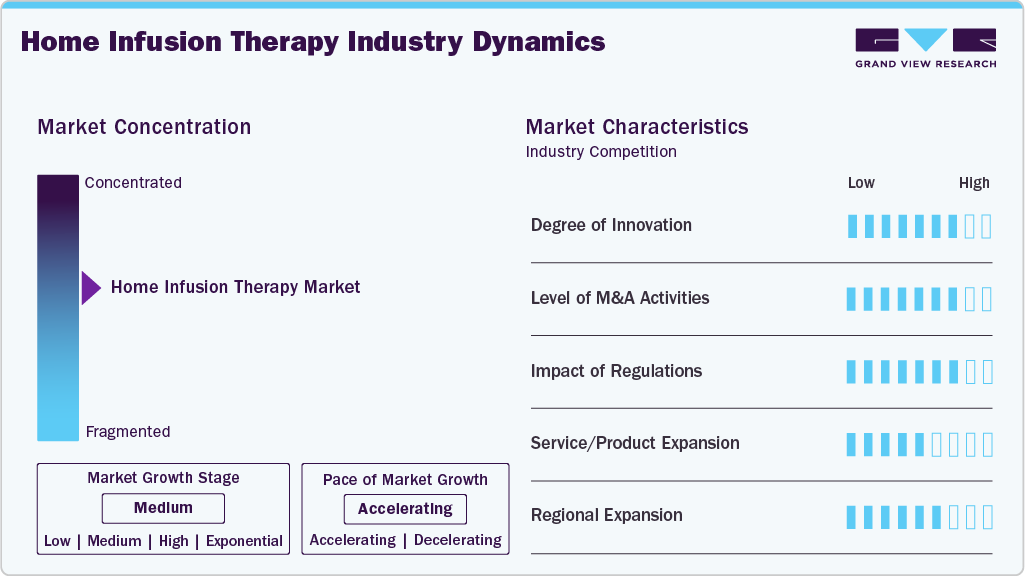
The market is also characterized by a high level of merger and acquisition (M&A) activity undertaken by the leading players. This is due to several factors, the rising focus on increasing the company’s products & services portfolio, the need to consolidate in a rapidly growing market, and the increasing strategic importance of home infusion therapy.
Furthermore, in March 2021, Terumo and Glooko, a company specializing in remote patient monitoring software and mobile apps, announced a technological integration to jointly provide new diabetes data solutions globally. This collaboration enables the integration of data from Terumo's diabetes care devices into Glooko's diasend diabetes data management platform.
The infusion pumps segment accounted for the largest revenue share of over 51.3% in 2023. Infusion pumps, designed for controlled delivery of fluids, medications, and nutrients, were initially exclusive to healthcare facilities but are now widely adopted in outpatient settings. These devices ensure precision, reducing medication errors. The surge in home healthcare has driven the demand for syringe and ambulatory pumps. Smart pumps, featuring barcode technology, enhance patient identity verification, preventing administration errors. These pumps also provide alerts to healthcare workers in case of inappropriate dosage selection. The introduction of advanced infusion pumps, like the CADD-Solis ambulatory infusion pump by Smiths Medical, is expected to propel market growth in the forecast period.
Needleless connectors are anticipated to register the highest CAGR over the forecast period. Needless connectors are small devices employed in intravenous systems to reduce needlestick injuries, thereby preventing bacterial contamination and improving safety. These devices are evaluated on the basis of interstitial surface mechanisms, blood refluxes, visibility, and external surface mechanisms. Needless connectors enable smooth operative procedures, ensure safety, and aid in adhering to clinical practices.
The anti-infective segment dominated the market for home infusion therapy in 2023 with a revenue share of over 26.9%. This is attributed to the considerable number of procedures performed for the administration of antifungal and antibiotic drugs. It also helps reduce exposure to patients with other hospital-acquired infections (HAIs).
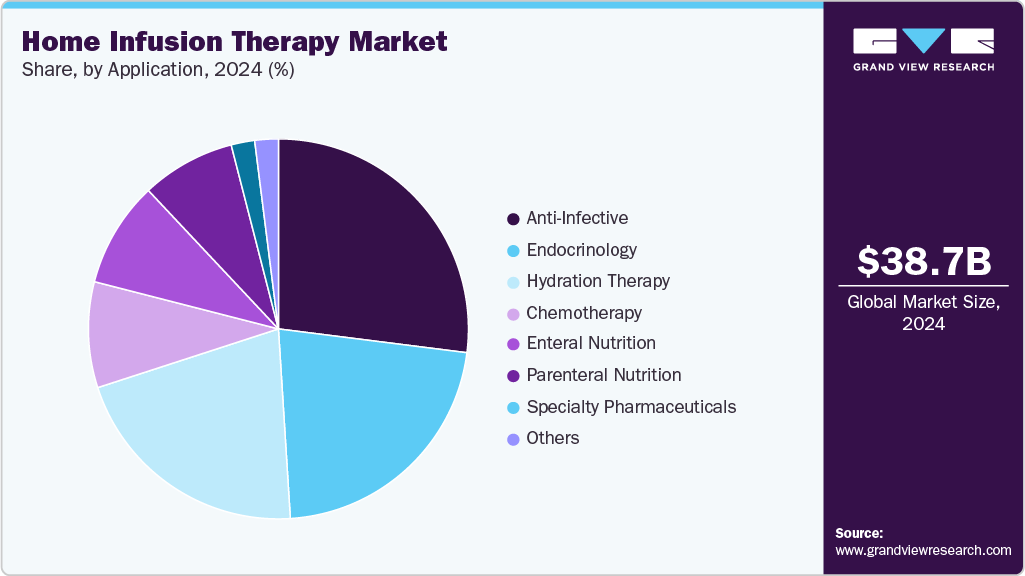
Chemotherapy is estimated to be the fastest-growing segment over the forecast period. With the growing incidences of cancer, the demand for pressure pumps is expected to increase in the coming years. Pumps used for chemotherapy at home are compact, continuous pressure pumps that do not require a battery and can hence be used for a longer period of time. With the help of these pumps, chemotherapy drugs can be administered at the appropriate infusion speed and in the right amounts.
North America dominated the market in 2023 with a revenue share of over 56.22% and this trend is expected to continue throughout the forecast period. This can be attributed to the increasing R&D in the region and the rising adoption of new technology in infusion pumps. The increasing need for long-term therapy for patients with certain conditions is driving the regional market. Development of alternate healthcare settings and home infusion services and shifting preference from acute care to home care settings due to the low cost and enhanced patient mobility would boost the growth of this market in the coming years.
The Asia Pacific market is expected to register the fastest CAGR over the forecast period. This is attributed to rising patient awareness regarding the benefits of home infusion therapy over in-hospital procedures and the growing prevalence of diabetes in the region. The growing geriatric population and the rise in chronic diseases in the region are expected to further fuel the market growth. According to the Times of India, around 75 million people over the age of 60 years suffer from some chronic disease in India, which might increase the adoption of home care services in the country.
Some of the key players operating in the market include Baxter, BD, Smiths Medical, Terumo Corporation, ICU Medical, etc
Baxter International Inc., commonly known as Baxter, is a global healthcare company that specializes in providing a wide range of medical products, therapies, and technologies. With a rich history dating back to the 1930s, Baxter has evolved into a leading player in the healthcare industry. The company develops innovative solutions for critical medical needs, including renal care, medication delivery, pharmaceuticals, and various therapeutic areas.
Becton, Dickinson and Company (BD) is a global medical technology company. BD specializes in developing and manufacturing medical devices, laboratory equipment, and diagnostic products aimed at advancing the diagnosis and treatment of various medical conditions. With a commitment to improving healthcare outcomes, BD focuses on delivering solutions in areas such as medication management, infection prevention, diagnostics, and biosciences.
In June 2023, Baxter International, an American healthcare company, introduced Progressa+ Next Gen ICU bed for addressing critical needs of patients at their homes. This technology makes it easier for nurses to take care of patients, while supporting therapy at home.
In May 2023, Fresenius Kabi, a global healthcare company, initiated an agreement with Premier, Inc., an American healthcare company, that resulted in pricing and term benefits for the Ivenix Infusion System. This system is designed to advance the reliability and simplicity of infusion pumps.
In May 2023, Option Care Health, a healthcare service provider, created an independent platform for home care services in collaboration with Amedisys Inc., a leading provider of home health services. This platform comprises pharmacists, dieticians, therapists, social workers, and others for providing high quality healthcare services at home.
In April 2023, CareFusion, currently owned by Becton Dickinson, an American medical technology company, launched an advanced ultrasound technology to provide clinicians with optimal IV insertions. More than 90% hospitalized patients receive the IV therapy, thus contributing towards the market growth of home infusion therapy.
In January 2022, ICU Medical, a California-based global operations company, finalized the acquisition of Smiths Medical from Smiths Group Plc for creating a leading infusion therapy company with a combined revenue of USD 2.5 billion.
In November 2021, Terumo Corporation, a global medical device company, developed a smartphone device for controlling insulin pump. This device can be utilized as a home infusion therapy by patients for harmonizing the insulin therapy at home.
Report Attribute |
Details |
Market size value in 2024 |
USD 38.66 billion |
Revenue forecast in 2030 |
USD 61.7 billion |
Growth Rate |
CAGR of 8.1% from 2024 to 2030 |
Actual data |
2018 - 2023 |
Forecast period |
2024 - 2030 |
Quantitative units |
Revenue in USD million/billion and CAGR from 2024 to 2030 |
Report coverage |
Revenue forecast, company ranking, competitive landscape, growth factors, and trends |
Segments covered |
Product, application, region |
Regional scope |
North America; Europe; Asia Pacific; Latin America; Middle East & Africa |
Country scope |
U.S.; Canada; U.K.; Germany; France; Italy; Spain; Netherlands; Belgium; Switzerland; Russia; Sweden; Norway; Denmark; China; India; Japan; Australia; South Korea; Malaysia; Indonesia; Singapore; Philippines; Thailand; Mexico; Brazil; Argentina; Colombia; Chile; South Africa; Saudi Arabia; UAE; Israel; Egypt; Kuwait |
Key companies profiled |
CVS/Coram; Option Care Health; BriovaRx/Diplomat (UnitedHealth Optum); PharMerica; Fresenius Kabi; ICU Medical, Inc.; B. Braun Melsungen AG; Baxter; BD; Caesarea Medical Electronics; Smiths Medical; Terumo Corporation; JMS Co. Ltd. |
Customization scope |
Free report customization (equivalent up to 8 analysts working days) with purchase. Addition or alteration to country, regional & segment scope. |
Pricing and purchase options |
Avail of customized purchase options to meet your exact research needs. Explore purchase options |
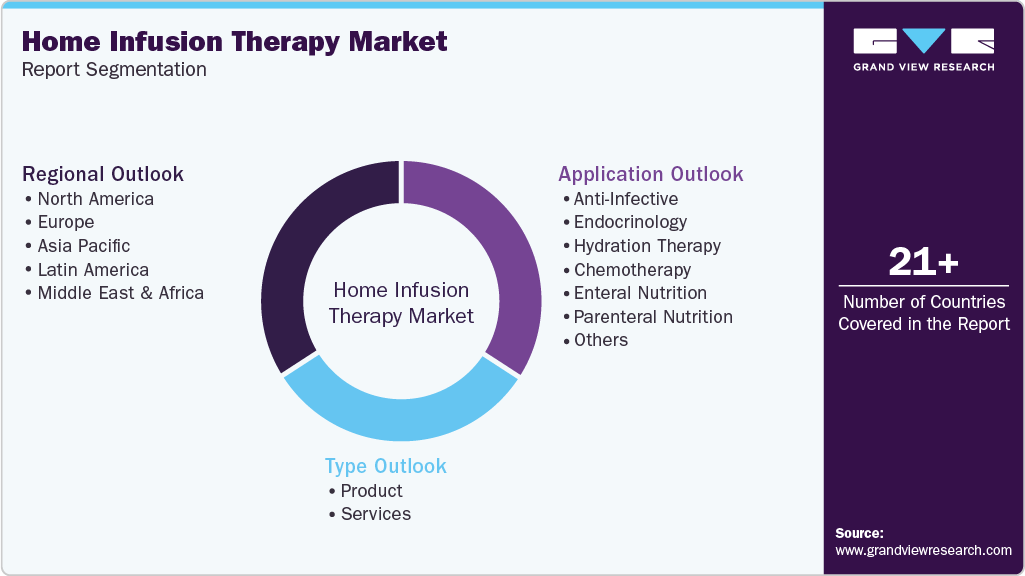
This report forecasts revenue growth at the global, regional, and country levels and provides an analysis of the latest industry trends and opportunities in each of the sub-segments from 2018 to 2030. For the purpose of this study, Grand View Research has segmented the global home infusion therapy market report on the basis of product, application, and region:
Product Outlook (Revenue, USD Million, 2018 - 2030)
Infusion Pumps
Elastomeric
Electromechanical
Gravity
Others
Intravenous Sets
IV Cannulas
Needleless Connectors
Application Outlook (Revenue, USD Million, 2018 - 2030)
Anti-infective
Endocrinology
Diabetes
Others
Hydration Therapy
Athletes
Others
Chemotherapy
Enteral Nutrition
Parenteral Nutrition
Specialty Pharmaceuticals
Others
Regional Outlook (Revenue, USD Million, 2018 - 2030)
North America
U.S.
Canada
Europe
U.K.
Germany
France
Spain
Italy
Netherlands
Belgium
Switzerland
Russia
Sweden
Norway
Denmark
Asia Pacific
India
Japan
China
Australia
South Korea
Malaysia
Indonesia
Singapore
Philippines
Thailand
Latin America
Brazil
Mexico
Argentina
Colombia
Chile
Middle East & Africa
South Africa
Saudi Arabia
UAE
Kuwait
Israel
Egypt
b. The global home infusion therapy market size was estimated at USD 33.5 billion in 2022 and is expected to reach USD 35.9 billion in 2023.
b. The global home infusion therapy market is expected to grow at a compound annual growth rate of 8.0% from 2023 to 2030 to reach USD 61.7 billion by 2030.
b. North America dominated the home infusion therapy market with a share of 56.5% in 2022. This can be attributed to increasing R&D in the region and the rising adoption of new technology in infusion pumps. The increasing need for long-term therapy for patients with certain conditions is driving the regional market growth.
b. Some key players operating in the home infusion therapy market include B. Braun Melsungen AG; Baxter; Caesarea Medical Electronics; CareFusion Corporation; Fresenius Kabi; ICU Medical, Inc.; JMS Co. Ltd.; Smiths Medical; and Terumo Corporation.
b. Key factors that are driving the home infusion therapy market growth include the increasing geriatric population with decreased mobility profile, rising preference for home care, and rapid technological advancements.
Table of Contents
Chapter 1. Methodology and Scope
1.1. Market Segmentation & Scope
1.1.1. Product
1.1.2. Application
1.1.3. Regional scope
1.1.4. Estimates and forecast timeline
1.2. Research Methodology
1.3. Information Procurement
1.3.1. Purchased database
1.3.2. GVR’s internal database
1.3.3. Secondary sources
1.3.4. Primary research
1.4. Information or Data Analysis
1.4.1. Data analysis models
1.5. Market Formulation & Validation
1.6. Model Details
1.6.1. Commodity flow analysis (Model 1)
1.6.1.1. Approach 1: Commodity flow approach
1.7. List of Secondary Sources
1.8. List of Primary Sources
1.9. Objectives
Chapter 2. Executive Summary
2.1. Market Outlook
2.2. Segment Outlook
2.3. Competitive Insights
Chapter 3. Home Infusion Therapy Market Variables, Trends & Scope
3.1. Market Lineage outlook
3.1.1. Parent market outlook
3.1.2. Related/ancillary market outlook
3.2. Market Dynamics
3.2.1. Market Driver Analysis
3.2.1.1. Increasing geriatric population
3.2.1.2. Rising prevalence of chronic diseases
3.2.1.3. Recent technological advancements in infusion pumps
3.2.1.4. Home healthcare as cost-effective alternative
3.2.1.5. Improving healthcare infrastructure in emerging economies
3.2.2. Market Restraint Analysis
3.2.2.1. Product recall
3.2.2.2. Presence of complicated reimbursement framework and reimbursement cuts
3.2.3. Industry Challenges
3.2.3.1. Rising cost of home infusion therapy
3.3. Home Infusion Therapy: Market Analysis Tools
3.3.1. Industry Analysis - Porter’s
3.3.1.1. Supplier Power
3.3.1.2. Buyer Power
3.3.1.3. Substitution Threat
3.3.1.4. Threat from new entrants
3.3.1.5. Competitive rivalry
3.3.2. PESTEL Analysis
3.3.2.1. Political Landscape
3.3.2.2. Environmental Landscape
3.3.2.3. Social Landscape
3.3.2.4. Technology Landscape
3.3.2.5. Legal Landscape
Chapter 4. Home Infusion Therapy Market: Segment Analysis, by Product, 2018 - 2030 (USD Million)
4.1. Definitions & Scope
4.2. Product market share analysis, 2023 & 2030
4.3. Segment Dashboard
4.4. Global Home Infusion Therapy Market, by Product, 2018 to 2030
4.5. Market Size & Forecasts and Trend Analyses, 2018 to 2030 for the following
4.5.1. Infusion pumps
4.5.1.1. Elastomeric
4.5.2.1 Electrochemical
4.5.2.2 Gravity
4.5.2.3 Others
4.5.2. Intravenous Sets
4.5.3. IV cannulas
4.5.4. Needleless connectors
Chapter 5. Home Infusion Therapy Market: Segment Analysis, By Application, 2018 - 2030 (USD Million)
5.1. Definitions & Scope
5.2. Application market share analysis, 2023 & 2030
5.3. Segment Dashboard
5.4. Global Home Infusion Therapy Market, By Application, 2018 to 2030
5.5. Market Size & Forecasts and Trend Analyses, 2018 to 2030 for the following
5.5.1. Anti-infective
5.5.2. Endocrinology
5.5.2.1 Diabetes
5.5.2.2 Others
5.5.3. Hydration Therapy
5.5.3.1. Athletes
5.5.3.2. Others
5.5.4. Chemotherapy
5.5.5. Enteral Nutrition
5.5.6. Parenteral Nutrition
5.5.7. Specialty Pharmaceuticals
5.5.8. Others
Chapter 6. Home Infusion Therapy Market: Regional Market Analysis, by Product, 2018 - 2030 (USD Million)
6.1. Regional Market Share Analysis, 2023 & 2030
6.2. Regional Market Dashboard
6.3. Regional Market Snapshot
6.4. Regional Market Share, 2023
6.5. Market Size, & Forecasts, and Trend Analysis, 2018 to 2030:
6.6. North America
6.6.1. Market estimates and forecast, by country, 2018 - 2030 (USD Million)
6.6.2. Market estimates and forecast, by Product, 2018 - 2030 (USD Million)
6.6.3. Market estimates and forecast, by Application, 2018 - 2030 (USD Million)
6.6.4. U.S.
6.6.4.1. Key Country Dynamics
6.6.4.2. Competitive Scenario
6.6.4.3. Regulatory Framework
6.6.4.4. Market estimates and forecast, by Product, 2018 - 2030 (USD Million)
6.6.4.5. Market estimates and forecast, by Application, 2018 - 2030 (USD Million)
6.6.5. Canada
6.6.5.1. Key Country Dynamics
6.6.5.2. Competitive Scenario
6.6.5.3. Regulatory Framework
6.6.5.4. Market estimates and forecast, by Product, 2018 - 2030 (USD Million)
6.6.5.5. Market estimates and forecast, by Application, 2018 - 2030 (USD Million)
6.7. Europe
6.7.1. Market estimates and forecast, by country, 2018 - 2030 (USD Million)
6.7.2. Market estimates and forecast, by Product, 2018 - 2030 (USD Million)
6.7.3. Market estimates and forecast, by Application, 2018 - 2030 (USD Million)
6.7.4. Germany
6.7.4.1. Key Country Dynamics
6.7.4.2. Competitive Scenario
6.7.4.3. Regulatory Framework
6.7.4.4. Market estimates and forecast, by Product, 2018 - 2030 (USD Million)
6.7.4.5. Market estimates and forecast, by Application, 2018 - 2030 (USD Million)
6.7.5. U.K.
6.7.5.1. Key Country Dynamics
6.7.5.2. Competitive Scenario
6.7.5.3. Regulatory Framework
6.7.5.4. Market estimates and forecast, by Product, 2018 - 2030 (USD Million)
6.7.5.5. Market estimates and forecast, by Application, 2018 - 2030 (USD Million)
6.7.6. France
6.7.6.1. Key Country Dynamics
6.7.6.2. Competitive Scenario
6.7.6.3. Regulatory Framework
6.7.6.4. Market estimates and forecast, by Product, 2018 - 2030 (USD Million)
6.7.6.5. Market estimates and forecast, by Application, 2018 - 2030 (USD Million)
6.7.7. Italy
6.7.7.1. Key Country Dynamics
6.7.7.2. Competitive Scenario
6.7.7.3. Regulatory Framework
6.7.7.4. Market estimates and forecast, by Product, 2018 - 2030 (USD Million)
6.7.7.5. Market estimates and forecast, by Application, 2018 - 2030 (USD Million)
6.7.8. Spain
6.7.8.1. Key Country Dynamics
6.7.8.2. Competitive Scenario
6.7.8.3. Regulatory Framework
6.7.8.4. Market estimates and forecast, by Product, 2018 - 2030 (USD Million)
6.7.8.5. Market estimates and forecast, by Application, 2018 - 2030 (USD Million)
6.7.9. Netherlands
6.7.9.1. Key Country Dynamics
6.7.9.2. Competitive Scenario
6.7.9.3. Regulatory Framework
6.7.9.4. Market estimates and forecast, by Product, 2018 - 2030 (USD Million)
6.7.9.5. Market estimates and forecast, by Application, 2018 - 2030 (USD Million)
6.7.10. Belgium
6.7.10.1. Key Country Dynamics
6.7.10.2. Competitive Scenario
6.7.10.3. Regulatory Framework
6.7.10.4. Market estimates and forecast, by Product, 2018 - 2030 (USD Million)
6.7.10.5. Market estimates and forecast, by Application, 2018 - 2030 (USD Million)
6.7.11. Switzerland
6.7.11.1. Key Country Dynamics
6.7.11.2. Competitive Scenario
6.7.11.3. Regulatory Framework
6.7.11.4. Market estimates and forecast, by Product, 2018 - 2030 (USD Million)
6.7.11.5. Market estimates and forecast, by Application, 2018 - 2030 (USD Million)
6.7.12. Russia
6.7.12.1. Key Country Dynamics
6.7.12.2. Competitive Scenario
6.7.12.3. Regulatory Framework
6.7.12.4. Market estimates and forecast, by Product, 2018 - 2030 (USD Million)
6.7.12.5. Market estimates and forecast, by Application, 2018 - 2030 (USD Million)
6.7.13. Sweden
6.7.13.1. Key Country Dynamics
6.7.13.2. Competitive Scenario
6.7.13.3. Regulatory Framework
6.7.13.4. Market estimates and forecast, by Product, 2018 - 2030 (USD Million)
6.7.13.5. Market estimates and forecast, by Application, 2018 - 2030 (USD Million)
6.7.14. Denmark
6.7.14.1. Key Country Dynamics
6.7.14.2. Competitive Scenario
6.7.14.3. Regulatory Framework
6.7.14.4. Market estimates and forecast, by Product, 2018 - 2030 (USD Million)
6.7.14.5. Market estimates and forecast, by Application, 2018 - 2030 (USD Million)
6.7.15. Norway
6.7.15.1. Key Country Dynamics
6.7.15.2. Competitive Scenario
6.7.15.3. Regulatory Framework
6.7.15.4. Market estimates and forecast, by Product, 2018 - 2030 (USD Million)
6.7.15.5. Market estimates and forecast, by Application, 2018 - 2030 (USD Million)
6.8. Asia Pacific
6.8.1. Market estimates and forecast, by country, 2018 - 2030 (USD Million)
6.8.2. Market estimates and forecast, by Product, 2018 - 2030 (USD Million)
6.8.3. Market estimates and forecast, by Application, 2018 - 2030 (USD Million)
6.8.4. China
6.8.4.1. Key Country Dynamics
6.8.4.2. Competitive Scenario
6.8.4.3. Regulatory Framework
6.8.4.4. Market estimates and forecast, by Product, 2018 - 2030 (USD Million)
6.8.4.5. Market estimates and forecast, by Application, 2018 - 2030 (USD Million)
6.8.5. Japan
6.8.5.1. Key Country Dynamics
6.8.5.2. Competitive Scenario
6.8.5.3. Regulatory Framework
6.8.5.4. Market estimates and forecast, by Product, 2018 - 2030 (USD Million)
6.8.5.5. Market estimates and forecast, by Application, 2018 - 2030 (USD Million)
6.8.6. India
6.8.6.1. Key Country Dynamics
6.8.6.2. Competitive Scenario
6.8.6.3. Regulatory Framework
6.8.6.4. Market estimates and forecast, by Product, 2018 - 2030 (USD Million)
6.8.6.5. Market estimates and forecast, by Application, 2018 - 2030 (USD Million)
6.8.7. Australia
6.8.7.1. Key Country Dynamics
6.8.7.2. Competitive Scenario
6.8.7.3. Regulatory Framework
6.8.7.4. Market estimates and forecast, by Product, 2018 - 2030 (USD Million)
6.8.7.5. Market estimates and forecast, by Application, 2018 - 2030 (USD Million)
6.8.8. South Korea
6.8.8.1. Key Country Dynamics
6.8.8.2. Competitive Scenario
6.8.8.3. Regulatory Framework
6.8.8.4. Market estimates and forecast, by Product, 2018 - 2030 (USD Million)
6.8.8.5. Market estimates and forecast, by Application, 2018 - 2030 (USD Million)
6.8.9. Malaysia
6.8.9.1. Key Country Dynamics
6.8.9.2. Competitive Scenario
6.8.9.3. Regulatory Framework
6.8.9.4. Market estimates and forecast, by Product, 2018 - 2030 (USD Million)
6.8.9.5. Market estimates and forecast, by Application, 2018 - 2030 (USD Million)
6.9.10 Indonesia
6.9.10.1 Key Country Dynamics
6.9.10.2 Competitive Scenario
6.9.10.3 Regulatory Framework
6.9.10.4 Market estimates and forecast, by Product, 2018 - 2030 (USD Million)
6.9.10.5 Market estimates and forecast, by Application, 2018 - 2030 (USD Million)
6.9.11 Singapore
6.9.11.1 Key Country Dynamics
6.9.11.2 Competitive Scenario
6.9.11.3 Regulatory Framework
6.9.11.4 Market estimates and forecast, by Product, 2018 - 2030 (USD Million)
6.9.11.5 Market estimates and forecast, by Application, 2018 - 2030 (USD Million)
6.9.12 Philippines
6.9.12.1 Key Country Dynamics
6.9.12.2 Competitive Scenario
6.9.12.3 Regulatory Framework
6.9.12.4 Market estimates and forecast, by Product, 2018 - 2030 (USD Million)
6.9.12.5 Market estimates and forecast, by Application, 2018 - 2030 (USD Million)
6.9.13 Thailand
6.9.13.1 Key Country Dynamics
6.9.13.2 Competitive Scenario
6.9.13.3 Regulatory Framework
6.9.13.4 Market estimates and forecast, by Product, 2018 - 2030 (USD Million)
6.9.13.5 Market estimates and forecast, by Application, 2018 - 2030 (USD Million)
6.10 Latin America
6.10.1 Market estimates and forecast, by country, 2018 - 2030 (USD Million)
6.10.2 Market estimates and forecast, by Product, 2018 - 2030 (USD Million)
6.10.3 Market estimates and forecast, by Application, 2018 - 2030 (USD Million)
6.10.4 Brazil
6.10.4.1 Key Country Dynamics
6.10.4.2 Competitive Scenario
6.10.4.3 Regulatory Framework
6.10.4.4 Market estimates and forecast, by Product, 2018 - 2030 (USD Million)
6.10.4.5 Market estimates and forecast, by Application, 2018 - 2030 (USD Million)
6.10.5 Mexico
6.10.5.1 Key Country Dynamics
6.10.5.2 Competitive Scenario
6.10.5.3 Regulatory Framework
6.10.5.4 Market estimates and forecast, by Product, 2018 - 2030 (USD Million)
6.10.5.5 Market estimates and forecast, by Application, 2018 - 2030 (USD Million)
6.10.6 Argentina
6.10.6.1 Key Country Dynamics
6.10.6.2 Competitive Scenario
6.10.6.3 Regulatory Framework
6.10.6.4 Market estimates and forecast, by Product, 2018 - 2030 (USD Million)
6.10.6.5 Market estimates and forecast, by Application, 2018 - 2030 (USD Million)
6.10.7 Colombia
6.10.7.1 Key Country Dynamics
6.10.7.2 Competitive Scenario
6.10.7.3 Regulatory Framework
6.10.7.4 Market estimates and forecast, by Product, 2018 - 2030 (USD Million)
6.10.7.5 Market estimates and forecast, by Application, 2018 - 2030 (USD Million)
6.10.8 Chile
6.10.8.1 Key Country Dynamics
6.10.8.2 Competitive Scenario
6.10.8.3 Regulatory Framework
6.10.8.4 Market estimates and forecast, by Product, 2018 - 2030 (USD Million)
6.10.8.5 Market estimates and forecast, by Application, 2018 - 2030 (USD Million)
6.11 Middle East and Africa
6.11.1 Market estimates and forecast, by country, 2018 - 2030 (USD Million)
6.11.2 Market estimates and forecast, by Product, 2018 - 2030 (USD Million)
6.11.3 Market estimates and forecast, by Application, 2018 - 2030 (USD Million)
6.11.4 South Africa
6.11.4.1 Key Country Dynamics
6.11.4.2 Competitive Scenario
6.11.4.3 Regulatory Framework
6.11.4.4 Market estimates and forecast, by Product, 2018 - 2030 (USD Million)
6.11.4.5 Market estimates and forecast, by Application, 2018 - 2030 (USD Million)
6.11.5 Saudi Arabia
6.11.5.1 Key Country Dynamics
6.11.5.2 Competitive Scenario
6.11.5.3 Regulatory Framework
6.11.5.4 Market estimates and forecast, by Product, 2018 - 2030 (USD Million)
6.11.5.5 Market estimates and forecast, by Application, 2018 - 2030 (USD Million)
6.11.6 UAE
6.11.6.1 Key Country Dynamics
6.11.6.2 Competitive Scenario
6.11.6.3 Regulatory Framework
6.11.6.4 Market estimates and forecast, by Product, 2018 - 2030 (USD Million)
6.11.6.5 Market estimates and forecast, by Application, 2018 - 2030 (USD Million)
6.11.7 Israel
6.11.7.1 Key Country Dynamics
6.11.7.2 Competitive Scenario
6.11.7.3 Regulatory Framework
6.11.7.4 Market estimates and forecast, by Product, 2018 - 2030 (USD Million)
6.11.7.5 Market estimates and forecast, by Application, 2018 - 2030 (USD Million)
6.11.8 Egypt
6.11.8.1 Key Country Dynamics
6.11.8.2 Competitive Scenario
6.11.8.3 Regulatory Framework
6.11.8.4 Market estimates and forecast, by Product, 2018 - 2030 (USD Million)
6.11.8.5 Market estimates and forecast, by Application, 2018 - 2030 (USD Million)
6.10.1 Kuwait
6.10.1.1 Key Country Dynamics
6.10.1.2 Competitive Scenario
6.10.1.3 Regulatory Framework
6.10.1.4 Market estimates and forecast, by Product, 2018 - 2030 (USD Million)
6.10.1.5 Market estimates and forecast, by Application, 2018 - 2030 (USD Million)
Chapter 7 Home Infusion Therapy Market - Competitive Analysis
7.10 Key companies profiled
7.10.1 Caesarea Medical Electronics
7.10.1.1 Company Overview
7.10.1.2 Financial Performance
7.10.1.3 Product Benchmarking
7.10.1.4 Strategic Initiatives
7.10.2 CareFusion Corporation
7.10.2.1 Company Overview
7.10.2.2 Financial Performance
7.10.2.3 Product Benchmarking
7.10.2.4 Strategic Initiatives
7.10.3 Baxter
7.10.3.1 Company Overview
7.10.3.2 Financial Performance
7.10.3.3 Product Benchmarking
7.10.3.4 Strategic Initiatives
7.10.4 B. Braun Melsungen AG
7.10.4.1 Company Overview
7.10.4.2 Financial Performance
7.10.4.3 Product Benchmarking
7.10.4.4 Strategic Initiatives
7.10.5 Fresenius Kabi
7.10.5.1 Company Overview
7.10.5.2 Financial Performance
7.10.5.3 Product Benchmarking
7.10.5.4 Strategic Initiatives
7.10.6 ICU Medical, Inc.
7.10.6.1 Company Overview
7.10.6.2 Financial Performance
7.10.6.3 Product Benchmarking
7.10.6.4 Strategic Initiatives
7.10.7 JMS Co. Ltd.
7.10.7.1 Company Overview
7.10.7.2 Financial Performance
7.10.7.3 Product Benchmarking
7.10.7.4 Strategic Initiatives
7.10.8 Smiths Medical
7.10.8.1 Company Overview
7.10.8.2 Financial Performance
7.10.8.3 Product Benchmarking
7.10.8.4 Strategic Initiatives
7.10.9 Terumo Corporation
7.10.9.1 Company Overview
7.10.9.2 Financial Performance
7.10.9.3 Product Benchmarking
7.10.9.4 Strategic Initiatives
List of Tables
Table 1 List of Secondary Sources
Table 2 List of Abbreviations
Table 3 Global Home Infusion Therapy Market, By Region 2018 - 2030 (USD Million)
Table 4 Global Home Infusion Therapy Market, By Product, 2018 - 2030 (USD Million)
Table 5 Global Home Infusion Therapy Market, By Application, 2018 - 2030 (USD Million)
Table 6 North America Home Infusion Therapy Market, By Country, 2018 - 2030 (USD Million)
Table 7 North America Home Infusion Therapy Market, By Product, 2018 - 2030 (USD Million)
Table 8 North America Home Infusion Therapy Market, By Application, 2018 - 2030 (USD Million)
Table 9 U.S. Home Infusion Therapy Market, By Product, 2018 - 2030 (USD Million)
Table 10 U.S. Home Infusion Therapy Market, By Application, 2018 - 2030 (USD Million)
Table 11 Canada Home Infusion Therapy Market, By Product, 2018 - 2030 (USD Million)
Table 12 Canada Home Infusion Therapy Market, By Application, 2018 - 2030 (USD Million)
Table 13 Europe Home Infusion Therapy Market, By Country, 2018 - 2030 (USD Million)
Table 14 Europe Home Infusion Therapy Market, By Product, 2018 - 2030 (USD Million)
Table 15 Europe Home Infusion Therapy Market, By Application, 2018 - 2030 (USD Million)
Table 16 U.K. Home Infusion Therapy Market, By Product, 2018 - 2030 (USD Million)
Table 17 U.K. Home Infusion Therapy Market, By Application, 2018 - 2030 (USD Million)
Table 18 Germany Home Infusion Therapy Market, By Product, 2018 - 2030 (USD Million)
Table 19 Germany Home Infusion Therapy Market, By Application, 2018 - 2030 (USD Million)
Table 20 France Home Infusion Therapy Market, By Product, 2018 - 2030 (USD Million)
Table 21 France Home Infusion Therapy Market, By Application, 2018 - 2030 (USD Million)
Table 22 Italy Home Infusion Therapy Market, By Product, 2018 - 2030 (USD Million)
Table 23 Italy Home Infusion Therapy Market, By Application, 2018 - 2030 (USD Million)
Table 24 Spain Home Infusion Therapy Market, By Product, 2018 - 2030 (USD Million)
Table 25 Spain Home Infusion Therapy Market, By Application, 2018 - 2030 (USD Million)
Table 26 Netherlands Home Infusion Therapy Market, By Product, 2018 - 2030 (USD Million)
Table 27 Netherlands Home Infusion Therapy Market, By Application, 2018 - 2030 (USD Million)
Table 28 Belgium Home Infusion Therapy Market, By Product, 2018 - 2030 (USD Million)
Table 29 Belgium Home Infusion Therapy Market, By Application, 2018 - 2030 (USD Million)
Table 30 Switzerland Home Infusion Therapy Market, By Product, 2018 - 2030 (USD Million)
Table 31 Switzerland Home Infusion Therapy Market, By Application, 2018 - 2030 (USD Million)
Table 32 Russia Home Infusion Therapy Market, By Product, 2018 - 2030 (USD Million)
Table 33 Russia Home Infusion Therapy Market, By Application, 2018 - 2030 (USD Million)
Table 34 Sweden Home Infusion Therapy Market, By Product, 2018 - 2030 (USD Million)
Table 35 Sweden Home Infusion Therapy Market, By Application, 2018 - 2030 (USD Million)
Table 36 Norway Home Infusion Therapy Market, By Product, 2018 - 2030 (USD Million)
Table 37 Norway Home Infusion Therapy Market, By Application, 2018 - 2030 (USD Million)
Table 38 Denmark Home Infusion Therapy Market, By Product, 2018 - 2030 (USD Million)
Table 39 Denmark Home Infusion Therapy Market, By Application, 2018 - 2030 (USD Million)
Table 40 Asia Pacific Home Infusion Therapy Market, By Country, 2018 - 2030 (USD Million)
Table 41 Asia Pacific Home Infusion Therapy Market, By Product, 2018 - 2030 (USD Million)
Table 42 Asia Pacific Home Infusion Therapy Market, By Application, 2018 - 2030 (USD Million)
Table 43 India Home Infusion Therapy Market, By Product, 2018 - 2030 (USD Million)
Table 44 India Home Infusion Therapy Market, By Application, 2018 - 2030 (USD Million)
Table 45 Japan Home Infusion Therapy Market, By Product, 2018 - 2030 (USD Million)
Table 46 Japan Home Infusion Therapy Market, By Application, 2018 - 2030 (USD Million)
Table 47 China Home Infusion Therapy Market, By Product, 2018 - 2030 (USD Million)
Table 48 China Home Infusion Therapy Market, By Application, 2018 - 2030 (USD Million)
Table 49 Australia Home Infusion Therapy Market, By Product, 2018 - 2030 (USD Million)
Table 50 Australia Home Infusion Therapy Market, By Application, 2018 - 2030 (USD Million)
Table 51 South Korea Home Infusion Therapy Market, By Product, 2018 - 2030 (USD Million)
Table 52 South Korea Home Infusion Therapy Market, By Application, 2018 - 2030 (USD Million)
Table 53 Malaysia Home Infusion Therapy Market, By Product, 2018 - 2030 (USD Million)
Table 54 Malaysia Home Infusion Therapy Market, By Application, 2018 - 2030 (USD Million)
Table 55 Indonesia Home Infusion Therapy Market, By Product, 2018 - 2030 (USD Million)
Table 56 Indonesia Home Infusion Therapy Market, By Application, 2018 - 2030 (USD Million)
Table 57 Singapore Home Infusion Therapy Market, By Product, 2018 - 2030 (USD Million)
Table 58 Singapore Home Infusion Therapy Market, By Application, 2018 - 2030 (USD Million)
Table 59 Philippines Home Infusion Therapy Market, By Product, 2018 - 2030 (USD Million)
Table 60 Philippines Home Infusion Therapy Market, By Application, 2018 - 2030 (USD Million)
Table 61 Thailand Home Infusion Therapy Market, By Product, 2018 - 2030 (USD Million)
Table 62 Thailand Home Infusion Therapy Market, By Application, 2018 - 2030 (USD Million)
Table 63 Latin America Home Infusion Therapy Market, By Country, 2018 - 2030 (USD Million)
Table 64 Latin America Home Infusion Therapy Market, By Product, 2018 - 2030 (USD Million)
Table 65 Latin America Home Infusion Therapy Market, By Application, 2018 - 2030 (USD Million)
Table 66 Brazil Home Infusion Therapy Market, By Product, 2018 - 2030 (USD Million)
Table 67 Brazil Home Infusion Therapy Market, By Application, 2018 - 2030 (USD Million)
Table 68 Mexico Home Infusion Therapy Market, By Product, 2018 - 2030 (USD Million)
Table 69 Mexico Home Infusion Therapy Market, By Application, 2018 - 2030 (USD Million)
Table 70 Argentina Home Infusion Therapy Market, By Product, 2018 - 2030 (USD Million)
Table 71 Argentina Home Infusion Therapy Market, By Application, 2018 - 2030 (USD Million)
Table 72 Colombia Home Infusion Therapy Market, By Product, 2018 - 2030 (USD Million)
Table 73 Colombia Home Infusion Therapy Market, By Application, 2018 - 2030 (USD Million)
Table 74 Chile Home Infusion Therapy Market, By Product, 2018 - 2030 (USD Million)
Table 75 Chile Home Infusion Therapy Market, By Application, 2018 - 2030 (USD Million)
Table 76 MEA Home Infusion Therapy Market, By Country, 2018 - 2030 (USD Million)
Table 77 MEA Home Infusion Therapy Market, By Product, 2018 - 2030 (USD Million)
Table 78 MEA Home Infusion Therapy Market, By Application, 2018 - 2030 (USD Million)
Table 79 South Africa Home Infusion Therapy Market, By Product, 2018 - 2030 (USD Million)
Table 80 South Africa Home Infusion Therapy Market, By Application, 2018 - 2030 (USD Million)
Table 81 Saudi Arabia Home Infusion Therapy Market, By Product, 2018 - 2030 (USD Million)
Table 82 Saudi Arabia Home Infusion Therapy Market, By Application, 2018 - 2030 (USD Million)
Table 83 UAE Home Infusion Therapy Market, By Product, 2018 - 2030 (USD Million)
Table 84 UAE Home Infusion Therapy Market, By Application, 2018 - 2030 (USD Million)
Table 85 Israel Home Infusion Therapy Market, By Product, 2018 - 2030 (USD Million)
Table 86 Israel Home Infusion Therapy Market, By Application, 2018 - 2030 (USD Million)
Table 87 Egypt Home Infusion Therapy Market, By Product, 2018 - 2030 (USD Million)
Table 88 Egypt Home Infusion Therapy Market, By Application, 2018 - 2030 (USD Million)
Table 89 Kuwait Home Infusion Therapy Market, By Product, 2018 - 2030 (USD Million)
Table 90 Kuwait Home Infusion Therapy Market, By Application, 2018 - 2030 (USD Million)
List of Figures
Fig. 1 Market research process
Fig. 2 Data triangulation techniques
Fig. 3 Primary research pattern
Fig. 4 Market research approaches
Fig. 5 Value-chain-based sizing & forecasting
Fig. 6 Market formulation & validation
Fig. 7 Home Infusion Therapy Market: Market snapshot
Fig. 8 Home Infusion Therapy Market: Market segmentation
Fig. 9 Home Infusion Therapy Market Strategy framework
Fig. 10 Parent market outlook
Fig. 11 Related/ancillary market outlook
Fig. 12 Home Infusion Therapy Market driver impact
Fig. 13 Home Infusion Therapy Market restraint impact
Fig. 14 Home Infusion Therapy Market Porter’s Five Forces Analysis
Fig. 15 Home Infusion Therapy Market PESTEL analysis
Fig. 16 Home Infusion Therapy Market segment dashboard
Fig. 17 Home Infusion Therapy Market: Product Movement Analysis
Fig. 18 Infusion pumps estimates and forecast, 2018 - 2030 (USD Million)
Fig. 19 Intravenous Sets estimates and forecast, 2018 - 2030 (USD Million)
Fig. 20 IV cannulas estimates and forecast, 2018 - 2030 (USD Million)
Fig. 21 Needleless connectors estimates and forecast, 2018 - 2030 (USD Million)
Fig. 22 Home Infusion Therapy Market segment dashboard
Fig. 23 Home Infusion Therapy Market: Application Movement Analysis
Fig. 24 Anti-Infective market estimates and forecast, 2018 - 2030 (USD Million)
Fig. 25 Endocrinology market estimates and forecast, 2018 - 2030 (USD Million)
Fig. 26 Hydration Therapy market estimates and forecast, 2018 - 2030 (USD Million)
Fig. 27 Chemotherapy market estimates and forecast, 2018 - 2030 (USD Million)
Fig. 28 Enteral Nutrition market estimates and forecast, 2018 - 2030 (USD Million)
Fig. 29 Parenteral Nutrition market estimates and forecast, 2018 - 2030 (USD Million)
Fig. 30 Specialty Pharmaceuticals market estimates and forecast, 2018 - 2030 (USD Million)
Fig. 31 Others market estimates and forecast, 2018 - 2030 (USD Million)
Fig. 32 Global Home Infusion Therapy Market: Regional movement analysis
Fig. 33 Global Home Infusion Therapy Market: Regional outlook and key takeaways
Fig. 34 Global market share, by region
Fig. 35 North America market estimates and forecast, 2018 - 2030 (USD Million)
Fig. 36 U.S. market estimates and forecast, 2018 - 2030 (USD Million)
Fig. 37 Canada market estimates and forecast, 2018 - 2030 (USD Million)
Fig. 38 Europe market estimates and forecast, 2018 - 2030 (USD Million)
Fig. 39 U.K. market estimates and forecast, 2018 - 2030 (USD Million)
Fig. 40 Germany market estimates and forecast, 2018 - 2030 (USD Million)
Fig. 41 France market estimates and forecast, 2018 - 2030 (USD Million)
Fig. 42 Italy market estimates and forecast, 2018 - 2030 (USD Million)
Fig. 43 Spain market estimates and forecast, 2018 - 2030 (USD Million)
Fig. 44 Netherlands market estimates and forecast, 2018 - 2030 (USD Million)
Fig. 45 Belgium market estimates and forecast, 2018 - 2030 (USD Million)
Fig. 46 Switzerland market estimates and forecast, 2018 - 2030 (USD Million)
Fig. 47 Russia market estimates and forecast, 2018 - 2030 (USD Million)
Fig. 48 Sweden market estimates and forecast, 2018 - 2030 (USD Million)
Fig. 49 Norway market estimates and forecast, 2018 - 2030 (USD Million)
Fig. 50 Denmark market estimates and forecast, 2018 - 2030 (USD Million)
Fig. 51 Asia Pacific market estimates and forecast, 2018 - 2030 (USD Million)
Fig. 52 China market estimates and forecast, 2018 - 2030 (USD Million)
Fig. 53 Japan market estimates and forecast, 2018 - 2030 (USD Million)
Fig. 54 India market estimates and forecast, 2018 - 2030 (USD Million)
Fig. 55 Australia market estimates and forecast, 2018 - 2030 (USD Million)
Fig. 56 South Korea market estimates and forecast, 2018 - 2030 (USD Million)
Fig. 57 Malaysia market estimates and forecast, 2018 - 2030 (USD Million)
Fig. 58 Indonesia market estimates and forecast, 2018 - 2030 (USD Million)
Fig. 59 Singapore market estimates and forecast, 2018 - 2030 (USD Million)
Fig. 60 Philippines market estimates and forecast, 2018 - 2030 (USD Million)
Fig. 61 Thailand market estimates and forecast, 2018 - 2030 (USD Million)
Fig. 62 Latin America market estimates and forecast, 2018 - 2030 (USD Million)
Fig. 63 Brazil market estimates and forecast, 2018 - 2030 (USD Million)
Fig. 64 Mexico market estimates and forecast, 2018 - 2030 (USD Million)
Fig. 65 Argentina market estimates and forecast, 2018 - 2030 (USD Million)
Fig. 66 Colombia market estimates and forecast, 2018 - 2030 (USD Million)
Fig. 67 Chile market estimates and forecast, 2018 - 2030 (USD Million)
Fig. 68 Middle East and Africa. market estimates and forecast, 2018 - 2030 (USD Million)
Fig. 69 South Africa market estimates and forecast, 2018 - 2030 (USD Million)
Fig. 70 Saudi Arabia market estimates and forecast, 2018 - 2030 (USD Million)
Fig. 71 UAE market estimates and forecast, 2018 - 2030 (USD Million)
Fig. 72 Israel market estimates and forecast, 2018 - 2030 (USD Million)
Fig. 73 Egypt market estimates and forecast, 2018 - 2030 (USD Million)
Fig. 74 Kuwait market estimates and forecast, 2018 - 2030 (USD Million)
Market Segmentation
The geriatric population is increasing exponentially in the U.S. According to the U.S. Census Bureau, by 2034, over 77.0 million individuals in the U.S. will be aged 65 & above and this number is estimated to reach 94.7 million by 2060. With the surging geriatric population, the incidence of different health conditions necessitating long-term care is projected to increase. Further, the growing preference of people of this age group to avail home healthcare services is likely to significantly boost the demand for home infusion therapy products & services during the forecast period. Aging is believed to be a major impacting factor for chronic diseases, which require prolonged care. Major diseases related to aging include Alzheimer’s, dementia, diabetes, and various orthopedic disorders. This also impacts the preference for home care. For instance, about 70% of home healthcare patients belong to the age group of 65 years & above. Moreover, the growing geriatric population in Asian countries and presence of large untapped opportunities in emerging countries such as India and China, among others, are expected to drive market growth during the forecast period.
According to the WHO, chronic diseases including respiratory disorders, cancer, diabetes, cardiovascular diseases, and other life-threatening diseases account for over 60% of the total number of deaths and over 43% of the global diseases. Home infusion is considered to be a cost-effective alternative to a prolonged hospital stay or a nursing home placement for patients battling with chronic diseases. The administration of medications from the comfort of homes or home infusion offers various advantages including better experience, faster recovery, and fewer complications. Home infusion therapy enables most patients to resume their daily activities, thereby drastically enhancing the quality of their lives.
Medicare reimbursement accessible for home healthcare providers and patients is one of the significant factors fueling the market growth of home infusion therapy. However, the recent reimbursement restrictions and rebasing of home health fund are anticipated to hamper market growth during the forecast period. In addition, according to National Home Infusion Association, the professional services benefit, covered by the CMS in the Medicare Part B home infusion drugs, requires physical presence of a nurse at the patient’s home for the provider to be reimbursed. Thus, this could lead to inconvenience for patients in case of unavailability of nurses, which may limit the adoption of these therapies. Nonetheless, supportive initiatives by companies coupled with the introduction of Preserving Patient Access to Home Infusion Act are anticipated to reduce the overall adverse impact on market growth.
This section will provide insights into the contents included in this home infusion therapy market report and help gain clarity on the structure of the report to assist readers in navigating smoothly.
Industry overview
Industry trends
Market drivers and restraints
Market size
Growth prospects
Porter’s analysis
PESTEL analysis
Key market opportunities prioritized
Competitive landscape
Company overview
Financial performance
Product benchmarking
Latest strategic developments
Market size, estimates, and forecast from 2017 to 2030
Market estimates and forecast for product segments up to 2030
Regional market size and forecast for product segments up to 2030
Market estimates and forecast for application segments up to 2030
Regional market size and forecast for application segments up to 2030
Company financial performance
A three-pronged approach was followed for deducing the home infusion therapy market estimates and forecasts. The process has three steps: information procurement, analysis, and validation. The whole process is cyclical, and steps repeat until the estimates are validated. The three steps are explained in detail below:
Information procurement: Information procurement is one of the most extensive and important stages in our research process, and quality data is critical for accurate analysis. We followed a multi-channel data collection process for home infusion therapy market to gather the most reliable and current information possible.
Analysis: We mine the data collected to establish baselines for forecasting, identify trends and opportunities, gain insight into consumer demographics and drivers, and so much more. We utilized different methods of home infusion therapy market data depending on the type of information we’re trying to uncover in our research.
Market Research Efforts: Bottom-up Approach for estimating and forecasting demand size and opportunity, top-down Approach for new product forecasting and penetration, and combined approach of both Bottom-up and Top-down for full coverage analysis.
Value-Chain-Based Sizing & Forecasting: Supply-side estimates for understanding potential revenue through competitive benchmarking, forecasting, and penetration modeling.
Demand-side estimates for identifying parent and ancillary markets, segment modeling, and heuristic forecasting.
Qualitative Functional Deployment (QFD) Modelling for market share assessment.
Market formulation and validation: We mine the data collected to establish baselines for forecasting, identify trends and opportunities, gain insight into consumer demographics and drivers, and so much more. We utilize different methods of data analysis depending on the type of information we’re trying to uncover in our research.
Market Formulation: This step involves the finalization of market numbers. This step on an internal level is designed to manage outputs from the Data Analysis step.
Data Normalization: The final market estimates and forecasts are then aligned and sent to industry experts, in-panel quality control managers for validation.
This step also entails the finalization of the report scope and data representation pattern.
Validation: The process entails multiple levels of validation. All these steps run in parallel, and the study is forwarded for publishing only if all three levels render validated results.
The home infusion therapy market was categorized into four segments, namely product (Infusion pumps, Intravenous Sets, IV cannulas, Needleless connectors), application (Anti-Infective, Endocrinology, Hydration Therapy, Chemotherapy, Enteral Nutrition, Parenteral Nutrition, Specialty Pharmaceuticals) and region (North America, Europe, Asia Pacific, Latin America, Middle East & Africa).
The home infusion therapy market was segmented into product, application, and regions. The demand at a segment level was deduced using a funnel method. Concepts like the TAM, SAM, SOM, etc., were put into practice to understand the demand. We at GVR deploy three methods to deduce market estimates and determine forecasts. These methods are explained below:
Demand estimation of each product across countries/regions summed up to from the total market.
Variable analysis for demand forecast.
Demand estimation via analyzing paid database, and company financials either via annual reports or paid database.
Primary interviews for data revalidation and insight collection.
Used extensively for new product forecasting or analyzing penetration levels.
Tool used invoice product flow and penetration models Use of regression multi-variant analysis for forecasting Involves extensive use of paid and public databases.
Primary interviews and vendor-based primary research for variable impact analysis.
The home infusion therapy market was analyzed at a regional level. The globe was divided into North America, Europe, Asia Pacific, Latin America, Middle East & Africa, keeping in focus variables like consumption patterns, export-import regulations, consumer expectations, etc. These regions were further divided into twenty-three countries, namely, the U.S.; Canada; the UK; Germany; France; Italy; Spain; Denmark, Sweden, Norway, Japan; India; China; Australia; South Korea; Thailand, Brazil; Mexico; Argentina; South Africa; Saudi Arabia; UAE, Kuwait.
All three above-mentioned market research methodologies were applied to arrive at regional-level conclusions. The regions were then summed up to form the global market.
The home infusion therapy market was analyzed via companies operating in the sector. Analyzing these companies and cross-referencing them to the demand equation helped us validate our assumptions and conclusions. Key market players analyzed include:
B. Braun Melsungen AG -B. Braun Melsungen AG provides healthcare products and services for anesthesia, emergency care, surgical procedures, extracorporeal blood treatment, and intensive care units. The company operates through four divisions: B. Braun Avitum, Hospital Care, Aesculap, and Out Patient Market. It has more than 260 subsidiaries and manufacturing sites that are located in the U.S., Switzerland, Vietnam, Brazil, and Malaysia. In addition, B. Braun has operations in over 60 countries worldwide. It offers products and therapies pertaining to infusion therapy, laparoscopic surgery, wound management, orthopedic joint replacement, neurology, pain therapy, and nutrition therapy, among others.
Baxter - Baxter manufactures and distributes pharmaceutical and medical devices for the treatment of kidney diseases, immune disorders, hemophilia, and other chronic & acute health conditions. The company also offers IV solutions products, which are used for drug delivery processes, and inhalation anesthetics for the treatment of irreversible kidney failure & end-stage renal diseases. Baxter operates through two segments: Medical Products and Biosciences. In the Biosciences segment, the company processes plasma-based proteins and recombinants for the treatment of bleeding disorders. Baxter operates in over 27 countries and markets its products in more than 100 countries across the world.
Fresenius Kabi AG - Fresenius Kabi AG is engaged in medicines and technologies for clinical nutrition, transfusion, and infusion. Its product line comprises clinical nutrition products, infusion therapies, and a comprehensive range of IV generic drugs, as well as medical devices for administration. Further, the company offers solutions for cell therapies, blood collection & storage, and transfusion medicines. The company operates in more than 100 countries worldwide.
ICU Medical, Inc. - ICU Medical, Inc. develops & markets pharmaceuticals & medical devices as well as technologies used in critical care applications, oncology, and vascular therapy. The company’s product line comprises innovative hemodynamic monitoring systems, needle-free closed blood sampling systems, advanced sensor catheters, closed-system hazardous drug handling devices & systems, custom infusion sets, and needle-free vascular access devices. The company specializes in nursing, medical devices, emergency care, infection control, healthcare informatics, patient safety, IV therapy, closed system transfer devices, IV workflow software, IV safety software, IV smartpumps, CSTDs, needle-less IV solutions, IV nutritionals, and pharmaceuticals.
JMS Co. Ltd. - JMS Co. Ltd. Manufactures and distributes semisolid nutrition feeding devices for infusion & transfusion therapies, syringe pumps, infusion pumps, oral/enteral nutrition systems, extension tubes, safety venous indwelling catheters, safety scalp vein sets, disposable needles & syringes, infusion sets with needleless access port, and transfusion & infusion sets. Moreover, the company offers hemodialysis machines, central dialysate delivery systems, safety Arteriovenous (AV) fistula needles, hemodialysis blood tubing sets, hemodialysis kits, and dialysis solutions for CAPD.
Smiths Medical - Smiths Medical develops, manufactures, and supplies medical devices and specializes in delivering equipment for hospital, home, emergency, and specialty settings. It also offers emergency healthcare solutions for homeland, defense, and medical-grade tubing products for industrial use. Moreover, the company offers veterinary devices, OEM services, medical device solutions for preclinical & clinical research, and monitoring & respiratory equipment. Smiths Medical offers products via its sales and distribution network in the U.S. as well as internationally. The company’s manufacturing facilities are located in the U.S., the UK, Mexico, and Italy.
Terumo Corporation - Terumo Corporation manufactures, distributes, and supplies medical devices & accessories across the world. The company also offers endovascular therapy solutions, blood management systems, and hollow-fiber technology solutions. Terumo Corporation’s Terumo Interventional Systems (TIS) is known for its leadership in embolization solutions, minimally invasive entry site management, and lesion access. The company has operations in more than 160 countries worldwide.
Becton, Dickinson and Company - Becton, Dickinson and Company offers medical technology solutions across the globe. The company develops, manufactures, and sells a wide range of diagnostic products, devices, laboratory equipment, and medical products. It offers products to general public, clinical laboratories, life science researchers, healthcare institutions, and pharmaceuticals industry. The company operates through two business segments—BD Life Sciences and BD Medical. It has headquarters in the U.S. and presence in Europe, Greater Asia, Canada, the MEA, and Latin America.
Coram LLC - Coram LLC offers infusion therapies & services to patients through a network of more than 85 locations, including 65 ambulatory infusion suites. The company provides infusion services pertaining to anti-infectives, nutrition, inotropes, Immunoglobulin (Ig), alpha-1, pre- & post-transplant, hemophilia, and pain & palliative care to all age groups. In addition, Coram LLC provides patient education, along with therapies, to patients and their family members.
Option Care Health, Inc. - Option Care Health, Inc. is a major provider of alternate treatment site and home infusion therapy services. The company’s service offerings include administration & distribution of injectable & infused medications, clinical & compliance management, reimbursement support, and patient care coordination. It offers services to pharmaceutical manufacturers, patients, physicians, managed care organizations, and other third parties. In addition, the company provides specialized therapies & services, Ig infusion therapy solutions, and nutrition support, among others. The company serves over 100 alternate treatment sites and more than 85 infusion pharmacies.
Supply Side Estimates
Company revenue estimation via referring to annual reports, investor presentations, and Hoover’s.
Segment revenue determination via variable analysis and penetration modeling.
Competitive benchmarking to identify market leaders and their collective revenue shares.
Forecasting via analyzing commercialization rates, pipelines, market initiatives, distribution networks, etc.
Demand side estimates
Identifying parent markets and ancillary markets
Segment penetration analysis to obtain pertinent
revenue/volume
Heuristic forecasting with the help of subject matter experts
Forecasting via variable analysis
Understanding market dynamics (in terms of drivers, restraints, & opportunities) in the countries.
Understanding trends & variables in the individual countries & their impact on growth and using analytical tools to provide high-level insights into the market dynamics and the associated growth pattern.
Understanding market estimates and forecasts (with the base year as 2022, historic information from 2018 to 2020, and forecast from 2023 to 2030). Regional estimates & forecasts for each category are available and are summed up to form the global market estimates.
The report provides market value for the base year 2022 and a yearly forecast till 2030 in terms of revenue/volume or both. The market for each of the segment outlooks has been provided on region & country basis for the above-mentioned forecast period.
The key industry dynamics, major technological trends, and application markets are evaluated to understand their impact on the demand for the forecast period. The growth rates were estimated using correlation, regression, and time-series analysis.
We have used the bottom-up approach for market sizing, analyzing key regional markets, dynamics, & trends for various products and end-users. The total market has been estimated by integrating the country markets.
All market estimates and forecasts have been validated through primary interviews with the key industry participants.
Inflation has not been accounted for to estimate and forecast the market.
Numbers may not add up due to rounding off.
Europe consists of EU-8, Central & Eastern Europe, along with the Commonwealth of Independent States (CIS).
Asia Pacific includes South Asia, East Asia, Southeast Asia, and Oceania (Australia & New Zealand).
Latin America includes Central American countries and the South American continent
Middle East includes Western Asia (as assigned by the UN Statistics Division) and the African continent.
GVR strives to procure the latest and unique information for reports directly from industry experts, which gives it a competitive edge. Quality is of utmost importance to us, therefore every year we focus on increasing our experts’ panel. Primary interviews are one of the critical steps in identifying recent market trends and scenarios. This process enables us to justify and validate our market estimates and forecasts to our clients. With more than 8,000 reports in our database, we have connected with some key opinion leaders across various domains, including healthcare, technology, consumer goods, and the chemical sector. Our process starts with identifying the right platform for a particular type of report, i.e., emails, LinkedIn, seminars, or telephonic conversation, as every report is unique and requires a differentiated approach.
We send out questionnaires to different experts from various regions/ countries, which is dependent on the following factors:
Report/Market scope: If the market study is global, we send questionnaires to industry experts across various regions, including North America, Europe, Asia Pacific, Latin America, and MEA.
Market Penetration: If the market is driven by technological advancements, population density, disease prevalence, or other factors, we identify experts and send out questionnaires based on region or country dominance.
The time to start receiving responses from industry experts varies based on how niche or well-penetrated the market is. Our reports include a detailed chapter on the KoL opinion section, which helps our clients understand the perspective of experts already in the market space.
NEED A CUSTOM REPORT?
We can customize every report - free of charge - including purchasing stand-alone sections or country-level reports, as well as offer affordable discounts for start-ups & universities. Contact us now
We are GDPR and CCPA compliant! Your transaction & personal information is safe and secure. For more details, please read our privacy policy.
"The quality of research they have done for us has been excellent."