The global heat transfer fluids market size was estimated at USD 11.06 billion in 2023 and is anticipated to grow at a compound annual growth rate (CAGR) of 3.7% from 2024 to 2030. The rapid adoption of concentrated solar power globally is one of the major factors driving demand. Heat transfer fluids are industrial products derived from petroleum sources that prevent overheating and store thermal energy. The primary raw materials involved in production are crude oil, silica, and base oils. The essential characteristics that define a heat transfer fluid are low viscosity, non-corrosive nature, high thermal conductivity and diffusivity, and extreme phase transition temperatures.
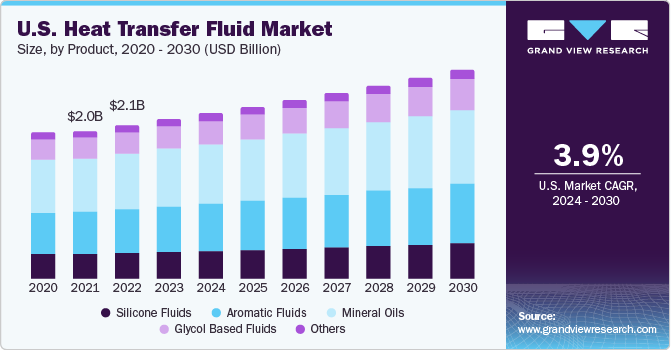
Heat transfer fluids are traditionally used for the sole purpose of transferring heat to the process stream. However, the selection of the right HTF is a multi-dimensional complication wherein factors such as pumpability, thermal stability, and pressure requirements are put into consideration. Heat transfer fluids are gaining significant importance in their applications, such as extracting heat from the sun in concentrated solar panels to processing gas & oil in cold climatic conditions.
The COVID-19 pandemic caused severe disruption in businesses and supply chains. The negative impact of a pandemic on the oil & gas industry also hampered the growth of the heat transfer fluid market growth. The decrease in supply and demand for oil & gas, especially in North America and Europe, halted the onshore and offshore production processes, impacting the growth of the heat transfer fluids market. The suspension of new solar power projects installation work and disruption in activities of operational plants also obstructed the market.
The U.S. is one of the critical contributors to the global installed CSP capacity. The country strategically delivers its power outputs using CSP units when the demand is exceptionally high. Heat transfer fluids have been identified as one of the crucial components used to improve the efficiency of concentrated solar power plants. They play an essential role in the collection of energy from the solar field and transport it to the energy storage systems.
This stored energy is later utilized for generating electricity after sunset or even in cloudy weather conditions. Compared to PV systems, CSP plants possess capabilities to add storage capacity of an extra six hours, which leads to the operational value of USD 35.8/MWh. The increasing scope of CSP and its competitive advantages over other renewable energy sources is responsible for the high growth and significant penetration of heat transfer fluids in the segment.
Heat transfer fluids are used in the oil and gas industry, a key contributor to the U.S. economy. The country is projected to up its liquids and natural gas production over the foreseeable future as a result of shale resource development, thereby boosting product demand.
Major manufacturers are involved in the captive consumption of these thermal oils. Others distribute them to target markets through third-party suppliers. Some significant suppliers of heat transfer fluids in the industry are Paratherm, Hubbard Hall, Thermic Fluids Pvt. Ltd., and Inlet Petroleum Co. (IPC).
Most of these suppliers offer multi-brand fluids and have a separate internet-based portal for selling their products. With heavy investments in research and development activities, major industry participants are shifting toward bio-based thermic oils to comply with government regulations. The shift from synthetic to bio-based thermic oils is anticipated to be a disrupting trend fueled by stringent regulations and strict scrutiny of available products in the marketplace.
The heat transfer fluids market is moderately consolidated in nature with the presence of large players like Dow Inc, Exxon Mobil Corporation, British Petroleum, Eastman Chemical Company and Royal Dutch Shell operating in the market. Market players are adopting the product differentiation strategy that insulated them from price wars.
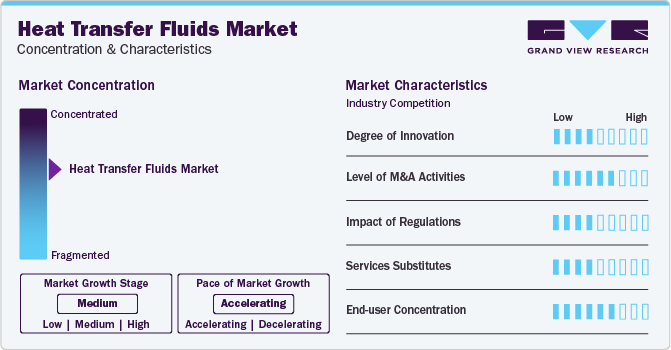
The merger and acquisition activity in the market has been high for the past few years. For instance, Indian oil and gas producer Oil & Natural Gas Corp (ONGC) completed the acquisition of Hindustan Petroleum Co. Ltd. (HPCL) by purchasing 51.11% shares to become the country’s first vertically integrated oil manufacturer. These varied strategic implementations worldwide by key companies reflect their operational strategies to remain sustainable key players in the global heat transfer fluids ecosystem. Some prominent players in the global heat transfer fluids market include:
Companies operating in the heat transfer fluids market sphere are highly competitive and integrated along the value chain. Based on a comprehensive analysis of 24 leading producers across the globe, it has been identified that nearly 55% of the producers of heat transfer fluids are also involved in captive manufacturing of basic raw materials and allied feedstock.
A notable aspect of the industry competition is product offerings. It has been identified that on average company offer seven different variants of heat transfer fluids with Dynalene, Dow, Radco Industries, BASF and Eastman bringing the highest number of products to the market space. Though companies operating on a smaller-scale have specialized offerings with their HTF products catering to larger range of temperature performance and broader customer-base at national levels.
Glycol-based heat transfer fluids form the fastest-growing product category as they exhibit excellent antifreeze properties; the segment is anticipated to exhibit a revenue CAGR of 4.1% over the forecast period. Bio-based glycols are increasingly gaining significance as one of the critical ingredients in heat transfer fluid formulations, as they are compatible with high and low-temperature applications.
Mineral oils are generally utilized in diverse convenient radiator heaters, which are used broadly for commercial and residential applications. These oils have a high level of resistance toward chemical oxidation and thermal cracking and are simultaneously non-toxic and non-corrosive. They provide high thermal conductivity and specific heat, which helps them efficiently transfer heat. Mineral oils are also used in multiple heat transfer mediums but have a high degradation rate when exposed to higher temperatures.
Alkylated aromatic compounds are typically formulated for closed-loop heating systems based on the Rankine cycle. Major operational areas include asphalt plants, gas processing, tank cleaning, and plastic production. These aromatic HTFs are utilized in both the vapor phase and liquid phase and possess excellent fluid properties and heat transfer properties for applications involving low temperatures.
The oil and gas segment dominated the market with a revenue share of 22.2% in 2023. The oil & gas processing dynamics require very specific heat transfer fluids that are formulated to suit desired temperatures and compatibility. These products find application in processes such as recycling, production, refining, and transportation. Offshore platforms utilize heat transfer liquid in the aqueous phase for regenerating glycols and facility heating, which eventually removes water from the produced natural gas.
In the chemical industry, reboilers are heat exchangers to provide heat to distillation column bottoms. Reboilers boil the liquids from the bottom of the distillation column to form vapors that drive the distillation column separation. Heat transfer fluids or steam are used to heat the vaporization process. The products also find application in components such as tubes, pipes, bushes, and gaskets that carry chemicals, fluids, and acids owing to their properties, such as inertness to chemicals and high thermal stability.
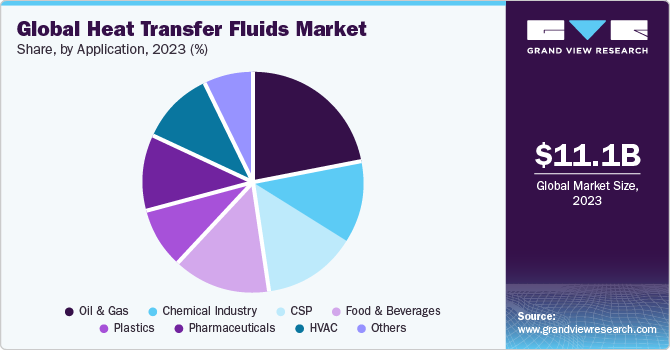
Heat transfer fluids are extensively used to manufacture PET, polyester, nylon, and other synthetic fibers. The products are formulated to provide optimum efficiency across a diverse range of temperatures. Refined heat transfer fluids provide optimum stability at high temperatures, which eventually helps avoid premature degradation of fluids when exposed to high temperatures. Owing to stagnating plastic production in developed countries, the application segment accounted for a meager share of around 9.26% of the market in 2023.
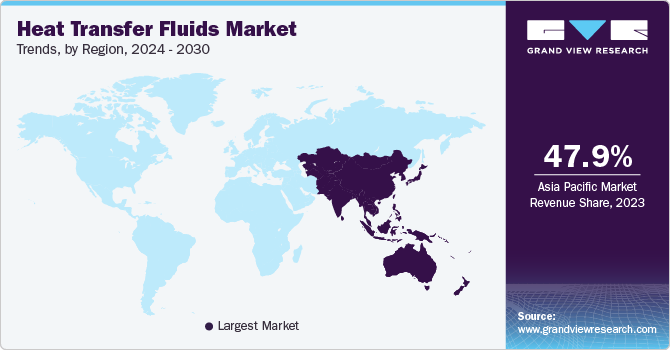
Asia Pacific heat transfer fluid market is the dominant market with key macroeconomic indicators, such as high per capita income and manufacturing output, supporting market growth. The region accounted for a market share of 47.9% in 2023. The use of heating, ventilation, and air conditioning (HVAC) systems is growing tremendously in the Asia Pacific region because of the increasing population, changing climatic conditions, increasing urbanization, and demographic changes in the two economic giants, India and China. These two factors are likely to drive the growth of the Asia Pacific heat transfer fluid market.
The chemical industry in Mexico has observed multiple high-level investments as well as constant sourcing of diverse raw materials to strengthen its core. Rapid industrialization, coupled with the growing export of chemicals to NAFTA countries, is expected to drive demand for heat transfer fluids. The country also has a strong presence in the plastic manufacturing industry.
Key companies are adopting several organic and inorganic growth strategies, such as capacity expansion, mergers & acquisitions, and joint ventures, to maintain and expand their market share.
In September 2023, Valvoline invested in a European manufacturer of heat transfer fluids in order to broaden its product portfolio and cater to the consumers globally.
In May 2023, ORLEN Południe announced the completion of the first operational year of its BioPG plant, involving the conversion of glycerol into renewable propylene glycol. BASF provided its BioPG technology for the purpose, while Air Liquide Engineering & Construction contributed with the licensing, proprietary equipment, and basic engineering services
In February 2022, Chevron announced the agreement to acquire Renewable Energy Group which further helped the company in delivering lower carbon energy.
Report Attribute |
Details |
Market size value in 2024 |
USD 11.46 billion |
Revenue forecast in 2030 |
USD 14.22 billion |
Growth rate |
CAGR of 3.7% from 2024 to 2030 |
Historical data |
2018 - 2023 |
Forecast period |
2024 - 2030 |
Quantitative Units |
Volume in kilotons, revenue in USD million, and CAGR from 2024 to 2030 |
Report coverage |
Volume forecast, revenue forecast, competitive landscape, growth factors, and trends |
Segments covered |
Product, application, region |
Regional scope |
North America; Europe; Asia Pacific; Central & South America; Middle East & Africa |
Country scope |
U.S.; Canada; Mexico; Germany; U.K.; France; Italy; Spain; Russia; China; India; Japan; South Korea; Malaysia; Thailand; Australia; Brazil, Argentina; South Africa; Saudi Arabia |
Key companies profiled |
Dynalene, Inc., Indian Oil Corporation Ltd. (IOCL) , KOST USA, Inc.,Hindustan Petroleum Corporation Ltd. (HPCL), Delta Western, Inc. (DWI) , British Petroleum (BP), Huntsman Corporation, Royal Dutch Shell Plc, Eastman Chemical Company Phillips 66, Chevron Co., BASF SE, Exxon Mobil, DowDuPont Chemicals, Dalian Richfortune Chemicals Ltd., GJ Chemical, Radco Industries Inc. LANXESS AG, Schultz Chemicals, Sasol Limited, Tashkent Industrial Oil Corporation, Shaeffer Manufacturing Co., Paras Lubricants Limited |
Customization scope |
Free report customization (equivalent up to 8 analysts working days) with purchase. Addition or alteration to country, regional & segment scope. |
Pricing and purchase options |
Avail customized purchase options to meet your exact research needs. Explore purchase options |
This report forecasts revenue and volume growth at the global, regional, and country levels and provides a heat transfer fluid market analysis of the latest industry trends and opportunities in each of the sub-segments from 2018 to 2030. For this study, Grand View Research has segmented the global heat transfer fluid market report based on product, application, and region:
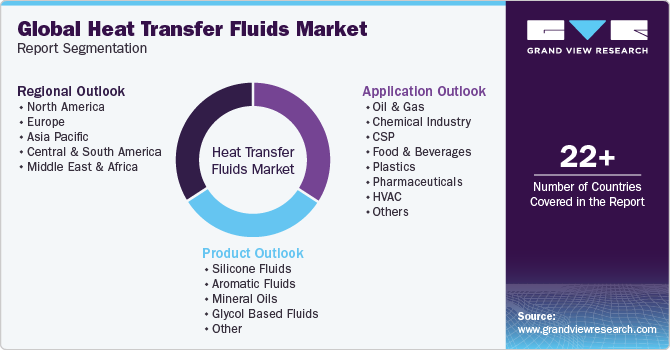
Product Outlook (Volume, Kilotons; Revenue, USD Million, 2018 - 2030)
Silicone Fluids
Oil & Gas
Chemical Industry
CSP
Food & Beverages
Plastics
Pharmaceuticals
HVAC
Others
Aromatic Fluids
Oil & Gas
Chemical Industry
CSP
Food & Beverages
Plastics
Pharmaceuticals
HVAC
Others
Mineral Oils
Glycol based Fluids
Other (including molten salts & HFPE)
Application Outlook (Volume, Kilotons; Revenue, USD Million, 2018 - 2030)
Oil & Gas
Chemical Industry
CSP
Food & Beverages
Plastics
Pharmaceuticals
HVAC
Others
Regional Outlook (Volume, Kilotons; Revenue, USD Billion, 2018 - 2030)
North America
U.S.
Canada
Mexico
Europe
Germany
U.K.
France
Italy
Spain
Russia
Asia Pacific
China
Japan
India
South Korea
Malaysia
Thailand
Australia
Central & South America
Brazil
Argentina
Middle East & Africa
Saudi Arabia
South Africa
b. The global heat transfer fluids market size was estimated at USD 10.7 billion in 2022 and is expected to reach USD 11.1 billion in 2023.
b. The global heat transfer fluids market is expected to grow at a compound annual growth rate of 3.2% from 2023 to 2030 to reach USD 14.2 billion by 2030.
b. The Asia Pacific dominated the heat transfer fluids market with a share of 47.7% in 2022. This is attributable to the rising focus on the development of the manufacturing sector in the region.
b. Some key players operating in the heat transfer fluids market include Dow Chemicals, Eastman Company, Exxon Mobil, Shell, and BP.
b. Key factors that are driving the heat transfer fluids market growth include the growing concentrated solar power industry globally, FDA Approval of food-grade heat transfer fluids, and growing natural gas production in GCC countries.
Table of Contents
Chapter 1. Heat Transfer Fluids Market: Methodology and Scope
1.1. Market Segmentation & Scope
1.2. Market Definition
1.3. Information Procurement
1.3.1. Purchased Database
1.3.2. GVR’s Internal Database
1.3.3. Secondary Sources & Third-Party Perspectives
1.3.4. Primary Research
1.4. Information Analysis
1.4.1. Data Analysis Models
1.5. Market Formulation & Data Visualization
1.6. Data Validation & Publishing
Chapter 2. Heat Transfer Fluids Market: Executive Summary
2.1. Market Summary
2.2. Segmental Outlook
2.3. Competitive Outlook
Chapter 3. Heat Transfer Fluids Market: Variables, Trends & Scope
3.1. Global Synthetic Lubricants Market Outlook
3.2. Industry Value Chain Analysis
3.2.1. Raw Material Trends
3.2.1.1. Crude Oil
3.2.1.2. Mineral Oil
3.2.1.3. Benzene, Toluene, Xylene
3.2.1.4. Diphenyl Oxide, Biphenyl, Terephenyl
3.2.2. Manufacturing/Technology Trends
3.2.3. Sales Channel Analysis
3.3. Profit Margin Analysis
3.4. Regulatory Framework
3.5. Market Dynamics
3.5.1. Market Driver Analysis
3.5.2. Market Restraint Analysis
3.5.3. Industry Challenges
3.5.4. Industry Opportunity
3.6. Porter’s Five Forces Analysis
3.6.1. Supplier Power
3.6.2. Buyer Power
3.6.3. Substitution Threat
3.6.4. Threat from New Entrant
3.6.5. Competitive Rivalry
3.7. PESTEL Analysis
3.7.1. Political Landscape
3.7.2. Economic Landscape
3.7.3. Social Landscape
3.7.4. Technological Landscape
3.7.5. Environmental Landscape
3.7.6. Legal Landscape
Chapter 4. Heat Transfer Fluids Market: Product Outlook Estimates & Forecasts
4.1. Heat Transfer Fluids Market: Product Movement Analysis, 2023 & 2030
4.2. Silicones
4.2.1. Silicones Market estimates and forecast, 2018 - 2030 (USD Million) (Kilotons)
4.3. Aromatics
4.3.1. Aromatics Market estimates and forecast, 2018 - 2030 (USD Million) (Kilotons)
4.4. Mineral Oils
4.4.1. Mineral Oils Market estimates and forecast, 2018 - 2030 (USD Million) (Kilotons)
4.5. Glycol-Based Fluids
4.5.1. Glycol-Based Fluids Market estimates and forecast, 2018 - 2030 (USD Million) (Kilotons)
4.6. Other Products
4.6.1. Other Products Market estimates and forecast, 2018 - 2030 (USD Million) (Kilotons)
Chapter 5. Heat Transfer Fluids Market: Application Outlook Estimates & Forecasts
5.1. Heat Transfer Fluids Market: Application Movement Analysis, 2023 & 2030
5.2. Oil & Gas
5.2.1. Heat Transfer Fluids Market estimates and forecast, in Oil &Gas, 2018 - 2030 (USD Million) (Kilotons)
5.3. Concentrated Solar Power Generation
5.3.1. Heat Transfer Fluids Market estimates and forecast, in Concentrated Solar Power Generation, 2018 - 2030 (USD Million) (Kilotons)
5.4. Chemical
5.4.1. Heat Transfer Fluids Market estimates and forecast, in Chemical, 2018 - 2030 (USD Million) (Kilotons)
5.5. Food & Beverages
5.5.1. Heat Transfer Fluids Market estimates and forecast, in Food & Beverages, 2018 - 2030 (USD Million) (Kilotons)
5.6. Plastics
5.6.1. Heat Transfer Fluids Market estimates and forecast, in Plastics, 2018 - 2030 (USD Million) (Kilotons)
5.7. Pharmaceuticals
5.7.1. Heat Transfer Fluids Market estimates and forecast, in Pharmaceuticals, 2018 - 2030 (USD Million) (Kilotons)
5.8. HVAC
5.8.1. Heat Transfer Fluids Market estimates and forecast, in HVAC, 2018 - 2030 (USD Million) (Kilotons)
5.9. Other Applications
5.9.1. Heat Transfer Fluids Market estimates and forecast, in Other Applications, 2018 - 2030 (USD Million) (Kilotons)
Chapter 6. Heat Transfer Fluids Market Regional Outlook Estimates & Forecasts
6.1. Regional Snapshot
6.2. Heat Transfer Fluids Market: Regional Movement Analysis, 2023 & 2030
6.3. North America
6.3.1. Market estimates and forecast, 2018 - 2030 (USD Million) (Kilotons)
6.3.2. Market estimates and forecast, by product, 2018 - 2030 (USD Million) (Kilotons)
6.3.3. Market estimates and forecast, by application, 2018 - 2030 (USD Million) (Kilotons)
6.3.4. U.S.
6.3.4.1. Market estimates and forecast, 2018 - 2030 (USD Million) (Kilotons)
6.3.4.2. Market estimates and forecast, by product, 2018 - 2030 (USD Million) (Kilotons)
6.3.4.3. Market estimates and forecast, by application, 2018 - 2030 (USD Million) (Kilotons)
6.3.5. Canada
6.3.5.1. Market estimates and forecast, 2018 - 2030 (USD Million) (Kilotons)
6.3.5.2. Market estimates and forecast, by product, 2018 - 2030 (USD Million) (Kilotons)
6.3.5.3. Market estimates and forecast, by application, 2018 - 2030 (USD Million) (Kilotons)
6.3.6. Mexico
6.3.6.1. Market estimates and forecast, 2018 - 2030 (USD Million) (Kilotons)
6.3.6.2. Market estimates and forecast, by product, 2018 - 2030 (USD Million) (Kilotons)
6.3.6.3. Market estimates and forecast, by application, 2018 - 2030 (USD Million) (Kilotons)
6.4. Europe
6.4.1. Market estimates and forecast, 2018 - 2030 (USD Million) (Kilotons)
6.4.2. Market estimates and forecast, by product, 2018 - 2030 (USD Million) (Kilotons)
6.4.3. Market estimates and forecast, by application, 2018 - 2030 (USD Million) (Kilotons)
6.4.4. Market estimates and forecast, by grade, 2018 - 2030 (USD Million) (Kilotons)
6.4.5. Germany
6.4.5.1. Market estimates and forecast, 2018 - 2030 (USD Million) (Kilotons)
6.4.5.2. Market estimates and forecast, by product, 2018 - 2030 (USD Million) (Kilotons)
6.4.5.3. Market estimates and forecast, by application, 2018 - 2030 (USD Million) (Kilotons)
6.4.6. France
6.4.6.1. Market estimates and forecast, 2018 - 2030 (USD Million) (Kilotons)
6.4.6.2. Market estimates and forecast, by product, 2018 - 2030 (USD Million) (Kilotons)
6.4.6.3. Market estimates and forecast, by application, 2018 - 2030 (USD Million) (Kilotons)
6.4.7. UK
6.4.7.1. Market estimates and forecast, 2018 - 2030 (USD Million) (Kilotons)
6.4.7.2. Market estimates and forecast, by product, 2018 - 2030 (USD Million) (Kilotons)
6.4.7.3. Market estimates and forecast, by application, 2018 - 2030 (USD Million) (Kilotons)
6.4.8. Russia
6.4.8.1. Market estimates and forecast, 2018 - 2030 (USD Million) (Kilotons)
6.4.8.2. Market estimates and forecast, by product, 2018 - 2030 (USD Million) (Kilotons)
6.4.8.3. Market estimates and forecast, by application, 2018 - 2030 (USD Million) (Kilotons)
6.4.9. Italy
6.4.9.1. Market estimates and forecast, 2018 - 2030 (USD Million) (Kilotons)
6.4.9.2. Market estimates and forecast, by product, 2018 - 2030 (USD Million) (Kilotons)
6.4.9.3. Market estimates and forecast, by application, 2018 - 2030 (USD Million) (Kilotons)
6.4.10. Spain
6.4.10.1. Market estimates and forecast, 2018 - 2030 (USD Million) (Kilotons)
6.4.10.2. Market estimates and forecast, by product, 2018 - 2030 (USD Million) (Kilotons)
6.4.10.3. Market estimates and forecast, by application, 2018 - 2030 (USD Million) (Kilotons)
6.5. Asia Pacific
6.5.1. Market estimates and forecast, 2018 - 2030 (USD Million) (Kilotons)
6.5.2. Market estimates and forecast, by product, 2018 - 2030 (USD Million) (Kilotons)
6.5.3. Market estimates and forecast, by application, 2018 - 2030 (USD Million) (Kilotons)
6.5.4. China
6.5.4.1. Market estimates and forecast, 2018 - 2030 (USD Million) (Kilotons)
6.5.4.2. Market estimates and forecast, by product, 2018 - 2030 (USD Million) (Kilotons)
6.5.4.3. Market estimates and forecast, by application, 2018 - 2030 (USD Million) (Kilotons)
6.5.5. India
6.5.5.1. Market estimates and forecast, 2018 - 2030 (USD Million) (Kilotons)
6.5.5.2. Market estimates and forecast, by product, 2018 - 2030 (USD Million) (Kilotons)
6.5.5.3. Market estimates and forecast, by application, 2018 - 2030 (USD Million) (Kilotons)
6.5.6. Japan
6.5.6.1. Market estimates and forecast, 2018 - 2030 (USD Million) (Kilotons)
6.5.6.2. Market estimates and forecast, by product, 2018 - 2030 (USD Million) (Kilotons)
6.5.6.3. Market estimates and forecast, by application, 2018 - 2030 (USD Million) (Kilotons)
6.5.7. South Korea
6.5.7.1. Market estimates and forecast, 2018 - 2030 (USD Million) (Kilotons)
6.5.7.2. Market estimates and forecast, by product, 2018 - 2030 (USD Million) (Kilotons)
6.5.7.3. Market estimates and forecast, by application, 2018 - 2030 (USD Million) (Kilotons)
6.5.8. Malaysia
6.5.8.1. Market estimates and forecast, 2018 - 2030 (USD Million) (Kilotons)
6.5.8.2. Market estimates and forecast, by product, 2018 - 2030 (USD Million) (Kilotons)
6.5.8.3. Market estimates and forecast, by application, 2018 - 2030 (USD Million) (Kilotons)
6.5.9. Thailand
6.5.9.1. Market estimates and forecast, 2018 - 2030 (USD Million) (Kilotons)
6.5.9.2. Market estimates and forecast, by product, 2018 - 2030 (USD Million) (Kilotons)
6.5.9.3. Market estimates and forecast, by application, 2018 - 2030 (USD Million) (Kilotons)
6.5.10. Australia
6.5.10.1. Market estimates and forecast, 2018 - 2030 (USD Million) (Kilotons)
6.5.10.2. Market estimates and forecast, by product, 2018 - 2030 (USD Million) (Kilotons)
6.5.10.3. Market estimates and forecast, by application, 2018 - 2030 (USD Million) (Kilotons)
6.6. Central & South America
6.6.1. Market estimates and forecast, 2018 - 2030 (USD Million) (Kilotons)
6.6.2. Market estimates and forecast, by product, 2018 - 2030 (USD Million) (Kilotons)
6.6.3. Market estimates and forecast, by application, 2018 - 2030 (USD Million) (Kilotons)
6.6.4. Brazil
6.6.4.1. Market estimates and forecast, 2018 - 2030 (USD Million) (Kilotons)
6.6.4.2. Market estimates and forecast, by product, 2018 - 2030 (USD Million) (Kilotons)
6.6.4.3. Market estimates and forecast, by application, 2018 - 2030 (USD Million) (Kilotons)
6.6.5. Argentina
6.6.5.1. Market estimates and forecast, 2018 - 2030 (USD Million) (Kilotons)
6.6.5.2. Market estimates and forecast, by product, 2018 - 2030 (USD Million) (Kilotons)
6.6.5.3. Market estimates and forecast, by application, 2018 - 2030 (USD Million) (Kilotons)
6.7. Middle East & Africa
6.7.1. Market estimates and forecast, 2018 - 2030 (USD Million) (Kilotons)
6.7.2. Market estimates and forecast, by product, 2018 - 2030 (USD Million) (Kilotons)
6.7.3. Market estimates and forecast, by application, 2018 - 2030 (USD Million) (Kilotons)
6.7.4. South Africa
6.7.4.1. Market estimates and forecast, 2018 - 2030 (USD Million) (Kilotons)
6.7.4.2. Market estimates and forecast, by product, 2018 - 2030 (USD Million) (Kilotons)
6.7.4.3. Market estimates and forecast, by application, 2018 - 2030 (USD Million) (Kilotons)
6.7.5. Saudi Arabia
6.7.5.1. Market estimates and forecast, 2018 - 2030 (USD Million) (Kilotons)
6.7.5.2. Market estimates and forecast, by product, 2018 - 2030 (USD Million) (Kilotons)
6.7.5.3. Market estimates and forecast, by application, 2018 - 2030 (USD Million) (Kilotons)
Chapter 7. Competitive Landscape
7.1. Recent Developments & Impact Analysis, By Key Market Participants
7.2. Company Categorization
7.3. Company Market Share Analysis, 2023
7.4. Company Heat Map Analysis
7.5. Vendor Landscape
7.5.1. List of channel partners and distributors
7.5.2. List of potential end-users
7.6. Strategy Mapping
7.7. Company Profiles/Listing
7.7.1. Dynalene, Inc.
7.7.1.1. Company Overview
7.7.1.2. Financial Performance
7.7.1.3. Product Benchmarking
7.7.2. Indian Oil Corporation Ltd. (IOCL)
7.7.2.1. Company Overview
7.7.2.2. Financial Performance
7.7.2.3. Product Benchmarking
7.7.3. KOST USA, Inc.
7.7.3.1. Company Overview
7.7.3.2. Financial Performance
7.7.3.3. Product Benchmarking
7.7.4. Hindustan Petroleum Corporation Ltd. (HPCL)Delta Western, Inc. (DWI)
7.7.4.1. Company Overview
7.7.4.2. Financial Performance
7.7.4.3. Product Benchmarking
7.7.5. British Petroleum (BP)
7.7.5.1. Company Overview
7.7.5.2. Financial Performance
7.7.5.3. Product Benchmarking
7.7.6. Huntsman Corporation
7.7.6.1. Company Overview
7.7.6.2. Financial Performance
7.7.6.3. Product Benchmarking
7.7.7. Royal Dutch Shell Plc
7.7.7.1. Company Overview
7.7.7.2. Financial Performance
7.7.7.3. Product Benchmarking
7.7.8. Eastman Chemical Company
7.7.8.1. Company Overview
7.7.8.2. Financial Performance
7.7.8.3. Product Benchmarking
7.7.9. Phillips 66
7.7.9.1. Company Overview
7.7.9.2. Financial Performance
7.7.9.3. Product Benchmarking
7.7.10. Chevron Co.
7.7.10.1. Company Overview
7.7.10.2. Financial Performance
7.7.10.3. Product Benchmarking
7.7.11. BASF SE
7.7.11.1. Company Overview
7.7.11.2. Financial Performance
7.7.11.3. Product Benchmarking
7.7.12. Exxon Mobil
7.7.12.1. Company Overview
7.7.12.2. Financial Performance
7.7.12.3. Product Benchmarking
7.7.13. DowDuPont Chemicals
7.7.13.1. Company Overview
7.7.13.2. Financial Performance
7.7.13.3. Product Benchmarking
7.7.14. Dalian Richfortune Chemicals Ltd.
7.7.14.1. Company Overview
7.7.14.2. Financial Performance
7.7.14.3. Product Benchmarking
7.7.15. GJ Chemical
7.7.15.1. Company Overview
7.7.15.2. Financial Performance
7.7.15.3. Product Benchmarking
7.7.16. Radco Industries Inc.
7.7.16.1. Company Overview
7.7.16.2. Financial Performance
7.7.16.3. Product Benchmarking
7.7.17. LANXESS AG
7.7.17.1. Company Overview
7.7.17.2. Financial Performance
7.7.17.3. Product Benchmarking
7.7.18. Schultz Chemicals
7.7.18.1. Company Overview
7.7.18.2. Financial Performance
7.7.18.3. Product Benchmarking
7.7.19. Sasol Limited
7.7.19.1. Company Overview
7.7.19.2. Financial Performance
7.7.19.3. Product Benchmarking
7.7.20. Tashkent Industrial Oil Corporation
7.7.20.1. Company Overview
7.7.20.2. Financial Performance
7.7.20.3. Product Benchmarking
7.7.21. Shaeffer Manufacturing Co.
7.7.21.1. Company Overview
7.7.21.2. Financial Performance
7.7.21.3. Product Benchmarking
7.7.22. Paras Lubricants Limited
7.7.22.1. Company Overview
7.7.22.2. Financial Performance
7.7.22.3. Product Benchmarking
List of Tables
Table 1. Heat Transfer Fluids Market Estimates And Forecasts, 2018 - 2030 (USD Million) (Kilotons)
Table 2. Heat Transfer Fluids Market Estimates And Forecasts, By Silicone Fluids, 2018 - 2030 (USD Million) (Kilotons)
Table 3. Heat Transfer Fluids Market Estimates And Forecasts, By Aromatic Fluids, 2018 - 2030 (USD Million) (Kilotons)
Table 4. Heat Transfer Fluids Market Estimates And Forecasts, By Mineral Oils, 2018 - 2030 (USD Million) (Kilotons)
Table 5. Heat Transfer Fluids Market Estimates And Forecasts, By Glycol Based Fluids, 2018 - 2030 (USD Million) (Kilotons)
Table 6. Heat Transfer Fluids Market Estimates And Forecasts, By Others, 2018 - 2030 (USD Million) (Kilotons)
Table 7. Heat Transfer Fluids Market Estimates And Forecasts, In Oil & Gas, 2018 - 2030 (USD Million) (Kilotons)
Table 8. Heat Transfer Fluids Market Estimates And Forecasts, In Chemical Industry, 2018 - 2030 (USD Million) (Kilotons)
Table 9. Heat Transfer Fluids Market Estimates And Forecasts, In CSP, 2018 - 2030 (USD Million) (Kilotons)
Table 10. Heat Transfer Fluids Market Estimates And Forecasts, In Food & Beverages, 2018 - 2030 (USD Million) (Kilotons)
Table 11. Heat Transfer Fluids Market Estimates And Forecasts, In Plastics, 2018 - 2030 (USD Million) (Kilotons)
Table 12. Heat Transfer Fluids Market Estimates And Forecasts, In Pharmaceuticals, 2018 - 2030 (USD Million) (Kilotons)
Table 13. Heat Transfer Fluids Market Estimates And Forecasts, In HVAC, 2018 - 2030 (USD Million) (Kilotons)
Table 14. Heat Transfer Fluids Market Estimates And Forecasts, In Other Applications, 2018 - 2030 (USD Million) (Kilotons)
Table 15. North America Heat Transfer Fluids Market Estimates And Forecasts, 2018 - 2030 (USD Million) (Kilotons)
Table 16. North America Heat Transfer Fluids Market Estimates And Forecasts, By Product, 2018 - 2030 (USD Million)
Table 17. North America Heat Transfer Fluids Market Estimates And Forecasts, By Product, 2018 - 2030 (Kilotons)
Table 18. North America Heat Transfer Fluids Market Estimates And Forecasts, By Application, 2018 - 2030 (USD Million)
Table 19. North America Heat Transfer Fluids Market Estimates And Forecasts, By Application, 2018 - 2030 (Kilotons)
Table 20. U.S. Heat Transfer Fluids Market Estimates And Forecasts, 2018 - 2030 (USD Million) (Kilotons)
Table 21. U.S. Heat Transfer Fluids Market Estimates And Forecasts, By Product, 2018 - 2030 (USD Million)
Table 22. U.S. Heat Transfer Fluids Market Estimates And Forecasts, By Product, 2018 - 2030 (Kilotons)
Table 23. U.S. Heat Transfer Fluids Market Estimates And Forecasts, By Application, 2018 - 2030 (USD Million)
Table 24. U.S. Heat Transfer Fluids Market Estimates And Forecasts, By Application, 2018 - 2030 (Kilotons)
Table 25. Canada Heat Transfer Fluids Market Estimates And Forecasts, 2018 - 2030 (USD Million) (Kilotons)
Table 26. Canada Heat Transfer Fluids Market Estimates And Forecasts, By Product, 2018 - 2030 (USD Million)
Table 27. Canada Heat Transfer Fluids Market Estimates And Forecasts, By Product, 2018 - 2030 (Kilotons)
Table 28. Canada Heat Transfer Fluids Market Estimates And Forecasts, By Application, 2018 - 2030 (USD Million)
Table 29. Canada Heat Transfer Fluids Market Estimates And Forecasts, By Application, 2018 - 2030 (Kilotons)
Table 30. Mexico Heat Transfer Fluids Market Estimates And Forecasts, 2018 - 2030 (USD Million) (Kilotons)
Table 31. Mexico Heat Transfer Fluids Market Estimates And Forecasts, By Product, 2018 - 2030 (USD Million)
Table 32. Mexico Heat Transfer Fluids Market Estimates And Forecasts, By Product, 2018 - 2030 (Kilotons)
Table 33. Mexico Heat Transfer Fluids Market Estimates And Forecasts, By Application, 2018 - 2030 (USD Million)
Table 34. Mexico Heat Transfer Fluids Market Estimates And Forecasts, By Application, 2018 - 2030 (Kilotons)
Table 35. Europe Heat Transfer Fluids Market Estimates And Forecasts, 2018 - 2030 (USD Million) (Kilotons)
Table 36. Europe Heat Transfer Fluids Market Estimates And Forecasts, By Product, 2018 - 2030 (USD Million)
Table 37. Europe Heat Transfer Fluids Market Estimates And Forecasts, By Product, 2018 - 2030 (Kilotons)
Table 38. Europe Heat Transfer Fluids Market Estimates And Forecasts, By Application, 2018 - 2030 (USD Million)
Table 39. Europe Heat Transfer Fluids Market Estimates And Forecasts, By Application, 2018 - 2030 (Kilotons)
Table 40. Germany Heat Transfer Fluids Market Estimates And Forecasts, 2018 - 2030 (USD Million) (Kilotons)
Table 41. Germany Heat Transfer Fluids Market Estimates And Forecasts, By Product, 2018 - 2030 (USD Million)
Table 42. Germany Heat Transfer Fluids Market Estimates And Forecasts, By Product, 2018 - 2030 (Kilotons)
Table 43. Germany Heat Transfer Fluids Market Estimates And Forecasts, By Application, 2018 - 2030 (USD Million)
Table 44. Germany Heat Transfer Fluids Market Estimates And Forecasts, By Application, 2018 - 2030 (Kilotons)
Table 45. France Heat Transfer Fluids Market Estimates And Forecasts, 2018 - 2030 (USD Million) (Kilotons)
Table 46. France Heat Transfer Fluids Market Estimates And Forecasts, By Product, 2018 - 2030 (USD Million)
Table 47. France Heat Transfer Fluids Market Estimates And Forecasts, By Product, 2018 - 2030 (Kilotons)
Table 48. France Heat Transfer Fluids Market Estimates And Forecasts, By Application, 2018 - 2030 (USD Million)
Table 49. France Heat Transfer Fluids Market Estimates And Forecasts, By Application, 2018 - 2030 (Kilotons)
Table 50. U.K. Heat Transfer Fluids Market Estimates And Forecasts, 2018 - 2030 (USD Million) (Kilotons)
Table 51. U.K. Heat Transfer Fluids Market Estimates And Forecasts, By Product, 2018 - 2030 (USD Million)
Table 52. U.K. Heat Transfer Fluids Market Estimates And Forecasts, By Product, 2018 - 2030 (Kilotons)
Table 53. U.K. Heat Transfer Fluids Market Estimates And Forecasts, By Application, 2018 - 2030 (USD Million)
Table 54. U.K. Heat Transfer Fluids Market Estimates And Forecasts, By Application, 2018 - 2030 (Kilotons)
Table 55. Russia Heat Transfer Fluids Market Estimates And Forecasts, 2018 - 2030 (USD Million) (Kilotons)
Table 56. Russia Heat Transfer Fluids Market Estimates And Forecasts, By Product, 2018 - 2030 (USD Million)
Table 57. Russia Heat Transfer Fluids Market Estimates And Forecasts, By Product, 2018 - 2030 (Kilotons)
Table 58. Russia Heat Transfer Fluids Market Estimates And Forecasts, By Application, 2018 - 2030 (USD Million)
Table 59. Russia Heat Transfer Fluids Market Estimates And Forecasts, By Application, 2018 - 2030 (Kilotons)
Table 60. Italy Heat Transfer Fluids Market Estimates And Forecasts, 2018 - 2030 (USD Million) (Kilotons)
Table 61. Italy Heat Transfer Fluids Market Estimates And Forecasts, By Product, 2018 - 2030 (USD Million)
Table 62. Italy Heat Transfer Fluids Market Estimates And Forecasts, By Product, 2018 - 2030 (Kilotons)
Table 63. Italy Heat Transfer Fluids Market Estimates And Forecasts, By Application, 2018 - 2030 (USD Million)
Table 64. Italy Heat Transfer Fluids Market Estimates And Forecasts, By Application, 2018 - 2030 (Kilotons)
Table 65. Spain Heat Transfer Fluids Market Estimates And Forecasts, 2018 - 2030 (USD Million) (Kilotons)
Table 66. Spain Heat Transfer Fluids Market Estimates And Forecasts, By Product, 2018 - 2030 (USD Million)
Table 67. Spain Heat Transfer Fluids Market Estimates And Forecasts, By Product, 2018 - 2030 (Kilotons)
Table 68. Spain Heat Transfer Fluids Market Estimates And Forecasts, By Application, 2018 - 2030 (USD Million)
Table 69. Spain Heat Transfer Fluids Market Estimates And Forecasts, By Application, 2018 - 2030 (Kilotons)
Table 70. Asia Pacific Heat Transfer Fluids Market Estimates And Forecasts, 2018 - 2030 (USD Million) (Kilotons)
Table 71. Asia Pacific Heat Transfer Fluids Market Estimates And Forecasts, By Product, 2018 - 2030 (USD Million)
Table 72. Asia Pacific Heat Transfer Fluids Market Estimates And Forecasts, By Product, 2018 - 2030 (Kilotons)
Table 73. Asia Pacific Heat Transfer Fluids Market Estimates And Forecasts, By Application, 2018 - 2030 (USD Million)
Table 74. Asia Pacific Heat Transfer Fluids Market Estimates And Forecasts, By Application, 2018 - 2030 (Kilotons)
Table 75. China Heat Transfer Fluids Market Estimates And Forecasts, 2018 - 2030 (USD Million) (Kilotons)
Table 76. China Heat Transfer Fluids Market Estimates And Forecasts, By Product, 2018 - 2030 (USD Million)
Table 77. China Heat Transfer Fluids Market Estimates And Forecasts, By Product, 2018 - 2030 (Kilotons)
Table 78. China Heat Transfer Fluids Market Estimates And Forecasts, By Application, 2018 - 2030 (USD Million)
Table 79. China Heat Transfer Fluids Market Estimates And Forecasts, By Application, 2018 - 2030 (Kilotons)
Table 80. Japan Heat Transfer Fluids Market Estimates And Forecasts, 2018 - 2030 (USD Million) (Kilotons)
Table 81. Japan Heat Transfer Fluids Market Estimates And Forecasts, By Product, 2018 - 2030 (USD Million)
Table 82. Japan Heat Transfer Fluids Market Estimates And Forecasts, By Product, 2018 - 2030 (Kilotons)
Table 83. Japan Heat Transfer Fluids Market Estimates And Forecasts, By Application, 2018 - 2030 (USD Million)
Table 84. Japan Heat Transfer Fluids Market Estimates And Forecasts, By Application, 2018 - 2030 (Kilotons)
Table 85. India Heat Transfer Fluids Market Estimates And Forecasts, 2018 - 2030 (USD Million) (Kilotons)
Table 86. India Heat Transfer Fluids Market Estimates And Forecasts, By Product, 2018 - 2030 (USD Million)
Table 87. India Heat Transfer Fluids Market Estimates And Forecasts, By Product, 2018 - 2030 (Kilotons)
Table 88. India Heat Transfer Fluids Market Estimates And Forecasts, By Application, 2018 - 2030 (USD Million)
Table 89. India Heat Transfer Fluids Market Estimates And Forecasts, By Application, 2018 - 2030 (Kilotons)
Table 90. Malaysia Heat Transfer Fluids Market Estimates And Forecasts, 2018 - 2030 (USD Million) (Kilotons)
Table 91. Malaysia Heat Transfer Fluids Market Estimates And Forecasts, By Product, 2018 - 2030 (USD Million)
Table 92. Malaysia Heat Transfer Fluids Market Estimates And Forecasts, By Product, 2018 - 2030 (Kilotons)
Table 93. Malaysia Heat Transfer Fluids Market Estimates And Forecasts, By Application, 2018 - 2030 (USD Million)
Table 94. Malaysia Heat Transfer Fluids Market Estimates And Forecasts, By Application, 2018 - 2030 (Kilotons)
Table 95. Thailand Heat Transfer Fluids Market Estimates And Forecasts, 2018 - 2030 (USD Million) (Kilotons)
Table 96. Thailand Heat Transfer Fluids Market Estimates And Forecasts, By Product, 2018 - 2030 (USD Million)
Table 97. Thailand Heat Transfer Fluids Market Estimates And Forecasts, By Product, 2018 - 2030 (Kilotons)
Table 98. Thailand Heat Transfer Fluids Market Estimates And Forecasts, By Application, 2018 - 2030 (USD Million)
Table 99. Thailand Heat Transfer Fluids Market Estimates And Forecasts, By Applications, 2018 - 2030 (Kilotons)
Table 100. Australia Heat Transfer Fluids Market Estimates And Forecasts, 2018 - 2030 (USD Million) (Kilotons)
Table 101. Australia Heat Transfer Fluids Market Estimates And Forecasts, By Product, 2018 - 2030 (USD Million)
Table 102. Australia Heat Transfer Fluids Market Estimates And Forecasts, By Product, 2018 - 2030 (Kilotons)
Table 103. Australia Heat Transfer Fluids Market Estimates And Forecasts, By Application, 2018 - 2030 (USD Million)
Table 104. Australia Heat Transfer Fluids Market Estimates And Forecasts, By Applications, 2018 - 2030 (Kilotons)
Table 105. Central & South America Heat Transfer Fluids Market Estimates And Forecasts, 2018 - 2030 (USD Million) (Kilotons)
Table 106. Central & South America Heat Transfer Fluids Market Estimates And Forecasts, By Product, 2018 - 2030 (USD Million)
Table 107. Central & South America Heat Transfer Fluids Market Estimates And Forecasts, By Product, 2018 - 2030 (Kilotons)
Table 108. Central & South America Heat Transfer Fluids Market Estimates And Forecasts, By Application, 2018 - 2030 (USD Million)
Table 109. Central & South America Heat Transfer Fluids Market Estimates And Forecasts, By Application, 2018 - 2030 (Kilotons)
Table 110. Brazil Heat Transfer Fluids Market Estimates And Forecasts, 2018 - 2030 (USD Million) (Kilotons)
Table 111. Brazil Heat Transfer Fluids Market Estimates And Forecasts, By Product, 2018 - 2030 (USD Million)
Table 112. Brazil Heat Transfer Fluids Market Estimates And Forecasts, By Product, 2018 - 2030 (Kilotons)
Table 113. Brazil Heat Transfer Fluids Market Estimates And Forecasts, By Application, 2018 - 2030 (USD Million)
Table 114. Brazil Heat Transfer Fluids Market Estimates And Forecasts, By Application, 2018 - 2030 (Kilotons)
Table 115. Argentina Heat Transfer Fluids Market Estimates And Forecasts, 2018 - 2030 (USD Million) (Kilotons)
Table 116. Argentina Heat Transfer Fluids Market Estimates And Forecasts, By Product, 2018 - 2030 (USD Million)
Table 117. Argentina Heat Transfer Fluids Market Estimates And Forecasts, By Product, 2018 - 2030 (Kilotons)
Table 118. Argentina Heat Transfer Fluids Market Estimates And Forecasts, By Application, 2018 - 2030 (USD Million)
Table 119. Middle East & Africa Heat Transfer Fluids Market Estimates And Forecasts, 2018 - 2030 (USD Million) (Kilotons)
Table 120. Middle East & Africa Heat Transfer Fluids Market Estimates And Forecasts, By Product, 2018 - 2030 (USD Million)
Table 121. Middle East & Africa Heat Transfer Fluids Market Estimates And Forecasts, By Product, 2018 - 2030 (Kilotons)
Table 122. Middle East & Africa Heat Transfer Fluids Market Estimates And Forecasts, By Application, 2018 - 2030 (USD Million)
Table 123. Middle East & Africa Heat Transfer Fluids Market Estimates And Forecasts, By Application, 2018 - 2030 (Kilotons)
Table 124. Saudi Arabia Heat Transfer Fluids Market Estimates And Forecasts, 2018 - 2030 (USD Million) (Kilotons)
Table 125. Saudi Arabia Heat Transfer Fluids Market Estimates And Forecasts, By Product, 2018 - 2030 (USD Million)
Table 126. Saudi Arabia Heat Transfer Fluids Market Estimates And Forecasts, By Product, 2018 - 2030 (Kilotons)
Table 127. Saudi Arabia Heat Transfer Fluids Market Estimates And Forecasts, By Application, 2018 - 2030 (USD Million)
Table 128. South Africa Heat Transfer Fluids Market Estimates And Forecasts, 2018 - 2030 (USD Million) (Kilotons)
Table 129. South Africa Heat Transfer Fluids Market Estimates And Forecasts, By Product, 2018 - 2030 (USD Million)
Table 130. South Africa Heat Transfer Fluids Market Estimates And Forecasts, By Product, 2018 - 2030 (Kilotons)
Table 131. South Africa Heat Transfer Fluids Market Estimates And Forecasts, By Application, 2018 - 2030 (USD Million)
List of Figures
Fig 1. Market segmentation
Fig 2. Information procurement
Fig 3. Data analysis models
Fig 4. Market formulation and validation
Fig 5. Market snapshot
Fig 6. Segmental outlook- Product, and application
Fig 7. Competitive outlook
Fig 8. Heat transfer fluids market, 2018-2030 (USD Million) (Kilotons)
Fig 9. Value chain analysis
Fig 10. Market dynamics
Fig 11. Porter’s Analysis
Fig 12. PESTEL Analysis
Fig 13. Heat transfer fluids market, by product: Key takeaways
Fig 14. Heat transfer fluids market, by product: Market share, 2023 & 2030
Fig 15. Heat transfer fluids market, by application: Key takeaways
Fig 16. Heat transfer fluids market, by application: Market share, 2023 & 2030
Fig 17. Heat transfer fluids market, by region: Key takeaways
Fig 18. Heat transfer fluids market, by region: Market share, 2023 & 2030
Market Segmentation
CSP systems concentrate the solar rays on a small area by using mirrors or collectors and facilitate electricity generation by converting light into heat energy using steam turbines. The global CSP industry has been witnessing significant growth over the past few years owing to technological advancements in thermal storage system, commercialization of molten salt fluid technologies, and adjustable to moderate weather conditions. It is one of the most cost-efficient sources of power generation, with reduced levels of CO2 emissions as compared to other sources. CSPs are preferred over conventional PV solar panels owing to added advantage of thermal storage with enhanced longevity.
Heat transfer fluids are identified as crucial players in improving the efficiency of concentrated solar power plants as they have a high capacity of heat storage and thereby increase the total plant's power generation capacity. Not only do HTFs have high capacity of thermal storage, but they also have an edge of storing thermal energy. This stored energy is later utilized for generating electricity after sunset or even in cloudy weather conditions. Compared to PV systems, CSP plants can add storage capacity for an extra 6 hours, leading to the operational value of USD 35.8/MWh.
Food and beverage processing is one of the major emerging applications of heat transfer fluids. HTFs find multiple applications in the industry, including dehumidifying, heating, and cooling applications across sectors such as wineries, dairies and breweries. The companies operational in these segments utilize HTFs, where the food articles and water come in contact with the fluids during processing. Hence, there is a high requirement for non-toxic food-grade heat transfer fluids. USDA approves the ingredients that are used in food-grade HTFs through HT1 applications and complies with FDA 178.3570 requirements.
Food-grade thermic fluids are a safe and non-hazardous option for various food and beverage processing companies. These fluids do not produce carbon in their downstream and offer low maintenance. Their wide temperature range makes them a preferred choice among many companies in the industry. Approval of these thermal fluids by FDA and international regulatory agencies is estimated to drive the demand for grade thermic oils which are more efficient than water or steam when used as a heat transfer medium.
The heat transfer fluids industry is subject to multiple government regulations across the globe at both global and regional levels. Thermal oils are typically formulated from petrochemicals and mineral oils, which affect the environment in terms of toxicity, biodegradability, recyclability, and more. One of the major issues faced is the disposal of used heat transfer fluids. Since most of the additives used in thermal fluids are petrochemical derivatives, they seriously threaten water pollution. This has led to stringent regulations being formulated by U.S. EPA. A series of tests conducted by the agency found that mineral oil-based HTOs are highly toxic, exhibit low biodegradability, and have the potential for bioaccumulation. Bioaccumulation is defined as the tendency of chemicals to build-up on organisms' tissues over time. Since most mineral oils are water insoluble, they tend to accumulate on organisms and have adverse biological effects.
This section will provide insights into the contents included in this heat transfer fluids market report and help gain clarity on the structure of the report to assist readers in navigating smoothly.
Industry overview
Industry trends
Market drivers and restraints
Market size
Growth prospects
Porter’s analysis
PESTEL analysis
Key market opportunities prioritized
Competitive landscape
Company overview
Financial performance
Product benchmarking
Latest strategic developments
Market size, estimates, and forecast from 2018 to 2030
Market estimates and forecast for product segments up to 2030
Regional market size and forecast for product segments up to 2030
Market estimates and forecast for application segments up to 2030
Regional market size and forecast for application segments up to 2030
Company financial performance
A three-pronged approach was followed for deducing the heat transfer fluids market estimates and forecasts. The process has three steps: information procurement, analysis, and validation. The whole process is cyclical, and steps repeat until the estimates are validated. The three steps are explained in detail below:
Information procurement: Information procurement is one of the most extensive and important stages in our research process, and quality data is critical for accurate analysis. We followed a multi-channel data collection process for heat transfer fluids market to gather the most reliable and current information possible.
Analysis: We mine the data collected to establish baselines for forecasting, identify trends and opportunities, gain insight into consumer demographics and drivers, and so much more. We utilized different methods of heat transfer fluids market data depending on the type of information we’re trying to uncover in our research.
Market Research Efforts: Bottom-up Approach for estimating and forecasting demand size and opportunity, top-down Approach for new product forecasting and penetration, and combined approach of both Bottom-up and Top-down for full coverage analysis.
Value-Chain-Based Sizing & Forecasting: Supply-side estimates for understanding potential revenue through competitive benchmarking, forecasting, and penetration modeling.
Demand-side estimates for identifying parent and ancillary markets, segment modeling, and heuristic forecasting.
Qualitative Functional Deployment (QFD) Modelling for market share assessment.
Market formulation and validation: We mine the data collected to establish baselines for forecasting, identify trends and opportunities, gain insight into consumer demographics and drivers, and so much more. We utilize different methods of data analysis depending on the type of information we’re trying to uncover in our research.
Market Formulation: This step involves the finalization of market numbers. This step on an internal level is designed to manage outputs from the Data Analysis step.
Data Normalization: The final market estimates and forecasts are then aligned and sent to industry experts, in-panel quality control managers for validation.
This step also entails the finalization of the report scope and data representation pattern.
Validation: The process entails multiple levels of validation. All these steps run in parallel, and the study is forwarded for publishing only if all three levels render validated results.
The heat transfer fluids market was categorized into three segments, namely product (Silicone Fluids, Aromatic Fluids, Mineral Oils, Glycol based Fluids), application (Oil & Gas, Chemical Industry, CSP, Food & Beverages, Plastics, Pharmaceuticals, HVAC), and region (North America, Europe, Asia Pacific, Central & South America, and Middle East & Africa).
The heat transfer fluids market was segmented into product, application, and regions. The demand at a segment level was deduced using a funnel method. Concepts like the TAM, SAM, SOM, etc., were put into practice to understand the demand. We at GVR deploy three methods to deduce market estimates and determine forecasts. These methods are explained below:
Demand estimation of each product across countries/regions summed up to from the total market.
Variable analysis for demand forecast.
Demand estimation via analyzing paid database, and company financials either via annual reports or paid database.
Primary interviews for data revalidation and insight collection.
Used extensively for new product forecasting or analyzing penetration levels.
Tool used invoice product flow and penetration models Use of regression multi-variant analysis for forecasting Involves extensive use of paid and public databases.
Primary interviews and vendor-based primary research for variable impact analysis.
The heat transfer fluids market was analyzed at a regional level. The globe was divided into North America, Europe, Asia Pacific, Central & South America, and Middle East & Africa, keeping in focus variables like consumption patterns, export-import regulations, consumer expectations, etc. These regions were further divided into twenty countries, namely, the U.S.; Canada; Mexico; Germany; the UK; France; Italy; Spain; Russia; China; India; Japan; South Korea; Malaysia; Thailand; Australia; Brazil, Argentina; South Africa; Saudi Arabia.
All three above-mentioned market research methodologies were applied to arrive at regional-level conclusions. The regions were then summed up to form the global market.
The heat transfer fluids market was analyzed via companies operating in the sector. Analyzing these companies and cross-referencing them to the demand equation helped us validate our assumptions and conclusions. Key market players analyzed include:
Dynalene, Inc. - Dynalene, Inc. is a manufacturer of coolants, glycols, and other heat transfer fluids. Headquartered in the U.S., the company has two manufacturing facilities in Illinois and Pennsylvania. The company manufactures and supplies heat transfer fluids, glycols, and coolants to major industry players in chemical industry. Dynalene has regional offices in North America, Europe, and Asia Pacific. The products offered by the company find application in pharmaceutical, chemicals, LPG processing, and food and beverage industries. Significant products offered in heat transfer fluid segment are glycol-based coolants and liquids involving hydrocarbons, silicone, potassium formate, and molten salts. The major end-use segment comprises commercial and industrial complexes servicing HVAC systems. The company also provides testing services for thermo-physical properties and quality control of glycol and heat transfer fluids.
Indian Oil Corporation Ltd. (IOCL) - Indian Oil Corporation Ltd. (IOCL) has a fully integrated oil & gas value chain, providing services in exploration, refining, transportation, and marketing of crude oil & gas in India and overseas. The company is also integrating its refining activities with upstream operations to become a major player in the industry. It has over ten and seven blocks in domestic and overseas locations respectively. It has expanded its Indian business to Sri Lanka, UAE, Netherlands, Sweden, the U.S. and Australia. The company has also entered into the green energy sector through joint ventures with CREDA Biofuels Ltd. and Ruchi Biofuels LLP.
KOST USA, Inc. - The business line of KOST USA, Inc. is concentrated in manufacturing and supplying anti-freeze and industrial fluids in the U.S. It is a major distributor of coolants and heat transfer fluids for Cummins and Gulf Lubricants in North America. Major products offered by KOST include coolants/antifreeze, fire-resistant hydraulic (FRH) fluids, desiccants, diesel treatment, and heat transfer fluids. The company aims to serve major industry players in automotive & heavy duty, and oil & gas sector. It offers cooling products to a range of application segments ranging from LNG vaporizers to HVAC systems. It also provides glycol-based fluid products to upstream, midstream, and downstream segments.
Hindustan Petroleum Corporation Ltd. (HPCL) - Hindustan Petroleum Co. Ltd. (HPCL) operates two of its own refineries spread across Mumbai and Visakhapatnam, with other refineries present across India. It serves the major end-use segments through an extensive network of cross-country pipelines, lube-filling plants, depots, terminals, and aviation fueling facilities. The company's Major products and services include supply of LPG, lubes, fueling facilities and shipping of petroleum products and bulk fuels. Hindustan Petroleum Lubes is one of the integral parts of HPCL, which provides functional oils and lubricants for automotive and industrial machinery sectors. Functional fluids the company provides find significant applications in metal cutting and rolling, rust prevention, rubber processing, quenching, and heat transfer in industrial machinery.
Delta Western, Inc. (DWI) - Delta Western, Inc. (DWI) was formed through acquisition of Chevron Petroleum terminal facilities in several parts of Alaska. The company acquired Inlet Petroleum Company in 2014 and, after that, has expanded its distribution channel in Alaska. Delta Western, Inc. is a part of a transportation and distribution company named Saltchuk. The company is one of the key companies in the petroleum distribution division in the Alaska region. Delta Western provides services in fuel service programs, heating fuel delivery, equipment leasing sales, lube filter surveys and, oil analysis, and more. Major products supplied by the company include fuels, lubes & coolants, heat transfer fluids, filters, environmental products, additives & solvents and more.
British Petroleum (BP) - British Petroleum (BP) company's operations are concentrated in upstream and downstream activities in North and South America, Middle East, North and South Africa, Asia Pacific, and Australia. Since its inception, the company has acquired several companies such as Amoco, ARCO, Standard Ohio Oil, Castrol, and Aral. BP is involved in oil & gas E&P and marketing the products to commercial and industrial sectors. Upstream activities involve E&P, transportation, storage, and marketing of liquefied natural gas. Downstream activities deal with refining, manufacturing, and transportation of crude oil and petroleum products. The company has also ventured into tight reservoirs and biofuels managed by the alternative energy business. Some of its major distributors include Broughton Lubricants, Lubri Solutions, Swantek, and Orthwein, which have strengthened its global distribution network.
Huntsman Corporation - Huntsman Corporation operates in various business segments, which are advanced materials, polyurethanes, performance products, pigments, and textile effects. The company offers products catering to companies operating in plastics, textiles, automotive, aviation, construction, paints & coatings, healthcare, footwear, agriculture, furniture, detergent, appliances, and packaging. Since its inception, the company has completed many acquisitions, internal expansions, and joint ventures to manufacture and supply chemical products. Some of the major OEM collaborations of the company include BMW, General Electric, Chevron, Unilever, and P&G. Huntsman has executive office in Salt Lake City along with 75 manufacturing and R&D facilities in over 30 countries.
Royal Dutch Shell Plc - Royal Dutch Shell Plc is involved in E&P and natural gas and crude oil processing. It also manufactures and supplies petrochemical products and biofuels for commercial as well as industrial applications. The business portfolio primarily caters to clients in the marine, aviation, transport, power, mining, and manufacturing segments. The company also produces chemicals for textiles, packaging, carpets, tires, and compact discs. It has expanded its natural gas supply to cater to the increasing demand of LNG and has planned to manufacture liquefied natural gas at sea without plants onshore. The company has an employee base of around 90,000 located across 70 countries. The company has invested in large-scale R&D projects to develop technologies that increase oil recovery by up to 80% and in real-time monitoring of oil and gas fields that help optimize output.
Eastman Chemical Company - Eastman Chemical Company manufactures and supplies chemicals, plastics and fibers. The company has over 40 manufacturing sites in the U.S., Latin America, Europe, and Asia Pacific. The company's businesses are categorized into advanced materials, adhesives and plasticizers, specialty fluids and intermediates, fibers and additives, and functional products. Major end-use industries catered by the company include transportation, printing inks, industrials & chemical processing, construction, consumables, tobacco, food, biodiesel and agriculture markets. The company launched a new website for heat transfer fluid segment in May 2014. This move in the specialty fluid and intermediate segment aimed to provide product information and its applications to manufacturers and licensors. This segment caters to a wide range of applications such as low-pressure indirect heating systems, gas-to-liquid, plastics, biofuels, chemical, asphalt, synthetic fiber, specialty chemicals, and oil & gas manufacturing, storage and processing systems.
Phillips 66 - Phillips 66 was initially founded as Phillips Petroleum Company in the U.S. The company is marketing its products to various industries in North and Latin America, Europe, Asia Pacific, and Africa. The company's business portfolio is focused on energy, chemicals, refining, midstream, and marketing specialties. Phillips 66 Lubricants is an integral part of the company, which offers a range of products that include engine oil, aviation oils, hydraulic oil, metalworking fluids, turbine oils, gear lubricants, and greases. The heat transfer fluids segment is one of the categories in the industrial marketing and specialty lubricants section. The company's clientele is present in a range of industries, including automotive, agriculture, aviation, industrial, marine, and construction.
Supply Side Estimates
Company revenue estimation via referring to annual reports, investor presentations, and Hoover’s.
Segment revenue determination via variable analysis and penetration modeling.
Competitive benchmarking to identify market leaders and their collective revenue shares.
Forecasting via analyzing commercialization rates, pipelines, market initiatives, distribution networks, etc.
Demand side estimates
Identifying parent markets and ancillary markets
Segment penetration analysis to obtain pertinent
revenue/volume
Heuristic forecasting with the help of subject matter experts
Forecasting via variable analysis
Understanding market dynamics (in terms of drivers, restraints, & opportunities) in the countries.
Understanding trends & variables in the individual countries & their impact on growth and using analytical tools to provide high-level insights into the market dynamics and the associated growth pattern.
Understanding market estimates and forecasts (with the base year as 2023, historic information from 2018 to 2023, and forecast from 2024 to 2030). Regional estimates & forecasts for each category are available and are summed up to form the global market estimates.
The report provides market value for the base year 2023 and a yearly forecast till 2030 in terms of revenue/volume or both. The market for each of the segment outlooks has been provided on region & country basis for the above-mentioned forecast period.
The key industry dynamics, major technological trends, and application markets are evaluated to understand their impact on the demand for the forecast period. The growth rates were estimated using correlation, regression, and time-series analysis.
We have used the bottom-up approach for market sizing, analyzing key regional markets, dynamics, & trends for various products and end-users. The total market has been estimated by integrating the country markets.
All market estimates and forecasts have been validated through primary interviews with the key industry participants.
Inflation has not been accounted for to estimate and forecast the market.
Numbers may not add up due to rounding off.
Europe consists of EU-8, Central & Eastern Europe, along with the Commonwealth of Independent States (CIS).
Asia Pacific includes South Asia, East Asia, Southeast Asia, and Oceania (Australia & New Zealand).
Latin America includes Central American countries and the South American continent
Middle East includes Western Asia (as assigned by the UN Statistics Division) and the African continent.
GVR strives to procure the latest and unique information for reports directly from industry experts, which gives it a competitive edge. Quality is of utmost importance to us, therefore every year we focus on increasing our experts’ panel. Primary interviews are one of the critical steps in identifying recent market trends and scenarios. This process enables us to justify and validate our market estimates and forecasts to our clients. With more than 8,000 reports in our database, we have connected with some key opinion leaders across various domains, including healthcare, technology, consumer goods, and the chemical sector. Our process starts with identifying the right platform for a particular type of report, i.e., emails, LinkedIn, seminars, or telephonic conversation, as every report is unique and requires a differentiated approach.
We send out questionnaires to different experts from various regions/ countries, which is dependent on the following factors:
Report/Market scope: If the market study is global, we send questionnaires to industry experts across various regions, including North America, Europe, Asia Pacific, Latin America, and MEA.
Market Penetration: If the market is driven by technological advancements, population density, disease prevalence, or other factors, we identify experts and send out questionnaires based on region or country dominance.
The time to start receiving responses from industry experts varies based on how niche or well-penetrated the market is. Our reports include a detailed chapter on the KoL opinion section, which helps our clients understand the perspective of experts already in the market space.
"The quality of research they have done for us has been excellent."