GVR Report cover Flat Glass Market Size, Share & Trends Report

Flat Glass Market Size, Share & Trends Analysis Report By Product (Basic, Tempered, Laminated, Insulated), By End Use (Architectural, Automotive), By Region, And Segment Forecasts, 2025 - 2030

  • Report ID: 978-1-68038-437-6
  • Number of Report Pages: 90
  • Format: PDF, Horizon Databook
  • Historical Range: 2018 - 2023
  • Forecast Period: 2025 - 2030 
  • Industry: Advanced Materials

Flat Glass Market Size & Trends

The global flat glass market size was estimated at USD 311.44 billion in 2024 and is projected to grow at a CAGR of 4.6% from 2025 to 2030. New solar capacity expansions will positively impact the demand for glass. The growing trend of floating solar farms is further anticipated to boost the requirement for solar panels. This, in turn, is expected to boost growth over the forecast period. Also, the increasing adoption of electric vehicles (EVs) is anticipated to increase flat glass demand.
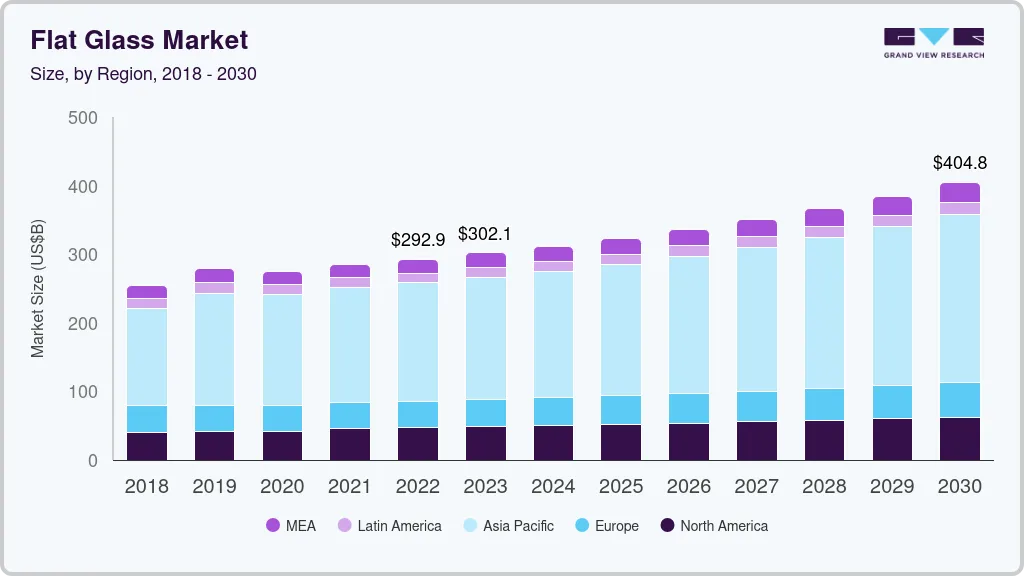
Flat Glass Market Size, By Product, 2020 - 2030 (USD Billion)

The governmental push toward aligning itself with the global decarbonization goals, in line with the 2021 Paris Agreement, has accelerated the production of EVs across the world. Several incentives have been provided for its sales and purchase. By 2035, automakers have committed to converting their existing production lines into EV production facilities.

Drivers, Opportunities & Restraints

The flat glass industry is primarily driven by its growing adoption in the building and construction industry for applications such as facades, windows, and energy-saving solutions. According to IEA, buildings account for 35% of global final energy consumption, there is a rising demand for energy-efficient materials, such as low-emissivity (low-E) glass, which enhances thermal insulation and reduces HVAC energy costs.

Recent trends, such as the establishment of building codes like China’s Design Standard for Energy Efficiency in Residential Buildings, and large-scale investments in smart cities, such as India’s USD 9.62 billion Smart Cities Mission, further highlight the market's growth potential.

The flat glass industry faces challenges from the high cost of advanced energy-efficient glass technologies, which can deter adoption in cost-sensitive markets. Additionally, the production process for glass is energy-intensive, raising concerns about its environmental footprint and adherence to strict emissions regulations.

Advancements in glass technology, such as low-E coatings and solar control features, present lucrative opportunities for market growth by aligning with global energy efficiency goals. The increasing focus on sustainable urbanization, exemplified by India’s Smart Cities Mission and similar initiatives worldwide, creates substantial demand for flat glass in infrastructure development. Furthermore, the transition to net-zero buildings offers potential for innovative glass products to play a pivotal role in reducing energy consumption while enhancing architectural aesthetics.

Product Insights

The tempered segment led the market with the largest revenue share of 36.0% in 2024. It is used in various applications, including household appliances, commercial refrigeration, vehicles, and other industrial areas. As tempered glass is safer in comparison to basic float glass, it is widely used in passenger vehicles to reduce the chances of injury in case of accidents. In the architectural segment, it is used in building and construction projects for windows, doors, and walls in some cases. Furthermore, it is used in the manufacturing of mobile devices and in the food service industry to produce equipment for cooking and baking activities.

The laminated glass segment accounted for second largest revenue share of 26.0% in 2024. This is virtually a safety glass comprising two pieces of glass, held together by one or several transparent plastic films. The use of laminated glass is increasing in automotive sunroofs due to increasing emphasis on safety and changing regulatory norms. Companies such as Tesla, Volvo, and Ferrari use laminated glass in all their cars that have panoramic sunroofs. However, the usage is less, as majority of manufacturers still use tempered glass.

End Use Insights

Based on end use, the architectural segment led the market with the largest revenue share of 71.5% in 2024. Applications pertaining to the building & construction industry are major contributors triggering the growth of this segment. The segment also includes the consumption of flat glass in furniture and other indoor applications. Increasing construction activities in developing countries such as India and ASEAN countries are expected to have a positive impact on the global market.

Besides, growing awareness regarding environmental protection and greenhouse gas reduction is expected to have a positive impact on green building projects, which is expected to augment demand for flat glass over the forecast period.
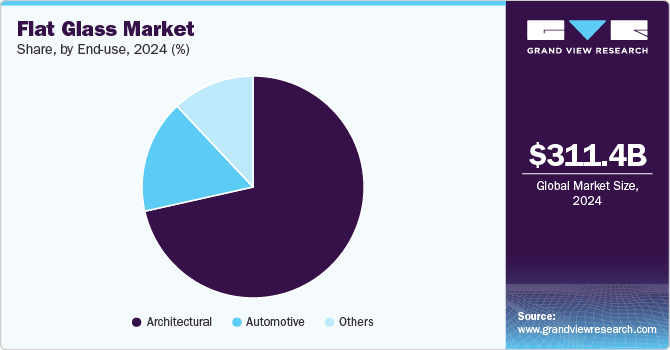
Flat Glass Market Share, By End Use, 2024 (%)

The other segment is anticipated to witness at the fastest CAGR during the forecast period. Advancements in solar panel technology and its declining prices are boosting the demand for solar panels. It consists of six main components: extruded aluminum frame, glass (preferably tempered glass), silicon PV cells, encapsulation with EVA film layers, polymer rear back sheet, and a junction box consisting of diodes and connectors. Glass is a key component as it protects the PV cells from external elements of weather.

Automotive was the second-largest segment of the global market in 2024. The segment is inclusive of flat glass consumption in automotive, aerospace, and marine applications. The consumption of flat glass is quite evident in automotive applications. Tempered glass and laminated glass are the major types of flat glass used in this segment.

Flat glass mainly finds applications in windows, windshields, side panels, sunroofs, and lights. The production output of automobiles has a direct impact on the consumption of glass. The increasing demand for lightweight vehicles and EVs is anticipated to propel the consumption of flat glass in automotive applications over the forecast period.

Regional Insights

The flat glass market in North America is anticipated to grow at the fastest CAGR during the forecast period. This high share is attributable to favorable government initiatives to encourage the adoption of electric vehicles and the construction of sustainable and ecologically friendly green buildings. Moreover, increasing government initiatives to reduce the reliance on conventional energy sources are expected to boost the demand for solar panels over the forecast period. Flat glass is an important component of solar panels. Increasing installation of solar panels is expected to have a positive impact on the demand for flat glass in the region.
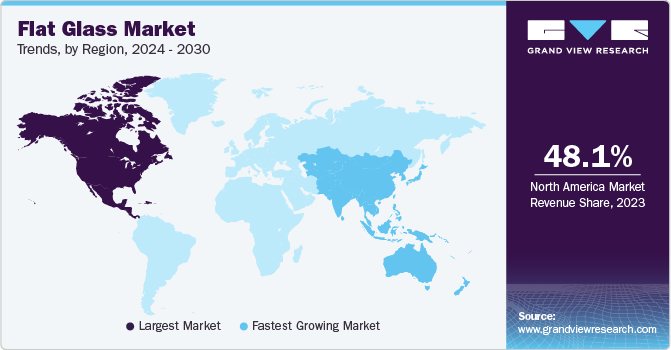
Flat Glass Market Trends, by Region, 2025 - 2030

U.S. Flat Glass Market Trends

The flat glass market in the U.S. is one of the leading producers of automobiles, including commercial and passenger vehicles, with the presence of several global leading manufacturers such as General Motors, Stellantis North America, and Ford Motors. Volkswagen is targeting 50% of the automobile sales to be of EVs by the year 2030. Increasing incentives to promote the usage of EVs are expected to drive the production of EVs and thereby increase the demand for the U.S. market over the forecast period.

Asia Pacific Flat Glass Market Trends

Asia Pacific dominated the flat glass market with the largest revenue share of 58.9% in 2024. Rising construction activities in the region, along with increasing penetration of glass-based architecture in residential and non-residential applications, are likely to further fuel the demand for flat glass, especially from the emerging economies of the region. Factors such as rapid economic growth, rising disposable incomes, and subsequent increases in the demand for residential housing and solar installations are expected to benefit the demand for flat glass in the region.

Europe Flat Glass Market Trends

The flat glass market in Europe is driven by the region's stringent energy efficiency regulations and focus on sustainable construction. Countries like Germany, France, and the UK are key contributors due to their advanced building codes and widespread adoption of low-emissivity glass. In addition, the region's expanding solar energy market, particularly in Spain and Italy, is bolstering demand for flat glass used in photovoltaic modules, further accelerating market growth.

Central & South America Flat Glass Market Trends

The flat glass market in Central & South America is anticipated to grow at the fastest CAGR during the forecast period. Rapid urbanization and infrastructure development in Central and South America are fueling the market growth, with Brazil, Mexico, and Argentina leading the charge. Moreover, the region’s growing automotive industry also boosts demand for flat glass in vehicle manufacturing. Sustainability is becoming a focus, with rising interest in energy-efficient building practices, especially in Mexico, where government-backed housing programs are increasingly incorporating advanced glass technologies.

Middle East & Africa Flat Glass Market Trends

The flat glass market in the Middle East & Africa is growing due to large-scale infrastructure projects and investments in energy-efficient buildings. Key countries like Saudi Arabia, the UAE, and South Africa are spearheading growth, with initiatives like Saudi Arabia’s Vision 2030, which includes mega projects such as NEOM City, driving demand for advanced glass solutions. The region’s harsh climate is also promoting the adoption of solar control and low-emissivity glass to reduce cooling costs.

Key Flat Glass Company Insights

Some of the key players operating in the market include AGC, Inc., and Saint-Gobain are among the major manufacturers of flat glass in the world.

  • AGC Inc. has classified its operations into four reportable segments, namely, glass, electronics, chemicals, and ceramics & others. In 2022, the glass segment accounted for the largest revenue share of the total revenue of the company. This segment has been further divided into architectural and automotive.

  • Saint Gobain offers various types of flat glass, including float glass, laminated glass, silvered glass, patterned glass, and coated glass. This segment also offers safety & fireproof glass, solar control glass, and acoustic protection glass for buildings, as well as windshields and glass sunroofs for automotive and aeronautic applications.

  • Euroglas is engaged in the production and processing of float glass, extra-white glass, laminated safety glass, and coated glass for thermal insulation and solar control applications. The company’s four production lines are located in Germany - in Hombourg, Haldensleben, Osterweddingen, and Ujazd with an overall basic glass production capacity of around 3,000 tons per day.

Key Flat Glass Companies:

The following are the leading companies in the flat glass market. These companies collectively hold the largest market share and dictate industry trends.

  • AGC Inc.
  • Central Glass Limited
  • CEVITAL Group
  • China Glass Holding Ltd.
  • Euroglas
  • Fuyao Glass Industry Group Co., Ltd.
  • Guardian Industries
  • Nippon Sheet Glass Co., Ltd
  • Saint-Gobain
  • ÅžiÅŸecam Group
  • Vitro
  • Xinyi Glass Holdings

View a comprehensive list of companies in the Flat Glass Market

Recent Developments

  • In October 2023, Vitro announced that it had signed an additional contract with First Solar to provide high-tech glass front sheets for the solar panels that First Solar manufactures in North America. Vitro will invest approximately USD 180 million in adapting its current facilities to meet the demands of the new contract expansion. The expansion is expected to generate additional sales of approximately USD 1.3 billion over the next 10 years, in addition to the initial 1.2-billion-dollar contract.

  • In July 2023, Cardinal Glass Industries Inc. made an announcement regarding the consolidation and expansion of Cardinal CT Company’s Custom Tempering Operations in the Western United States. Cardinal CT had acquired the Dixon, California tempering facility less than two years ago and has recently completed the planned building expansion, improved floor layout, and installed new equipment at the site. All of these changes have resulted in increased capacity, efficiency, and productivity.

  • In December 2022, Saint-Gobain India announced its plans to invest around USD 215 million towards its capacity expansion plans in 2023. This is part of its long-term plans to spend up to USD 970 million between 2022 and 2025. 

Flat Glass Market Report Scope 

Report Attribute

Details

Market size value in 2025

USD 323.19 billion

Revenue forecast in 2030

USD 404.76 billion

Growth rate

CAGR of 4.6% from 2025 to 2030

Base year for estimation

2024

Historical data

2018 - 2023

Forecast period

2025 - 2030

Quantitative Units

Volume in Kilotons, Revenue in USD million/billion, and CAGR from 2025 to 2030

Report coverage

Volume forecast, revenue forecast, competitive landscape, growth factors, and trends

Segments covered

Product, end use, region

Regional scope

North America; Europe; Asia Pacific; Central & South Africa; Middle East & Africa

Country scope

U.S.; Canada; Mexico; Germany; UK; France; Italy; Spain; Russia; Belgium; Poland; Czech Republic; China; Japan; India; Australia; Brazil; Argentina; Colombia; KSA; UAE; Iran; South Africa

Key companies profiled

AGC Inc.; Central Glass Limited; CEVITAL Group; China Glass Holding Ltd.; Euroglas; Fuyao Glass Industry Group Co., Ltd.; Guardian Industries; Nippon Sheet Glass Co., Ltd; Saint-Gobain; ÅžiÅŸecam Group; Vitro; Xinyi Glass Holdings

Customization scope

Free report customization (equivalent up to 8 analysts' working days) with purchase. Addition or alteration to country, regional & segment scope.

Pricing and purchase options

Avail customized purchase options to meet your exact research needs. Explore purchase options

Global Flat Glass Market Report Segmentation

This report forecasts revenue & volume growth at global, regional, and country levels and provides an analysis of the latest industry trends in each of the sub-segments from 2018 to 2030. For this study, Grand View Research has segmented the global flat glass market report based on the product, end use, and region:
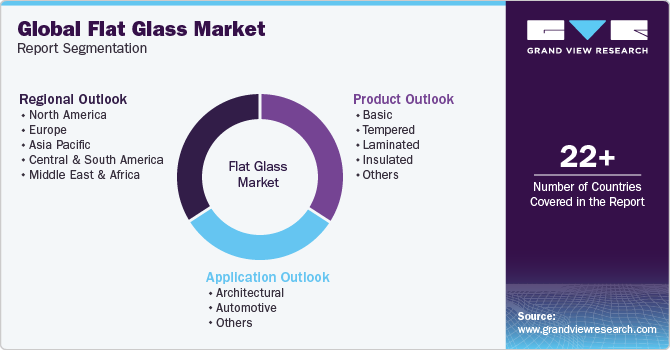
Global Flat Glass Market Report Segmentation

  • Product Outlook (Volume, Kilotons; Revenue, USD Million, 2018 - 2030)

    • Basic

    • Tempered

    • Laminated

    • Insulated

    • Others

  • End Use Outlook (Volume, Kilotons; Revenue, USD Million, 2018 - 2030)

    • Architectural

    • Automotive

    • Others

  • Regional Outlook (Volume, Kilotons; Revenue, USD Million, 2018 - 2030)

    • North America

      • U.S.

      • Canada

      • Mexico

    • Europe

      • Germany

      • UK

      • Russia

      • Italy

      • Spain

      • Russia

      • Belgium

      • Poland

      • Czechia

      • Turkey

    • Asia Pacific

      • China

      • India

      • Japan

      • Australia

    • Central & South America

      • Brazil

      • Argentina

      • Colombia

    • Middle East & Africa

      • Saudi Arabia

      • UAE

      • Iran

      • South Africa

Frequently Asked Questions About This Report

Table of Contents

Chapter 1. Methodology and Scope
                    1.1. Market Segmentation & Scope
                    1.2. Market Definition
                    1.3. Information Procurement
                        1.3.1. Information Analysis
                        1.3.2. Market Formulation & Data Visualization
                        1.3.3. Data Validation & Publishing
                    1.4. Research Scope and Assumptions
                        1.4.1. List of Data Sources
Chapter 2. Executive Summary
                    2.1. Market Snapshot
                    2.2. Segmental Outlook
                    2.3. Competitive Outlook
Chapter 3. Market Variables, Trends, and Scope
                    3.1. Market Outlook
                        3.1.1. Global Flat Glass Market Outlook
                    3.2. Value Chain Analysis
                        3.2.1. Raw Material Outlook
                    3.3. Manufacturing & Technology Overview
                    3.4. Regulatory Framework
                    3.5. Market Dynamics
                        3.5.1. Market Driver Analysis
                        3.5.2. Market Restraint Analysis
                        3.5.3. Market Opportunities
                        3.5.4. Market Challenges
                    3.6. Porter’s Five Forces Analysis
                        3.6.1. Bargaining Power of Suppliers
                        3.6.2. Bargaining Power of Buyers
                        3.6.3. Threat of Substitution
                        3.6.4. Threat of New Entrants
                        3.6.5. Competitive Rivalry
                    3.7. PESTLE Analysis
                        3.7.1. Political
                        3.7.2. Economic
                        3.7.3. Social Landscape
                        3.7.4. Technology
                        3.7.5. Environmental
                        3.7.6. Legal
Chapter 4. Flat Glass Market: Product Estimates & Trend Analysis
                    4.1. Flat Glass Market: Product Movement Analysis, 2024 & 2030
                    4.2. Basic Float
                        4.2.1. Market estimates and forecasts, 2018 - 2030 (Kilotons) (USD Million)
                    4.3. Tempered
                        4.3.1. Market estimates and forecasts, 2018 - 2030 (Kilotons) (USD Million)
                    4.4. Laminated
                        4.4.1. Market estimates and forecasts, 2018 - 2030 (Kilotons) (USD Million)
                    4.5. Insulated
                        4.5.1. Market estimates and forecasts, 2018 - 2030 (Kilotons) (USD Million)
                    4.6. Other Products
                        4.6.1. Market estimates and forecasts, 2018 - 2030 (Kilotons) (USD Million)
Chapter 5. Flat Glass Market: End Use Estimates & Trend Analysis
                    5.1. Flat Glass Market: End Use Movement Analysis, 2024 & 2030
                    5.2. Architectural
                        5.2.1. Market estimates and forecasts, 2018 - 2030 (Kilotons) (USD Million)
                    5.3. Automotive
                        5.3.1. Market estimates and forecasts, 2018 - 2030 (Kilotons) (USD Million)
                    5.4. Other End Uses
                        5.4.1. Market estimates and forecasts, 2018 - 2030 (Kilotons) (USD Million)
Chapter 6. Flat Glass Market: Regional Estimates & Trend Analysis
                    6.1. Regional Analysis, 2024 & 2030
                    6.2. North America
                        6.2.1. Market estimates and forecasts, 2018 - 2030 (Kilotons) (USD Million)
                        6.2.2. Market estimates and forecasts, by product, 2018 - 2030 (Kilotons) (USD Million)
                        6.2.3. Market estimates and forecasts, by end use, 2018 - 2030 (Kilotons) (USD Million)
                        6.2.4. U.S.
                            6.2.4.1. Market estimates and forecasts, 2018 - 2030 (Kilotons) (USD Million)
                            6.2.4.2. Market estimates and forecasts, by product, 2018 - 2030 (Kilotons) (USD Million)
                            6.2.4.3. Market estimates and forecasts, by end use, 2018 - 2030 (Kilotons) (USD Million)
                        6.2.5. Canada
                            6.2.5.1. Market estimates and forecasts, 2018 - 2030 (Kilotons) (USD Million)
                            6.2.5.2. Market estimates and forecasts, by product, 2018 - 2030 (Kilotons) (USD Million)
                            6.2.5.3. Market estimates and forecasts, by end use, 2018 - 2030 (Kilotons) (USD Million)
                        6.2.6. Mexico
                            6.2.6.1. Market estimates and forecasts, 2018 - 2030 (Kilotons) (USD Million)
                            6.2.6.2. Market estimates and forecasts, by product, 2018 - 2030 (Kilotons) (USD Million)
                            6.2.6.3. Market estimates and forecasts, by end use, 2018 - 2030 (Kilotons) (USD Million)
                    6.3. Europe
                        6.3.1. Market estimates and forecasts, 2018 - 2030 (Kilotons) (USD Million)
                        6.3.2. Market estimates and forecasts, by product, 2018 - 2030 (Kilotons) (USD Million)
                        6.3.3. Market estimates and forecasts, by end use, 2018 - 2030 (Kilotons) (USD Million)
                        6.3.4. Germany
                            6.3.4.1. Market estimates and forecasts, 2018 - 2030 (Kilotons) (USD Million)
                            6.3.4.2. Market estimates and forecasts, by product, 2018 - 2030 (Kilotons) (USD Million)
                            6.3.4.3. Market estimates and forecasts, by end use, 2018 - 2030 (Kilotons) (USD Million)
                        6.3.5. UK
                            6.3.5.1. Market estimates and forecasts, 2018 - 2030 (Kilotons) (USD Million)
                            6.3.5.2. Market estimates and forecasts, by product, 2018 - 2030 (Kilotons) (USD Million)
                            6.3.5.3. Market estimates and forecasts, by end use, 2018 - 2030 (Kilotons) (USD Million)
                        6.3.6. France
                            6.3.6.1. Market estimates and forecasts, 2018 - 2030 (Kilotons) (USD Million)
                            6.3.6.2. Market estimates and forecasts, by product, 2018 - 2030 (Kilotons) (USD Million)
                            6.3.6.3. Market estimates and forecasts, by end use, 2018 - 2030 (Kilotons) (USD Million)
                        6.3.7. Spain
                            6.3.7.1. Market estimates and forecasts, 2018 - 2030 (Kilotons) (USD Million)
                            6.3.7.2. Market estimates and forecasts, by product, 2018 - 2030 (Kilotons) (USD Million)
                            6.3.7.3. Market estimates and forecasts, by end use, 2018 - 2030 (Kilotons) (USD Million)
                        6.3.8. Russia
                            6.3.8.1. Market estimates and forecasts, 2018 - 2030 (Kilotons) (USD Million)
                            6.3.8.2. Market estimates and forecasts, by product, 2018 - 2030 (Kilotons) (USD Million)
                            6.3.8.3. Market estimates and forecasts, by end use, 2018 - 2030 (Kilotons) (USD Million)
                        6.3.9. Italy
                            6.3.9.1. Market estimates and forecasts, 2018 - 2030 (Kilotons) (USD Million)
                            6.3.9.2. Market estimates and forecasts, by product, 2018 - 2030 (Kilotons) (USD Million)
                            6.3.9.3. Market estimates and forecasts, by end use, 2018 - 2030 (Kilotons) (USD Million)
                        6.3.10. Belgium
                            6.3.10.1. Market estimates and forecasts, 2018 - 2030 (Kilotons) (USD Million)
                            6.3.10.2. Market estimates and forecasts, by product, 2018 - 2030 (Kilotons) (USD Million)
                            6.3.10.3. Market estimates and forecasts, by end use, 2018 - 2030 (Kilotons) (USD Million)
                        6.3.11. Poland
                            6.3.11.1. Market estimates and forecasts, 2018 - 2030 (Kilotons) (USD Million)
                            6.3.11.2. Market estimates and forecasts, by product, 2018 - 2030 (Kilotons) (USD Million)
                            6.3.11.3. Market estimates and forecasts, by end use, 2018 - 2030 (Kilotons) (USD Million)
                        6.3.12. Czech Republic
                            6.3.12.1. Market estimates and forecasts, 2018 - 2030 (Kilotons) (USD Million)
                            6.3.12.2. Market estimates and forecasts, by product, 2018 - 2030 (Kilotons) (USD Million)
                            6.3.12.3. Market estimates and forecasts, by end use, 2018 - 2030 (Kilotons) (USD Million)
                    6.4. Asia Pacific
                        6.4.1. Market estimates and forecasts, 2018 - 2030 (Kilotons) (USD Million)
                        6.4.2. Market estimates and forecasts, by product, 2018 - 2030 (Kilotons) (USD Million)
                        6.4.3. Market estimates and forecasts, by end use, 2018 - 2030 (Kilotons) (USD Million)
                        6.4.4. China
                            6.4.4.1. Market estimates and forecasts, 2018 - 2030 (Kilotons) (USD Million)
                            6.4.4.2. Market estimates and forecasts, by product, 2018 - 2030 (Kilotons) (USD Million)
                            6.4.4.3. Market estimates and forecasts, by end use, 2018 - 2030 (Kilotons) (USD Million)
                        6.4.5. India
                            6.4.5.1. Market estimates and forecasts, 2018 - 2030 (Kilotons) (USD Million)
                            6.4.5.2. Market estimates and forecasts, by product, 2018 - 2030 (Kilotons) (USD Million)
                            6.4.5.3. Market estimates and forecasts, by end use, 2018 - 2030 (Kilotons) (USD Million)
                        6.4.6. Japan
                            6.4.6.1. Market estimates and forecasts, 2018 - 2030 (Kilotons) (USD Million)
                            6.4.6.2. Market estimates and forecasts, by product, 2018 - 2030 (Kilotons) (USD Million)
                            6.4.6.3. Market estimates and forecasts, by end use, 2018 - 2030 (Kilotons) (USD Million)
                        6.4.7. Australia
                            6.4.7.1. Market estimates and forecasts, 2018 - 2030 (Kilotons) (USD Million)
                            6.4.7.2. Market estimates and forecasts, by product, 2018 - 2030 (Kilotons) (USD Million)
                            6.4.7.3. Market estimates and forecasts, by end use, 2018 - 2030 (Kilotons) (USD Million)
                    6.5. Central & South America
                        6.5.1. Market estimates and forecasts, 2018 - 2030 (Kilotons) (USD Million)
                        6.5.2. Market estimates and forecasts, by product, 2018 - 2030 (Kilotons) (USD Million)
                        6.5.3. Market estimates and forecasts, by end use, 2018 - 2030 (Kilotons) (USD Million)
                        6.5.4. Brazil
                            6.5.4.1. Market estimates and forecasts, 2018 - 2030 (Kilotons) (USD Million)
                            6.5.4.2. Market estimates and forecasts, by product, 2018 - 2030 (Kilotons) (USD Million)
                            6.5.4.3. Market estimates and forecasts, by end use, 2018 - 2030 (Kilotons) (USD Million)
                        6.5.5. Argentina
                            6.5.5.1. Market estimates and forecasts, 2018 - 2030 (Kilotons) (USD Million)
                            6.5.5.2. Market estimates and forecasts, by product, 2018 - 2030 (Kilotons) (USD Million)
                            6.5.5.3. Market estimates and forecasts, by end use, 2018 - 2030 (Kilotons) (USD Million)
                        6.5.6. Colombia
                            6.5.6.1. Market estimates and forecasts, 2018 - 2030 (Kilotons) (USD Million)
                            6.5.6.2. Market estimates and forecasts, by product, 2018 - 2030 (Kilotons) (USD Million)
                            6.5.6.3. Market estimates and forecasts, by end use, 2018 - 2030 (Kilotons) (USD Million)
                    6.6. Middle East & Africa
                        6.6.1. Market estimates and forecasts, 2018 - 2030 (Kilotons) (USD Million)
                        6.6.2. Market estimates and forecasts, by product, 2018 - 2030 (Kilotons) (USD Million)
                        6.6.3. Market estimates and forecasts, by end use, 2018 - 2030 (Kilotons) (USD Million)
                        6.6.4. Saudi Arabia
                            6.6.4.1. Market estimates and forecasts, 2018 - 2030 (Kilotons) (USD Million)
                            6.6.4.2. Market estimates and forecasts, by product, 2018 - 2030 (Kilotons) (USD Million)
                            6.6.4.3. Market estimates and forecasts, by end use, 2018 - 2030 (Kilotons) (USD Million)
                        6.6.5. UAE
                            6.6.5.1. Market estimates and forecasts, 2018 - 2030 (Kilotons) (USD Million)
                            6.6.5.2. Market estimates and forecasts, by product, 2018 - 2030 (Kilotons) (USD Million)
                            6.6.5.3. Market estimates and forecasts, by end use, 2018 - 2030 (Kilotons) (USD Million)
                        6.6.6. Iran
                            6.6.6.1. Market estimates and forecasts, 2018 - 2030 (Kilotons) (USD Million)
                            6.6.6.2. Market estimates and forecasts, by product, 2018 - 2030 (Kilotons) (USD Million)
                            6.6.6.3. Market estimates and forecasts, by end use, 2018 - 2030 (Kilotons) (USD Million)
                        6.6.7. South Africa
                            6.6.7.1. Market estimates and forecasts, 2018 - 2030 (Kilotons) (USD Million)
                            6.6.7.2. Market estimates and forecasts, by product, 2018 - 2030 (Kilotons) (USD Million)
                            6.6.7.3. Market estimates and forecasts, by end use, 2018 - 2030 (Kilotons) (USD Million)
Chapter 7. Competitive Landscape
                    7.1. Recent Developments, By Key Market Participants
                    7.2. Company/Competition Categorization
                    7.3. Company Market Ranking
                    7.4. Heat Map Analysis
                    7.5. List of Prospective End Users
                    7.6. Strategy Mapping
                    7.7. Company Profiles/Listing
                        7.7.1. AGC Inc.
                            7.7.1.1. Company Overview
                            7.7.1.2. Financial Performance
                            7.7.1.3. Product Benchmarking
                        7.7.2. Central Glass Limited
                            7.7.2.1. Company Overview
                            7.7.2.2. Financial Performance
                            7.7.2.3. Product Benchmarking
                        7.7.3. CEVITAL Group
                            7.7.3.1. Company Overview
                            7.7.3.2. Financial Performance
                            7.7.3.3. Product Benchmarking
                        7.7.4. China Glass Holding Ltd.
                            7.7.4.1. Company Overview
                            7.7.4.2. Financial Performance
                            7.7.4.3. Product Benchmarking
                        7.7.5. Euroglas
                            7.7.5.1. Company Overview
                            7.7.5.2. Financial Performance
                            7.7.5.3. Product Benchmarking
                        7.7.6. Fuyao Glass Industry Group Co., Ltd.
                            7.7.6.1. Company Overview
                            7.7.6.2. Financial Performance
                            7.7.6.3. Product Benchmarking
                        7.7.7. Guardian Industries
                            7.7.7.1. Company Overview
                            7.7.7.2. Financial Performance
                            7.7.7.3. Product Benchmarking
                        7.7.8. Nippon Sheet Glass Co., Ltd.
                            7.7.8.1. Company Overview
                            7.7.8.2. Financial Performance
                            7.7.8.3. Product Benchmarking
                        7.7.9. Saint Gobain
                            7.7.9.1. Company Overview
                            7.7.9.2. Financial Performance
                            7.7.9.3. Product Benchmarking
                        7.7.10. ÅžiÅŸecam Group
                            7.7.10.1. Company Overview
                            7.7.10.2. Financial Performance
                            7.7.10.3. Product Benchmarking
                        7.7.11. Vitro
                            7.7.11.1. Company Overview
                            7.7.11.2. Financial Performance
                            7.7.11.3. Product Benchmarking
                        7.7.12. Xinyi Glass Holdings
                            7.7.12.1. Company Overview
                            7.7.12.2. Financial Performance
                            7.7.12.3. Product Benchmarking


List of Tables

Table 1 Flat Glass market estimates & forecasts, 2018 - 2030 (Kilotons) (USD Million)
Table 2 Basic flat glass market estimates & forecasts, 2018 - 2030 (Kilotons) (USD Million)
Table 3 Tempered flat glass market estimates & forecasts, 2018 - 2030 (Kilotons) (USD Million)
Table 4 Laminated flat glass market estimates & forecasts, 2018 - 2030 (Kilotons) (USD Million)
Table 5 Insulated flat glass market estimates & forecasts, 2018 - 2030 (Kilotons) (USD Million)
Table 6 Other flat glass market estimates & forecasts, 2018 - 2030 (Kilotons) (USD Million)
Table 7 Flat Glass market estimates & forecasts, in architectural, 2018 - 2030 (Kilotons) (USD Million)
Table 8 Flat Glass market estimates & forecasts, in automotive, 2018 - 2030 (Kilotons) (USD Million)
Table 9 Flat Glass market estimates & forecasts, in other end uses, 2018 - 2030 (Kilotons) (USD Million)
Table 10 North America flat glass market estimates & forecast, 2018 - 2030 (Kilotons) (USD Million)
Table 11 North America flat glass market estimates & forecasts by product, 2018 - 2030 (Kilotons) (USD Million)
Table 12 North America flat glass market estimates & forecasts by end use, 2018 - 2030 (Kilotons) (USD Million)
Table 13 U.S. flat glass market estimates & forecasts, 2018 - 2030 (Kilotons) (USD Million)
Table 14 U.S. flat glass market estimates & forecasts by product, 2018 - 2030 (Kilotons) (USD Million)
Table 15 U.S. flat glass market estimates & forecasts by end use, 2018 - 2030 (Kilotons) (USD Million)
Table 16 Canada flat glass market estimates & forecasts, 2018 - 2030 (Kilotons) (USD Million)
Table 17 Canada flat glass market estimates & forecasts by product, 2018 - 2030 (Kilotons) (USD Million)
Table 18 Canada flat glass market estimates & forecasts by end use, 2018 - 2030 (Kilotons) (USD Million)
Table 19 Mexico flat glass market estimates & forecasts, 2018 - 2030 (Kilotons) (USD Million)
Table 20 Mexico flat glass market estimates & forecasts by product, 2018 - 2030 (Kilotons) (USD Million)
Table 21 Mexico flat glass market estimates & forecasts by end use, 2018 - 2030 (Kilotons) (USD Million)
Table 22 Europe flat glass market estimates & forecasts, 2018 - 2030 (Kilotons) (USD Million)
Table 23 Europe flat glass market estimates & forecasts by product, 2018 - 2030 (Kilotons) (USD Million)
Table 24 Europe flat glass market estimates & forecasts by end use, 2018 - 2030 (Kilotons) (USD Million)
Table 25 Germany flat glass market estimates & forecasts, 2018 - 2030 (Kilotons) (USD Million)
Table 26 Germany flat glass market estimates & forecasts by product, 2018 - 2030 (Kilotons) (USD Million)
Table 27 Germany flat glass market estimates & forecasts by end use, 2018 - 2030 (Kilotons) (USD Million)
Table 28 UK flat glass market estimates & forecast, 2018 - 2030 (Kilotons) (USD Million)
Table 29 UK flat glass market estimates & forecasts by product, 2018 - 2030 (Kilotons) (USD Million)
Table 30 UK flat glass market estimates & forecasts by end use, 2018 - 2030 (Kilotons) (USD Million)
Table 31 Italy flat glass market estimates & forecasts, 2018 - 2030 (Kilotons) (USD Million)
Table 32 Italy flat glass market estimates & forecasts by product, 2018 - 2030 (Kilotons) (USD Million)
Table 33 Italy flat glass market estimates & forecasts by end use, 2018 - 2030 (Kilotons) (USD Million)
Table 34 Spain flat glass market estimates & forecast, 2018 - 2030 (Kilotons) (USD Million)
Table 35 Spain flat glass market estimates & forecasts by product, 2018 - 2030 (Kilotons) (USD Million)
Table 36 Spain flat glass market estimates & forecasts by end use, 2018 - 2030 (Kilotons) (USD Million)
Table 37 Russia flat glass market estimates & forecast, 2018 - 2030 (Kilotons) (USD Million)
Table 38 Russia flat glass market estimates & forecasts by product, 2018 - 2030 (Kilotons) (USD Million)
Table 39 Russia flat glass market estimates & forecasts by end use, 2018 - 2030 (Kilotons) (USD Million)
Table 40 Belgium flat glass market estimates & forecast, 2018 - 2030 (Kilotons) (USD Million)
Table 41 Belgium flat glass market estimates & forecasts by product, 2018 - 2030 (Kilotons) (USD Million)
Table 42 Belgium flat glass market estimates & forecasts by end use, 2018 - 2030 (Kilotons) (USD Million)
Table 43 Poland flat glass market estimates & forecast, 2018 - 2030 (Kilotons) (USD Million)
Table 44 Poland flat glass market estimates & forecasts by product, 2018 - 2030 (Kilotons) (USD Million)
Table 45 Poland flat glass market estimates & forecasts by end use, 2018 - 2030 (Kilotons) (USD Million)
Table 46 Czech Republic flat glass market estimates & forecast, 2018 - 2030 (Kilotons) (USD Million)
Table 47 Czech Republic flat glass market estimates & forecasts by product, 2018 - 2030 (Kilotons) (USD Million)
Table 48 Czech Republic flat glass market estimates & forecasts by end use, 2018 - 2030 (Kilotons) (USD Million)
Table 49 Asia Pacific flat glass market estimates & forecast, 2018 - 2030 (Kilotons) (USD Million)
Table 50 Asia Pacific flat glass market estimates & forecasts by product, 2018 - 2030 (Kilotons) (USD Million)
Table 51 Asia Pacific flat glass market estimates & forecasts by end use, 2018 - 2030 (Kilotons) (USD Million)
Table 52 China flat glass market estimates & forecast, 2018 - 2030 (Kilotons) (USD Million)
Table 53 China flat glass market estimates & forecasts by product, 2018 - 2030 (Kilotons) (USD Million)
Table 54 China flat glass market estimates & forecasts by end use, 2018 - 2030 (Kilotons) (USD Million)
Table 55 Japan flat glass market estimates & forecast, 2018 - 2030 (Kilotons) (USD Million)
Table 56 Japan flat glass market estimates & forecasts by product, 2018 - 2030 (Kilotons) (USD Million)
Table 57 Japan flat glass market estimates & forecasts by end use, 2018 - 2030 (Kilotons) (USD Million)
Table 58 India flat glass market estimates & forecast, 2018 - 2030 (Kilotons) (USD Million)
Table 59 India flat glass market estimates & forecasts by product, 2018 - 2030 (Kilotons) (USD Million)
Table 60 India flat glass market estimates & forecasts by end use, 2018 - 2030 (Kilotons) (USD Million)
Table 61 Australia flat glass market estimates & forecast, 2018 - 2030 (Kilotons) (USD Million)
Table 62 Australia flat glass market estimates & forecasts by product, 2018 - 2030 (Kilotons) (USD Million)
Table 63 Australia flat glass market estimates & forecasts by end use, 2018 - 2030 (Kilotons) (USD Million)
Table 64 Central & South America flat glass market estimates & forecasts, 2018 - 2030 (Kilotons) (USD Million)
Table 65 Central & South America flat glass market estimates & forecasts by product, 2018 - 2030 (Kilotons)
Table 66 Central & South America flat glass market estimates & forecasts by product, 2018 - 2030 (Kilotons) (USD Million)
Table 67 Central & South America flat glass market estimates & forecasts by end use, 2018 - 2030 (Kilotons)
Table 68 Central & South America flat glass market estimates & forecasts by end use, 2018 - 2030 (Kilotons) (USD Million)
Table 69 Brazil flat glass market estimates & forecasts, 2018 - 2030 (Kilotons) (USD Million)
Table 70 Brazil flat glass market estimates & forecasts by product, 2018 - 2030 (Kilotons) (USD Million)
Table 71 Brazil flat glass market estimates & forecasts by end use, 2018 - 2030 (Kilotons) (USD Million)
Table 72 Argentina flat glass market estimates & forecast, 2018 - 2030 (Kilotons) (USD Million)
Table 73 Argentina flat glass market estimates & forecasts by product, 2018 - 2030 (Kilotons) (USD Million)
Table 74 Argentina flat glass market estimates & forecasts by end use, 2018 - 2030 (Kilotons) (USD Million)
Table 75 Colombia flat glass market estimates & forecast, 2018 - 2030 (Kilotons) (USD Million)
Table 76 Colombia flat glass market estimates & forecasts by product, 2018 - 2030 (Kilotons) (USD Million)
Table 77 Colombia flat glass market estimates & forecasts by end use, 2018 - 2030 (Kilotons) (USD Million)
Table 78 Middle East & Africa flat glass market estimates & forecast, 2018 - 2030 (Kilotons) (USD Million)
Table 79 Middle East & Africa flat glass market estimates & forecasts by product, 2018 - 2030 (Kilotons) (USD Million)
Table 80 Middle East & Africa flat glass market estimates & forecasts by end use, 2018 - 2030 (Kilotons) (USD Million)
Table 81 Saudi Arabia flat glass market estimates & forecast, 2018 - 2030 (Kilotons) (USD Million)
Table 82 Saudi Arabia flat glass market estimates & forecasts by product, 2018 - 2030 (Kilotons) (USD Million)
Table 83 Saudi Arabia flat glass market estimates & forecasts by end use, 2018 - 2030 (Kilotons) (USD Million)
Table 84 UAE flat glass market estimates & forecast, 2018 - 2030 (Kilotons) (USD Million)
Table 85 UAE flat glass market estimates & forecasts by product, 2018 - 2030 (Kilotons) (USD Million)
Table 86 UAE flat glass market estimates & forecasts by end use, 2018 - 2030 (Kilotons) (USD Million)
Table 87 Iran flat glass market estimates & forecast, 2018 - 2030 (Kilotons) (USD Million)
Table 88 Iran flat glass market estimates & forecasts by product, 2018 - 2030 (Kilotons) (USD Million)
Table 89 Iran flat glass market estimates & forecasts by end use, 2018 - 2030 (Kilotons) (USD Million)
Table 90 South Africa flat glass market estimates & forecast, 2018 - 2030 (Kilotons) (USD Million)
Table 91 South Africa flat glass market estimates & forecasts by product, 2018 - 2030 (Kilotons) (USD Million)
Table 92 South Africa flat glass market estimates & forecasts by end use, 2018 - 2030 (Kilotons) (USD Million)


List of Figures

Fig. 1 Market segmentation
Fig. 2 Information procurement
Fig. 3 Data analysis models
Fig. 4 Market formulation and validation
Fig. 5 Data validating & publishing
Fig. 6 Market snapshot
Fig. 7 Segmental outlook - End Use & Product
Fig. 8 Competitive Outlook
Fig. 9 Flat Glass market outlook, 2018 - 2030 (Kilotons) (USD Million)
Fig. 10 Value chain analysis
Fig. 11 Market dynamics
Fig. 12 Porter’s Analysis
Fig. 13 PESTEL Analysis
Fig. 14 Flat Glass market, by product: Key takeaways
Fig. 15 Flat Glass market, by product: Market share, 2023 & 2030
Fig. 16 Flat Glass market, by end use: Key takeaways
Fig. 17 Flat Glass market, by end use: Market share, 2023 & 2030
Fig. 18 Flat Glass market: Regional analysis, 2023
Fig. 19 Flat Glass market, by region: Key takeaways

What questions do you have? Get quick response from our industry experts. Request a Free Consultation

Market Segmentation

  • Flat Glass Product Outlook (Volume, Kilotons; Revenue, USD Million, 2018 - 2030)
    • Basic
    • Tempered
    • Laminated
    • Insulated
    • Others
  • Flat Glass End Use Outlook (Volume, Kilotons; Revenue, USD Million, 2018 - 2030)
    • Architectural
    • Automotive
    • Others
  • Flat Glass Regional Outlook (Volume, Kilotons; Revenue, USD Million, 2018 - 2030)
    • North America
      • North America Flat Glass Market, By product
        • Basic
        • Tempered
        • Laminated
        • Insulated
        • Others
      • North America Flat Glass Market, By end use
        • Architectural
        • Automotive
        • Others
      • U.S.
        • U.S. Flat Glass Market, By product
          • Basic
          • Tempered
          • Laminated
          • Insulated
          • Others
        • U.S. Flat Glass Market, By end use
          • Architectural
          • Automotive
          • Others
      • Canada
        • Canada Flat Glass Market, By product
          • Basic
          • Tempered
          • Laminated
          • Insulated
          • Others
        • Canada Flat Glass Market, By end use
          • Architectural
          • Automotive
          • Others
      • Mexico
        • Mexico Flat Glass Market, By product
          • Basic
          • Tempered
          • Laminated
          • Insulated
          • Others
        • Mexico Flat Glass Market, By end use
          • Architectural
          • Automotive
          • Others
    • Europe
      • Europe Flat Glass Market, By product
        • Basic
        • Tempered
        • Laminated
        • Insulated
        • Others
      • Europe Flat Glass Market, By end use
        • Architectural
        • Automotive
        • Others
      • Germany
        • Germany Flat Glass Market, By product
          • Basic
          • Tempered
          • Laminated
          • Insulated
          • Others
        • Germany Flat Glass Market, By end use
          • Architectural
          • Automotive
          • Others
      • UK
        • UK Flat Glass Market, By product
          • Basic
          • Tempered
          • Laminated
          • Insulated
          • Others
        • UK Flat Glass Market, By end use
          • Architectural
          • Automotive
          • Others
      • France
        • France Flat Glass Market, By product
          • Basic
          • Tempered
          • Laminated
          • Insulated
          • Others
        • France Flat Glass Market, By end use
          • Architectural
          • Automotive
          • Others
      • Russia
        • Russia Flat Glass Market, By product
          • Basic
          • Tempered
          • Laminated
          • Insulated
          • Others
        • Russia Flat Glass Market, By end use
          • Architectural
          • Automotive
          • Others
      • Italy
        • Italy Flat Glass Market, By product
          • Basic
          • Tempered
          • Laminated
          • Insulated
          • Others
        • Italy Flat Glass Market, By end use
          • Architectural
          • Automotive
          • Others
      • Belgium
        • Belgium Flat Glass Market, By product
          • Basic
          • Tempered
          • Laminated
          • Insulated
          • Others
        • Belgium Flat Glass Market, By end use
          • Architectural
          • Automotive
          • Others
      • Poland
        • Poland Flat Glass Market, By product
          • Basic
          • Tempered
          • Laminated
          • Insulated
          • Others
        • Poland Flat Glass Market, By end use
          • Architectural
          • Automotive
          • Others
      • Czech Republic
        • Czech Republic Flat Glass Market, By product
          • Basic
          • Tempered
          • Laminated
          • Insulated
          • Others
        • Czech Republic Flat Glass Market, By end use
          • Architectural
          • Automotive
          • Others
    • Asia Pacific
      • Asia Pacific Flat Glass Market, By product
        • Basic
        • Tempered
        • Laminated
        • Insulated
        • Others
      • Asia Pacific Flat Glass Market, By end use
        • Architectural
        • Automotive
        • Others
      • China
        • China Flat Glass Market, By product
          • Basic
          • Tempered
          • Laminated
          • Insulated
          • Others
        • China Flat Glass Market, By end use
          • Architectural
          • Automotive
          • Others
      • Japan
        • Japan Flat Glass Market, By product
          • Basic
          • Tempered
          • Laminated
          • Insulated
          • Others
        • Japan Flat Glass Market, By end use
          • Architectural
          • Automotive
          • Others
      • India
        • India Flat Glass Market, By product
          • Basic
          • Tempered
          • Laminated
          • Insulated
          • Others
        • India Flat Glass Market, By end use
          • Architectural
          • Automotive
          • Others
      • Australia
        • Australia Flat Glass Market, By product
          • Basic
          • Tempered
          • Laminated
          • Insulated
          • Others
        • Australia Flat Glass Market, By end use
          • Architectural
          • Automotive
          • Others
    • Central & South America
      • Central & South America Flat Glass Market, By product
        • Basic
        • Tempered
        • Laminated
        • Insulated
        • Others
      • Central & South America Flat Glass Market, By end use
        • Architectural
        • Automotive
        • Others
      • Brazil
        • Brazil Flat Glass Market, By product
          • Basic
          • Tempered
          • Laminated
          • Insulated
          • Others
        • Brazil Flat Glass Market, By end use
          • Architectural
          • Automotive
          • Others
      • Argentina
        • Argentina Flat Glass Market, By product
          • Basic
          • Tempered
          • Laminated
          • Insulated
          • Others
        • Argentina Flat Glass Market, By end use
          • Architectural
          • Automotive
          • Others
      • Colombia
        • Colombia Flat Glass Market, By product
          • Basic
          • Tempered
          • Laminated
          • Insulated
          • Others
        • Colombia Flat Glass Market, By end use
          • Architectural
          • Automotive
          • Others
    • Middle East & Africa
      • Middle East & Africa Flat Glass Market, By product
        • Basic
        • Tempered
        • Laminated
        • Insulated
        • Others
      • Middle East Africa Flat Glass Market, By end use
        • Architectural
        • Automotive
        • Others
      • Saudi Arabia
        • Saudi Arabia Flat Glass Market, By product
          • Basic
          • Tempered
          • Laminated
          • Insulated
          • Others
        • Saudi Arabia Flat Glass Market, By end use
          • Architectural
          • Automotive
          • Others
      • UAE
        • UAE Flat Glass Market, By product
          • Basic
          • Tempered
          • Laminated
          • Insulated
          • Others
        • UAE Flat Glass Market, By end use
          • Architectural
          • Automotive
          • Others
      • Iran
        • Iran Flat Glass Market, By product
          • Basic
          • Tempered
          • Laminated
          • Insulated
          • Others
        • Iran Flat Glass Market, By end use
          • Architectural
          • Automotive
          • Others
      • South Africa
        • South Africa Flat Glass Market, By product
          • Basic
          • Tempered
          • Laminated
          • Insulated
          • Others
        • South Africa Flat Glass Market, By end use
          • Architectural
          • Automotive
          • Others

Report content

Qualitative Analysis

  • Industry overview
  • Industry trends
  • Market drivers and restraints
  • Market size
  • Growth prospects
  • Porter’s analysis
  • PESTEL analysis
  • Key market opportunities prioritized
  • Competitive landscape
    • Company overview
    • Financial performance
    • Product benchmarking
    • Latest strategic developments

Quantitative Analysis

  • Market size, estimates, and forecast from 2018 to 2030
  • Market estimates and forecast for product segments up to 2030
  • Regional market size and forecast for product segments up to 2030
  • Market estimates and forecast for application segments up to 2030
  • Regional market size and forecast for application segments up to 2030
  • Company financial performance
What questions do you have? Get quick response from our industry experts. Request a Free Consultation

Research Methodology

Grand View Research employs a comprehensive and iterative research methodology focused on minimizing deviance in order to provide the most accurate estimates and forecast possible. The company utilizes a combination of bottom-up and top-down approaches for segmenting and estimating quantitative aspects of the market. In Addition, a recurring theme prevalent across all our research reports is data triangulation that looks market from three different perspectives. Critical elements of the methodology employed for all our studies include:

Preliminary data mining

Raw market data is obtained and collated on a broad front. Data is continuously filtered to ensure that only validated and authenticated sources are considered. In addition, data is also mined from a host of reports in our repository, as well as a number of reputed paid databases. For a comprehensive understanding of the market, it is essential to understand the complete value chain, and in order to facilitate this; we collect data from raw material suppliers, distributors as well as buyers.

Technical issues and trends are obtained from surveys, technical symposia, and trade journals. Technical data is also gathered from an intellectual property perspective, focusing on white space and freedom of movement. Industry dynamics with respect to drivers, restraints, pricing trends are also gathered. As a result, the material developed contains a wide range of original data that is then further cross-validated and authenticated with published sources.

Statistical model

Our market estimates and forecasts are derived through simulation models. A unique model is created customized for each study. Gathered information for market dynamics, technology landscape, application development, and pricing trends are fed into the model and analyzed simultaneously. These factors are studied on a comparative basis, and their impact over the forecast period is quantified with the help of correlation, regression, and time series analysis. Market forecasting is performed via a combination of economic tools, technological analysis, industry experience, and domain expertise.

Econometric models are generally used for short-term forecasting, while technological market models are used for long-term forecasting. These are based on an amalgamation of the technology landscape, regulatory frameworks, economic outlook, and business principles. A bottom-up approach to market estimation is preferred, with key regional markets analyzed as separate entities and integration of data to obtain global estimates. This is critical for a deep understanding of the industry as well as ensuring minimal errors. Some of the parameters considered for forecasting include:

    • Market drivers and restraints, along with their current and expected impact
    • Raw material scenario and supply v/s price trends
    • Regulatory scenario and expected developments
    • Current capacity and expected capacity additions up to 2030

We assign weights to these parameters and quantify their market impact using weighted average analysis, to derive an expected market growth rate.

Primary validation

This is the final step in estimating and forecasting for our reports. Exhaustive primary interviews are conducted, face to face as well as over the phone to validate our findings and assumptions used to obtain them. Interviewees are approached from leading companies across the value chain including suppliers, technology providers, domain experts, and buyers so as to ensure a holistic and unbiased picture of the market. These interviews are conducted across the globe, with language barriers overcome with the aid of local staff and interpreters. Primary interviews not only help in data validation but also provide critical insights into the market, current business scenario, and future expectations and enhance the quality of our reports. All our estimates and forecast are verified through exhaustive primary research with Key Industry Participants (KIPs) which typically include:

    • Market-leading companies
    • Raw material suppliers
    • Product distributors
    • Buyers

The key objectives of primary research are as follows:

    • To validate our data in terms of accuracy and acceptability
    • To gain an insight in to the current market and future expectations

Data Collection Matrix

Perspective

Primary research

Secondary research

Supply-side

  • Manufacturers
  • Technology distributors and wholesalers
  • Company reports and publications
  • Government publications
  • Independent investigations
  • Economic and demographic data

Demand-side

  • End-user surveys
  • Consumer surveys
  • Mystery shopping
  • Case studies
  • Reference customers


Industry Analysis Matrix

Qualitative analysis

Quantitative analysis

  • Industry landscape and trends
  • Market dynamics and key issues
  • Technology landscape
  • Market opportunities
  • Porter’s analysis and PESTEL analysis
  • Competitive landscape and component benchmarking
  • Policy and regulatory scenario
  • Market revenue estimates and forecast up to 2030
  • Market revenue estimates and forecasts up to 2030, by technology
  • Market revenue estimates and forecasts up to 2030, by application
  • Market revenue estimates and forecasts up to 2030, by type
  • Market revenue estimates and forecasts up to 2030, by component
  • Regional market revenue forecasts, by technology
  • Regional market revenue forecasts, by application
  • Regional market revenue forecasts, by type
  • Regional market revenue forecasts, by component


What questions do you have? Get quick response from our industry experts. Request a Free Consultation
pdf icn

GET A FREE SAMPLE

arrow icn

This FREE sample includes data points, ranging from trend analyses to estimates and forecasts. See for yourself.

gvr icn

NEED A CUSTOM REPORT?

We can customize every report - free of charge - including purchasing stand-alone sections or country-level reports, as well as offer affordable discounts for start-ups & universities. Contact us now

Certified Icon

We are GDPR and CCPA compliant! Your transaction & personal information is safe and secure. For more details, please read our privacy policy.