- Home
- »
- Healthcare IT
- »
-
Electronic Health Records Market Size, Industry Report, 2030GVR Report cover
![Electronic Health Records Market Size, Share & Trends Report]()
Electronic Health Records Market (2025 - 2030) Size, Share & Trends Analysis Report By Product (On-premises, Web & Cloud-Based EHR), By Type (Acute, Outpatient, Post Acute), By Business Model, By Application, By End Use, By Region, And Segment Forecasts
- Report ID: 978-1-68038-394-2
- Number of Report Pages: 150
- Format: PDF
- Historical Range: 2018 - 2024
- Forecast Period: 2025 - 2030
- Industry: Healthcare
- Report Summary
- Table of Contents
- Interactive Charts
- Methodology
- Download FREE Sample
-
Download Sample Report
Electronic Health Records Market Summary
The global electronic health records market size was estimated at USD 33.43 billion in 2024 and is projected to reach USD 43.36 billion by 2030, growing at a CAGR of 4.54% from 2025 to 2030. Government initiatives to encourage healthcare IT usage is a key growth driver.
Key Market Trends & Insights
- The North America segment dominated the market with a revenue share of over 44% in 2024.
- The U.S. electronic health records industry held the largest share in 2024.
- By product, the cloud & web based EHR segment dominated the market with a revenue share of 83.40% in 2024.
- By end use, the hospital segment dominated the market with a revenue share of 52.93% in 2024.
- By business model, the professional services segment dominated the market with a revenue share of 32.34% in 2024.
Market Size & Forecast
- 2024 Market Size: USD 33.43 Billion
- 2030 Projected Market Size: USD 43.36 Billion
- CAGR (2025-2030): 4.54%
- North America: Largest market in 2024
For instance, My Health Record is a national digital health record platform in Australia. Every Australian citizen has a “My Health Record” unless they have chosen not to have one. The agency claims that by the end of 2022, all healthcare providers in the country will be able to contribute to and use healthcare information available on the platform. Moreover, the introduction of technologically advanced healthcare services is also expected to drive the electronic health record (EHR) industry growth. In addition, the integration of artificial intelligence into EHR systems fuels market growth further.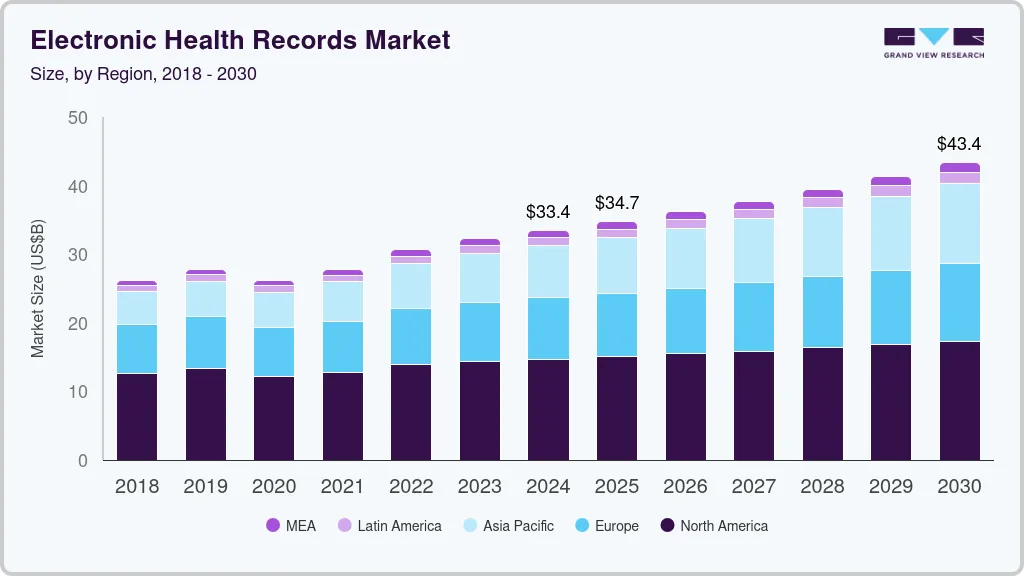
The spread of COVID-19 has put a lot of pressure on healthcare organizations since the beginning of 2020. The pandemic has negatively impacted the revenue of major market players due to a decline in new business bookings as certain client purchasing decisions and projects were delayed to focus on treating patients, procuring necessary medical supplies, and managing their organizations through this crisis. Also, companies such as Allscripts experienced delays in deals with upfront software revenue and professional services implementations across their outpatient and inpatient bases.
New expansion activities, product approvals, product launches, partnerships, and acquisitions have positively impacted the EHR market in post COVID-19 pandemic. Furthermore, there has been a significant increase in the demand for electronic health records due to the growing digitalization, which in turn is fueling the market growth.
Rising demand for centralization & streamlining of healthcare administration is also anticipated to drive the market growth. Centralization of health information management is driven by a value-based model that aims at streamlining operations, standardizing processes, reduction of costs, and improving the quality of care, which results in patient satisfaction. For instance,in March 2022, Google Health collaborated with MEDITECH with an aim to use its search & summarization capabilities within MEDITECH's Expanse EHR platform to help clinicians provide the best care via easy and quick access to information from multiple sources.
Additionally, an increasing number of partnerships & collaborations by market players is also boosting market growth. For instance, in July 2023, NextGen Healthcare announced the expansion of its collaboration with the American Podiatric Medical Association (APMA). As per this collaboration, the ‘NextGen Office’ cloud-based small practice EHR and practice management solution is the sole platform to incorporate blueprints exclusively developed with APMA. These podiatry blueprints address several issues, including diabetes, dermatitis, infection, and injuries.
Integration of Artificial Intelligence in Electronic Health Records
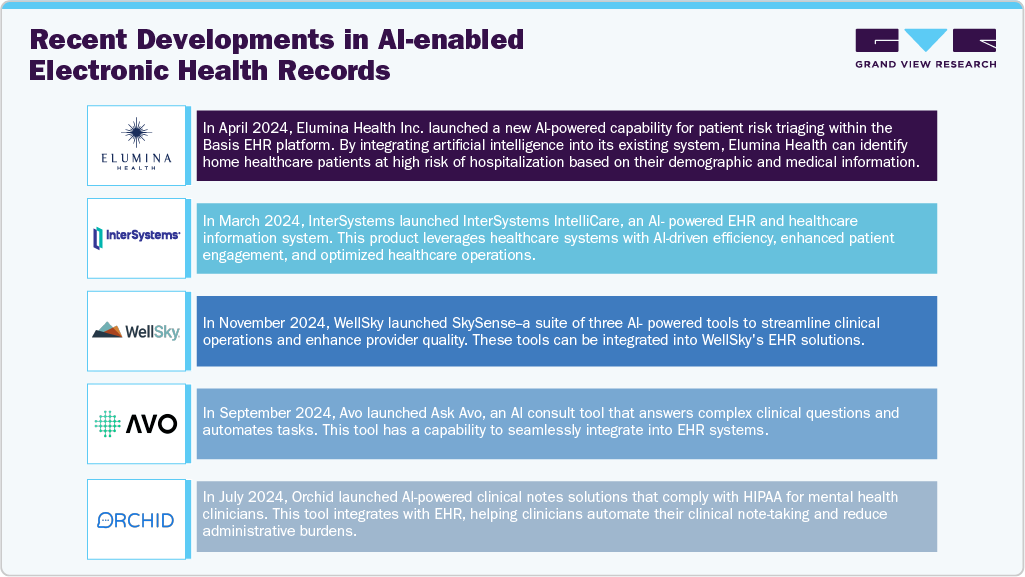
The integration of Artificial Intelligence (AI) into Electronic Health Records (EHR) is transforming the global healthcare landscape, enhancing efficiency, accuracy, and patient outcomes. AI streamlines repetitive administrative functions such as data entry, billing, and coding. This automation reduces human error and allows healthcare professionals to focus more on patient care.
By analyzing vast amounts of patient data, AI provides predictive insights and personalized treatment recommendations, aiding clinicians in making informed decisions. In addition, it facilitates seamless data sharing across different healthcare systems, enhancing collaboration among healthcare providers and ensuring comprehensive patient care.
Furthermore, a significant development in the EHR market is the emergence of AI agents within EHR systems. AI agents transcribe patient-clinician interactions into structured clinical notes in real-time, reducing the documentation burden on healthcare providers. They also assist in scheduling appointments, sending reminders, and providing information, improving patient communication and adherence to care plans.
For instance, Oracle Health has developed a Clinical AI Agent that provides a comprehensive mobile solution to help physicians navigate workflow challenges, supporting time- and cost-efficient operations by combining clinical automation, note generation, integrated dictation, and proposed actions in a unified experience.
"I truly believe that Oracle Health Clinical AI Agent is going to be a game changer for reduction of [the] burden of EHRs, not just for physicians...for all clinicians, and I can't wait to see what's going to happen in this space."
-Tania Tajirian, Chief Health Information Officer, Centre for Addiction and Mental Health
Market Characteristics & Concentration
The chart below illustrates the relationship between industry concentration, industry characteristics, and market participants. The x-axis represents the level of industry concentration, ranging from low to high. The y-axis represents various market characteristics, including industry competition, new product launches, impact of regulations, level of mergers and acquisitions activities, and geographic expansion.
The impact of new product launches is high, owing to the market players in the electronic health records industry launching new products to expand their reach and increase availability in different regions. For instance, in May 2024, Athenahealth launched customizable EHRs for specialty providers such as women's health practices and urgent care centers.
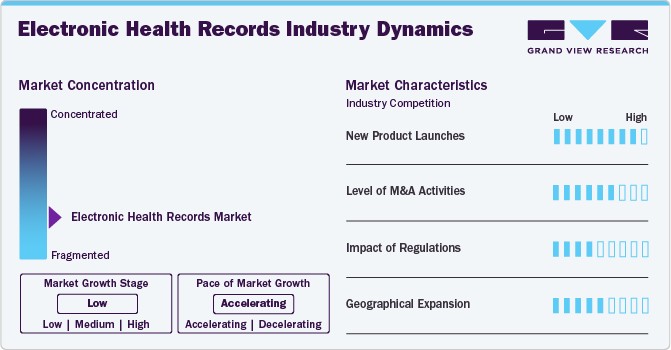
The Impact of mergers and acquisitions on the EHR industry is high. Mergers and acquisitions in the electronic health records (EHR) market are increasing, with several companies acquiring smaller players to strengthen their market position, expand product portfolios, and improve competencies. For instance, in September 2023, Thoma Bravo acquired NextGen Healthcare, Inc., a leading EHR systems manufacturer, to expand its capabilities in the market.
The impact of regulations on the hospital EHR industry is moderate. Regulations for EHR are evolving globally, with strong government support through regulatory reforms favoring market growth. In Europe, government bodies are driving the development and implementation of EHR in healthcare facilities. In the U.S., the HITECH Act established the Medicare and Medicaid EHR Incentive Programs to incentivize healthcare providers to adopt and use certified EHR technology.
The level of geographic expansion in the electronic health records industry is moderate. Several market players are involved in geographical expansion to enhance capabilities and have a direct presence in countries having high demand. For instance, in June 2021, Greenway Health, LLC expanded its geographical presence by opening its new office in Bengaluru, India. The company aims toward rapid product and software execution, revenue growth, and client success through this expansion activity.
Case Study:
SAL Management Group operates 19 assisted living communities across Utah and is dedicated to providing safe, home-like environments with exceptional care experiences. The following case study emphasizes how strategic collaboration and tailored solutions can overcome implementation challenges, enhance operational efficiency, improve resident care, and increase revenue in the assisted living sector.

Product Insights
The cloud & web based EHR segment dominated the market with a revenue share of 83.40% in 2024. It is anticipated to grow at the fastest CAGR during the forecast period, owing to its popularity among physicians and healthcare providers operating on a smaller scale. This is because web-based EHRs can be installed & used without in-house servers and can offer a wide range of improvements & customizations, as per the customer’s needs.
In addition, the low requirement of hardware infrastructure decreases the installation cost. Cloud & web-based EHRs also require less maintenance. Subscription-based web-based EHRs provide integrated operability convenient for small-to-medium-scale medical professionals.
Major EHR vendors are launching new web-based solutions and expanding their services to cater to the growing demand, which is anticipated to boost the segment growth during the forecast period. For instance, in March 2022, MEDITECH expanded the availability of its practice management solution and web-based EHR system, Expanse Ambulatory, to independent & physician-owned practices without the requirement for an Expanse EHR in a hospital setting.
Type Insights
The acute segment dominated the market in 2024 with a revenue share of 45.87%. The growth is attributed to the government initiatives for the adoption of EHRs in small-scale facilities. For instance, acute care hospitals in the U.S., which are covered under the inpatient prospective payment system (IPPS), are eligible for the Medicare incentive payment system.
Ambulatory EHRs are meant for use in outpatient care facilities and small practices. Government support for the adoption of ambulatory EHRs, especially during the COVID-19 pandemic, is expected to boost market growth. Easy usage as compared to the inpatient EHRs is expected to drive the market growth. These EHRs deal with a single practice and its patient, instead of a complex web of hospital departments.
Post-acute EHRs are mainly used for providing rehabilitation services that patients receive after a stay in an acute care hospital. Post-acute care facilities consist of inpatient rehabilitation centers & hospitals, home health agencies, and long-term care hospitals. Rising spending on post-acute care facilities is anticipated to boost the market growth.
Business Model Insights
The professional services segment dominated the market with a revenue share of 32.34% in 2024 and is expected to grow at the fastest CAGR during the forecast period. Professional services help healthcare systems in the implementation of information systems in their organizations. They are usually in the form of project management, technical & application expertise, clinical process optimization, regulatory consulting, and training of end users for designing & implementing EHR systems.
Within the technology resale segment, licensed software is bundled with IPs of other companies in the form of sublicenses for creating complete technology solutions for healthcare systems. Licensed software includes application software, architecture, executable & referential knowledge, and data & algorithms. Other business models include managed services, support & maintenance, and other such services.
Application Insights
The cardiology segment held the largest market share in 2024. The growth of this segment is driven by the increasing incidence of hospitalization of patients diagnosed with cardiovascular diseases, such as coronary heart disease and stroke. Cardiology EHR software seamlessly integrates data from Electrocardiograms (EKGs), echocardiograms, cardiac catheterization, and other diagnostic instruments into the patient's electronic record. This eliminates the time-consuming task of hunting for misplaced studies, enhancing clinical efficiency.
The neurology segment is anticipated to showcase significant growth over the forecast period, owing to the growing adoption of EHR in the neurology segment, include the increasing incidence of neurological diseases and the rising need for high-quality healthcare services. According to the Pan American Health Organization, in 2019, neurological conditions accounted for 47.39 deaths per 100,000 population in the U.S. This is expected to drive the demand for advanced neurology EHR software solutions. Moreover, the widespread adoption of EHR software in the region and continuous technological advancements in healthcare IT solutions, coupled with government efforts to promote digital healthcare, are among the key factors propelling the market growth.
End Use Insights
The hospital segment dominated the market with a revenue share of 52.93% in 2024. Increase in the adoption of EHR in hospitals for improving clinical, financial, & administrative efficiency and the rising need for enhancing information systems in hospitals are some of the key factors expected to drive market growth. The shift from volume-based care to value-based care is leading to an increase in the demand for EHR in hospitals. According to the Office of the National Coordinator for Health Information Technology (ONC), EHR adoption in U.S. hospitals increased from 9% in 2008 to 96% in 2021.
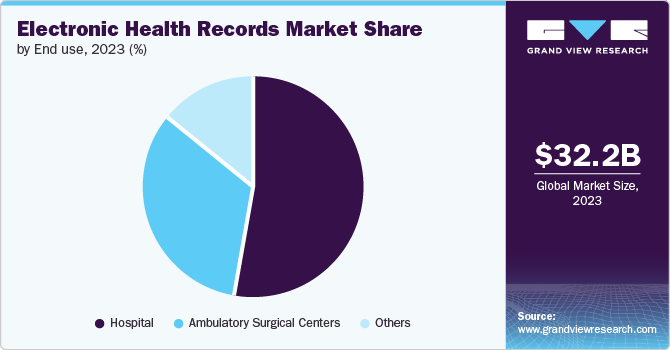
The ambulatory surgery centers segment is anticipated to grow at the fastest CAGR during the forecast period. The ambulatory EHR market is growing due to the need for seamless healthcare information exchange, technological advancements, increased adoption in developed markets, and government initiatives to improve patient health record portals. For instance, in 2021, nearly 87% of acute and ambulatory care facilities adopted enterprise-wide patient flow systems, with high adoption in critical areas, according to an article by the College of Healthcare Information Management Executives.
Regional Insights
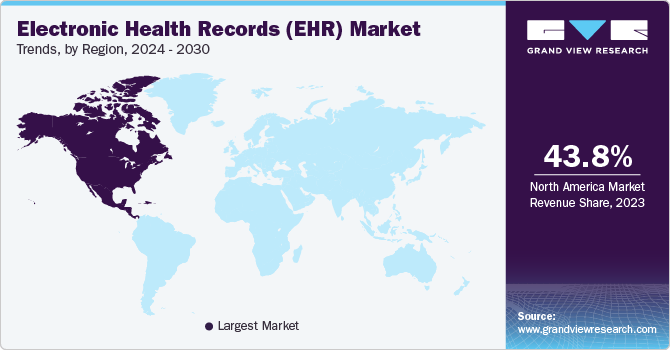
The North America segment dominated the market with a revenue share of over 44% in 2024. The major factor contributing to the growth of this region is the policies that support the adoption of electronic health records & the availability of infrastructure with high digital literacy. Furthermore, favorable government regulations and acts for monitoring the safety of healthcare IT solutions are expected to fuel the electronic health record market in the U.S. For instance, in May 2020, the federal government proposed the Federal Health IT Strategic Plan 2020-2025, which mandates meaningful usage of EHR by healthcare providers.
U.S. Electronic Health Records Market Trends
The U.S. electronic health records industry held the largest share in 2024, due to growing demand for improved healthcare technology, regulatory requirements, and the rising need for interoperability between different EHR systems. Many companies offer EHR systems in the U.S., including large established companies such as Epic Systems, NextGen Healthcare, eClinicalWorks, Cerner Corporation, and Allscripts. These companies compete on factors such as system functionality, ease of use, cost, and customer support.
Europe Electronic Health Records Market Trends
The Europe electronic health records industry is anticipated to grow significantly over the forecast period, due to improving healthcare efficiency and patient outcomes through digital transformation. The presence of developed economies such as Germany, the UK, France, Spain, and Italy is expected to fuel the EHR market in Europe during the forecast period.
The UK electronic health records market is expected to grow at a significant pace over the forecast period, owing to increasing per capita income, rising healthcare costs, and growing prevalence of chronic disorders that increase the need for adoption of analytics services.
The electronic health records market in Germany is anticipated to witness lucrative growth over the forecast period. In Germany, curbing healthcare costs is one of the major factors promoting the adoption of interoperable systems, allowing information sharing through the implementation of healthcare IT systems.
Asia Pacific Hospital Electronic Health Records Market Trends
The Asia Pacific electronic health records industry is anticipated to demonstrate lucrative growth during the forecast period. This growth is attributed to the ever-increasing demand for quality standards & services, which is boosting the digitalization of healthcare in the region. The Ministry of Health in China has defined an action plan for the usage of services related to e-health across the country, encompassing broad areas of medical services, insurance plans, and with a large focus on the adoption of electronic records, systems to allow data sharing across the national healthcare system.
China electronic health records market held the largest share in 2024. Favorable government initiatives are anticipated to increase the demand for electronic health records in the nation. The Ministry of Health in China has defined an action plan for the usage of services related to e-health across the country, encompassing broad areas of medical services, insurance plans, and with a large focus on the adoption of electronic record systems to allow data sharing across the national healthcare system.
The electronic health records market in India is anticipated to grow at the fastest CAGR during the forecast period. The growth is expected to be fuel by favorable government initiatives aimed at increasing demand for electronic health records. For instance, the government of India has implemented various health management programs, including the Ayushman Bharat-Pradhan Mantri Jan Arogya Yojana (PMJAY), declared in the 2020 - 21 budget, which is the largest funded healthcare program in the country.
Latin America Electronic Health Records Market Trends
The Latin America electronic health records industry is anticipated to grow significantly over the forecast period, due to rapid economic growth in these countries is one of the key factors propelling the market growth during the forecast period. Furthermore, increasing the adoption of cloud-based services in healthcare organizations has fueled the market in the region.
Brazil electronic health records market is anticipated to grow significantly, owing to the rising demand among healthcare providers to enhance decision-making through data analytics, and improve patient engagement and satisfaction also contributes to the rising demand for EHR in Brazil.
Middle East & Africa Hospital Electronic Health Records Market Trends
The electronic health records industry in Middle East and Africa is anticipated to grow significantly over the forecast period, due to the growing awareness among people, leading to a rise in the number of hospitals and a rise in government investment in interoperability and AI efforts to better leverage EHRs in hospitals.
South Africa electronic health records marketis anticipated to grow significantly due to increased workload on health caregivers due to the large patient data generated in hospitals or medical centers. Increasing mortality due to noncommunicable diseases is expected to open new opportunities for market players. According to the WHO, noncommunicable diseases accounted for 51% of deaths in 2018 in South Africa. Favorable measures are undertaken to develop the healthcare IT sector in the nation, which is expected to fuel the market growth.
Key Electronic Health Records Company Insights
The market leaders are involved in expansions, product launches, partnerships & collaborations, and mergers & acquisitions to sustain the competition. Established organizations and small players are investing in mergers & acquisitions to gain a competitive edge. For instance, in August 2023, WellSky acquired Experience Care, a technology company offering EHR software solutions for long-term care and post-acute providers. Experience Care's electronic health record platform, NetSolutions, has served 150 long-term care clients with 850 facilities. The acquisition will help providers increase efficiency, improve performance, and advance resident care by turning data into meaningful information.
Key Electronic Health Records Companies:
The following are the leading companies in the electronic health records market. These companies collectively hold the largest market share and dictate industry trends.
- Cerner Corporation (Oracle)
- GE Healthcare
- Veradigm LLC (Allscripts Healthcare, LLC)
- Epic Systems Corporation
- eClinicalWorks
- Greenway Health, LLC
- NextGen Healthcare, Inc.
- Medical Information Technology, Inc. (Meditech)
- CPSI
- AdvancedMD, Inc.
- CureMD Healthcare
- McKesson Corporation
Recent Developments
-
In November 2024, CarolinaEast launched the Epic Electronic Health Record System to enhance care delivery in the U.S.
“November 30, 2024, marks CarolinaEast Health System’s most significant technological step forward in our 61-year history. Transitioning to Epic electronic health record will allow patients to move seamlessly across our entire system, as well as the country. I also look forward to bringing Epic to everyone in our medical community to provide the same experience for all patients in the region.”
-Michael Smith, President and Chief Executive Officer, CarolinaEast Health System
-
In October 2024, Athenahealth launched athenaOne, a comprehensive EHR, revenue, practice management, and patient engagement solution for orthopedics.
-
In June 2023, CPSI and the MidCoast Health System expanded their four-year partnership through the implementation of CPSI’s EHR, accounts receivables services, and IT-managed services at the Crockett Medical Center’s critical access hospital in Texas. Other MidCoast Health System hospitals to successfully implement CPSI healthcare solutions in recent years include the El Campo Memorial Hospital and the Palacios Community Medical Center, among others.
-
In May 2023, MEDITECH announced an agreement with Canada Health Infoway to connect with the latter’s e-prescribing service, ‘PrescribeIT’. This agreement would allow prescribers in Canada to electronically transmit a prescription directly from MEDITECH’s Expanse EHR to the patient’s preferred choice of pharmacy. The functionality would allow the ease of creation of new prescriptions, allow existing prescription renewals, and also cancel prescription requests.
-
In April 2023, Microsoft announced an expansion of its strategic partnership with Epic for the development and integration of generative AI into healthcare, through the combination of Epic’s advanced electronic health record software and the scale of Microsoft’s Azure OpenAI Service. The resulting generative AI solutions would help enhance patient care, increase productivity, and improve the financial integrity of health systems worldwide.
-
In February 2023, King’s College Hospital London - Dubai announced a strategic partnership with Oracle Cerner to accelerate innovation through the utilization of Oracle Cloud Infrastructure (OCI) services via the Oracle Cloud Dubai Region for operating and managing the upgraded and enhanced electronic medical records system for KCH Dubai.
-
In February 2023, Oracle Cerner announced that the province of Nova Scotia, in partnership with Nova Scotia Health Authority (NSHA) and IWK Health (IWK), had signed a 10-year agreement for implementing an integrated electronic care record in the entire province. Known in Nova Scotia as “One Person One Record”, it is intended to provide clinicians easier access to real-time health information and allow healthcare workers to spend more time with their patients.
-
In January 2023, Veradigm (formerly Allscripts) announced that the Veradigm Network EHR Data would be available within the OMOP CDM format. Veradigm Network EHR is a complete, statistically de-identified dataset with three integrated EHR sources. This transformation is expected to facilitate data sales for clients who require it to be delivered in OMOP format.
-
In January 2022, Health Information Management Systems launched AxiaGram, a mobile communication care app, which can seamlessly work with an existing EHR platform. The company expanded its product portfolio with this.
-
In May 2022, CPSI entered into a partnership agreement with Medicomp Systems to launch Quippe Clinical Lens. The new technology aims to empower EHR users with proper access to clinical information at PoC.
-
In January 2021, Allscripts Healthcare Solutions announced a strategic partnership with the U.S Orthopedic Alliance (USOA). This partnership is aimed at bringing efficient infrastructure designed to assist orthopedic practices scale with agility, improving EHR implementation timelines, providing evidence-based guidelines to support evolving clinical protocols, and creating community-wide connectivity with value-based care analytics.
Electronic Health Records Market Report Scope
Report Attribute
Details
Market size value in 2025
USD 34.73 billion
Revenue forecast in 2030
USD 43.36 billion
Growth rate
CAGR of 4.54% from 2025 to 2030
Actual data
2018 - 2024
Forecast period
2025 - 2030
Quantitative units
Revenue in USD million/billion and CAGR from 2025 to 2030
Report coverage
Revenue forecast, company ranking, competitive landscape, growth factors, and trends
Segments covered
Product, business model, type, application, end use, region
Regional scope
North America; Europe; Asia Pacific; Latin America; MEA
Country scope
U.S.; Canada; Mexico; Germany; UK; France; Italy; Spain; Norway; Denmark; Sweden; China; Japan; India; South Korea; Australia; Thailand; Brazil; Argentina; Saudi Arabia; South Africa; UAE; Kuwait
Key companies profiled
Cerner Corporation (Oracle); GE Healthcare; Veradigm LLC (Allscripts Healthcare, LLC); Epic Systems Corporation; eClinicalWorks; Greenway Health, LLC; NextGen Healthcare, Inc.; Medical Information Technology, Inc. (Meditech); CPSI; AdvancedMD, Inc.; CureMD Healthcare; McKesson Corporation
Customization scope
Free report customization (equivalent up to 8 analysts working days) with purchase. Addition or alteration to country, regional & segment scope.
Pricing and purchase options
Avail customized purchase options to meet your exact research needs. Explore purchase options
Global Electronic Health Records Market Report Segmentation
This report forecasts revenue growth at the global, regional, and country levels and provides an analysis of the latest industry trends in each of the sub-segments from 2018 to 2030. For this study, Grand View Research has segmented the global electronic health records market report based on product, type, business model, end use, and region:
-
Product Outlook (Revenue, USD Million, 2018 - 2030)
-
On-premises
-
Web & Cloud-Based EHR
-
-
Type Outlook (Revenue, USD Million, 2018 - 2030)
-
Acute
-
Outpatient
-
Post Acute
-
-
Business Model Outlook (Revenue, USD Million, 2018 - 2030)
-
Licensed Software
-
Technology Resale
-
Subscriptions
-
Professional Services
-
Others
-
-
Application Outlook (Revenue, USD Million, 2018 - 2030)
-
Cardiology
-
Neurology
-
Radiology
-
Oncology
-
Mental and Behavioral Health
-
Ophthalmology
-
Nephrology and Urology
-
Gastroenterology
-
Pediatrics
-
General Medicine
-
Physical Therapy and Rehabilitation
-
Others
-
-
End Use Outlook (Revenue, USD Million, 2018 - 2030)
-
Hospital
-
Ambulatory Surgical Centers
-
Other End Use
-
-
Regional Outlook (Revenue, USD Million, 2018 - 2030)
-
North America
-
U.S.
-
Canada
-
Mexico
-
-
Europe
-
UK
-
Germany
-
France
-
Italy
-
Spain
-
Denmark
-
Sweden
-
Norway
-
-
Asia Pacific
-
China
-
Japan
-
India
-
South Korea
-
Australia
-
Thailand
-
-
Latin America
-
Brazil
-
Argentina
-
-
Middle East and Africa (MEA)
-
South Africa
-
Saudi Arabia
-
UAE
-
Kuwait
-
-
Frequently Asked Questions About This Report
b. The global electronic health records market size was estimated at USD 33.43 billion in 2024 and is expected to reach USD 34.73 billion in 2025.
b. The global electronic health records market is expected to grow at a compound annual growth rate of 4.54% from 2025 to 2030 to reach USD 43.36 billion by 2030.
b. Cloud & web-based EHR segment dominated the market with a revenue share of 83.40% in 2024 and is anticipated to grow at the fastest rate during the forecast period, owing to its popularity among physicians and healthcare providers, which operate on a smaller scale.
b. Acute segment dominated the market in 2024 with a revenue share of 45.87%. The growth is attributed to the government initiatives for the adoption of EHRs in small-scale facilities.
b. Key players operating in the EHR market include Oracle, GE Healthcare, Veradigm LLC (Allscripts Healthcare, LLC), Epic Systems Corporation, eClinicalWorks, Greenway Health, LLC, NextGen Healthcare, Inc., Medical Information Technology, Inc. (Meditech), CPSI, AdvancedMD, Inc., CureMD Healthcare, McKesson Corporation
Share this report with your colleague or friend.
Need a Tailored Report?
Customize this report to your needs — add regions, segments, or data points, with 20% free customization.

ISO 9001:2015 & 27001:2022 Certified
We are GDPR and CCPA compliant! Your transaction & personal information is safe and secure. For more details, please read our privacy policy.
Trusted market insights - try a free sample
See how our reports are structured and why industry leaders rely on Grand View Research. Get a free sample or ask us to tailor this report to your needs.


