- Home
- »
- Automotive & Transportation
- »
-
EV Charging Infrastructure Market Size & Share Report 2030GVR Report cover
![Electric Vehicle (EV) Charging Infrastructure Market Size, Share & Trends Report]()
Electric Vehicle (EV) Charging Infrastructure Market Size, Share & Trends Analysis Report By Charger Type, By Connector, By Level Of Charging, By Connectivity, By Application, By Region, And Segment Forecasts, 2024 - 2030
- Report ID: GVR-1-68038-458-1
- Number of Report Pages: 160
- Format: PDF, Horizon Databook
- Historical Range: 2017 - 2023
- Forecast Period: 2024 - 2030
- Industry: Technology
EV Charging Infrastructure Market Trends
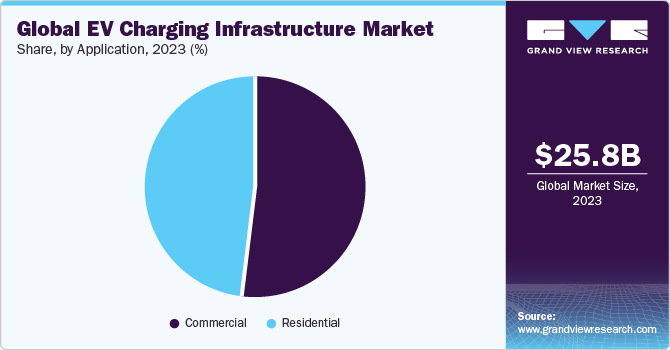
The global electric vehicle (EV) charging infrastructure market size was valued at USD 25.83 billion in 2023 and is projected to grow at a compound annual growth rate (CAGR) of 25.4% from 2024 to 2030. Growing concerns over carbon emissions and growing adoption of electric vehicles (EVs) across the globe are major factors behind the growth of the electric vehicle charging infrastructure market. Government regulations and tax exemptions further promote the adoption of EVs, thus driving the demand for EV charging infrastructure solutions.

In addition, factors such as rapid technological advancements in battery technology and decreasing cost of lithium-ion battery are expected to contribute to the growth of the market during the forecast period. In recent years, EVs have gained significant popularity, notably driven by increasing environmental awareness and a focus on sustainability.
As the adoption of EVs continues to expand, governments globally are implementing regulations aimed at supporting industry growth, thereby contributing to the EV charging infrastructure market. For instance, the US Federal Government provides a tax credit of up to USD 7,500 for qualifying EVs. In addition, in Canada, the government aims to achieve a target where all light-duty vehicles sold are zero-emission by 2040. Such government initiatives to promote EV adoption are expected to boost market growth.
Developments in battery and charging technology are poised to transform the global automotive sector. Enhanced battery technology has extended the travel range of electric vehicles per charge, while new chargers can now recharge batteries at faster rates, attracting greater consumer interest in electric vehicles. This surge in demand is fueling the need for electric vehicle charging stations. Additionally, the increasing focus on autonomous and shared mobility is expected to drive further adoption of electric vehicles, positively impacting the market for electric vehicle charging infrastructure.
Numerous providers of electric vehicles charging infrastructure are focusing on developing new products that provide customers with better charging infrastructure. For instance, in January 2023, Leviton Manufacturing Co., Inc. announced plans to introduce EV Series charging stations compatible with the My Leviton application. The series comprises Level 2 charging stations with 32-, 48-, and 80-amp capacities, capable of charging any electric vehicle model in North America. This underscores Leviton Manufacturing’s commitment to providing advanced EV charging solutions to meet the demand for electric mobility.
Despite the rising popularity of electric vehicles and EV charging infrastructure, there are some challenges that could hamper market growth. High initial cost of installing EV charging infrastructure, lack of dedicated charging space, and fluctuating power tariffs are major challenges in the EV charging infrastructure market. There are several costs associated with charging infrastructure, including installation costs, operational costs, and maintenance costs. Furthermore, other tasks, such as project management, feasibility analysis, and consultancy, incur additional costs. Thus, high costs involved in rolling out the infrastructure can potentially hinder market growth.
Market Concentration & Characteristics
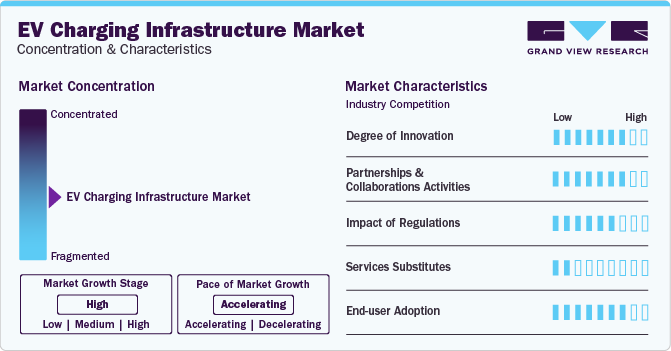
The market growth stage is high, and the pace of the market growth is accelerating. The electric vehicle charging infrastructure market can be characterized by a high degree of innovation with rapidly evolving technological advances. Technological advancements, such as improvements in charging infrastructure and battery technology, are making electric vehicles more convenient and practical for everyday use.

The electric vehicle charging infrastructure market is also characterized by a high level of partnerships and collaboration activities by the leading players. Various leading players are partnering with EV vehicle manufacturers to provide charging solutions and strengthen their market position across the world.
Countries worldwide are enacting regulations and offering incentives to encourage the adoption of EVs. The European Union, China, and Norway are among the countries that leading the world in the adoption of EVs. In addition, Canada and France have set targets to phase out the sale of diesel and petrol vehicles by 2040.
There are no direct substitutes for electric vehicle charging infrastructure. Moreover, the market is relatively new and is in the growth phase. However, with the rapidly increasing demand for electric vehicles and technological advancement, there are chances of fuel cell technology emerging as a substitute source of power.
End-use concentration is high in the electric vehicle charging infrastructure market. Increasing deployment of electric vehicle charging infrastructure in applications such as garages of independent homes, residential complex parking lots, public parking lots, corporate establishments, and public places, such as malls and retail outlets is attributed to the growth of this market.
Charger Type Insights
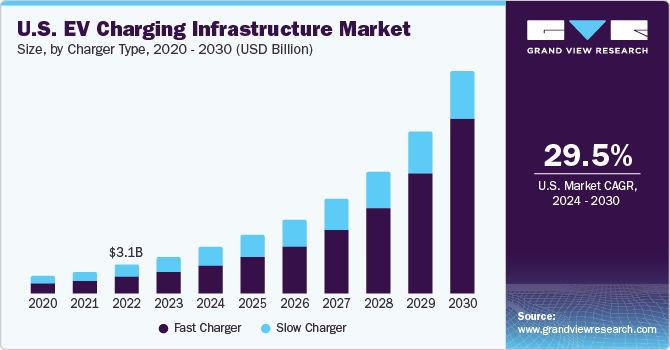
The fast charger segment led the market and accounted for 72.4% of the global revenue in 2023. This segment is also anticipated to grow at the highest CAGR during the forecast period. This growth is attributed to the increasing initiatives by various governments for accelerating the deployment of public fast-charging infrastructure. Most organizations have deployed Level 3 DC fast chargers or Level 2 AC charging stations that can fully charge an electric vehicle between 30 minutes and 4 hours.
Besides, automotive manufacturers are emphasizing the installation of electric vehicle charging stations for their employees as part of the efforts to increase the awareness about their electric cars and electric cars public charging stations. For instance, the installation of 100 Level 2 electric vehicle charging stations at the parking lots of General Motors Company’s Detroit facility has led to an increase in demand for the company’s Chevrolet Volt cars from employees.
Demand for slow chargers is expected to grow at a significant CAGR during the forecast period. Slow chargers are most commonly adopted by residential applications, which are used for overnight charging. Furthermore, most electric vehicle’s manufacturers such as BMW, General Motors, and Volkswagen Group offer slow chargers along with the purchase of electric vehicles, which is further fueling segment growth. For instance, General Motors offers a slow charger with the purchase of its electric car model.
Connector Insights
The others segment accounted for the largest market revenue share in 2023. This segment includes connectors such as GB/T, Mennekes, J1772, and others. The dominance of this segment can be attributed to the high adoption of GB/T connectors in China. The official EV plug standard in China is GB/T connector, which is used by all the EV chargers. High sales of EVs followed by the strong presence of EV charging infrastructure in China is anticipated to fuel segment growth. According to Grand View Research analysis, in 2022, there were 7,082,307 EV chargers in China.
Meanwhile, CCS connector is expected to register the fastest CAGR during the forecast period, owing to increased preference by major automobile manufactures on the adoption of CCS connectors in their electric vehicles. For instance, in July 2019, Tesla announced the introduction of a CCS connector to support Model 3, with expected future compatibility with Model S and Model X in Europe.
Furthermore, CCS connectors are available in two types, usually denoted as CCS Type1 and CCS Type 2. CCS Type 1 connectors are extensively utilized in the U.S., while CCS Type 2 connectors are utilized in Europe. Moreover, the support from major auto manufacturers and OEMs, including Daimler AG, Ford Motor Company, General Motor Company, and Volkswagen Group, is expected to drive the demand for CCS segment during the forecast period.
Level of Charging Insights
Level 2 charging led the market in 2023. This charging is in the range of 208 volts to 240 volts, and is suitable for locations such as houses, workplaces, and public charging stations. Since level 2 charging infrastructure is easy to install, it is the most commonly used level of charging for electric vehicles as of 2022. Level 2 charging can add anywhere from 12 to 80 miles of range per hour, depending upon the vehicle's maximum charge rate and the power output of the level 2 charger.
Due to this charging time and convenience of installation, level 2 chargers are mostly seen installed in urban areas, which is where EVs are currently the most popular. Level 2 chargers are able to charge electric vehicles up to 10 times quicker than level 1 charging, contributing to the dominating share of this segment in 2023.
Level 3 charging is expected to register the fastest CAGR during the forecast period, owing to its fast-charging abilities. Level 3 chargers, the quickest charging option, have the capability to charge electric vehicles at a rate ranging from 3 to 20 miles per minute by using direct current. The voltage used by level 3 chargers is higher than level 1 and level 2, which is why is not seen installed at residential places as of now. However, as the number of EV users grows, companies and public spaces will implement such charging infrastructure, in order to fulfill the large demand. This in turn, is expected to drive the growth of the level 3 charging level segment during the forecast period.
Connectivity Insights
The non-connected charging stations segment accounted for the largest market revenue share in 2023. Non-connected charging solutions are also known as non-networked or standalone charging solutions. Non-connected charging solutions offer users safe and secure charging without the hassle of recurring fees of a charging network. Non-connected charging solutions mimic the experience of the traditional fuel pump and allow consumers to pay for charging facilities peruse.
Some non-connected charging solutions couple their hardware with software platforms to monitor the health of their chargers and view detailed diagnostic data. Moreover, non-connected chargers have lower ongoing and installation costs, as other recurring networking and activation fees are not applicable. The low infrastructure costs for owners and hassle-free charging experience for EV users provided by non-connected charging solutions are expected to contribute to segment growth during the forecast period.
The connected charging stations segment is expected to register the fastest CAGR during the forecast period. Connected charging solutions, also referred to as a network charger is a charging network, which is managed with network software systems. With connected charging solutions, electric vehicles are equipped with capabilities beneficial for drivers and hosts.
For instance, site hosts can access network access facilities such as advanced analytics, energy management, remote management features, and 24/7 customer support, while drivers can access it to locate and reserve via applications, among other use cases. As the number of electric vehicle drivers increases in the next few years, these features will become essential, which is expected to drive the adoption of connected charging solutions in the forecast period.
Application Insights
Commercial application led the market in 2023. The segment is further divided into fleet charging stations, destination charging stations, bus charging stations, highway charging stations, and other charging stations. The dominant share of this segment is owing to initiatives and allocation of funding by governments and automobile manufacturers for expanding public EVCI. Additionally, establishing supporting infrastructure at public locations for EV charging is essential because relying solely on overnight or home charging wouldn't be adequate for long-distance travel.
Furthermore, various public transport agencies are collaborating with automotive manufacturers for the installation of charging stations for electric buses that is driving the growth of this segment. For instance, in September 2022, bp pulse collaborated with The Hertz Corporation, an American car rental company, to install a network of its EV charging solutions powered by bp pulse, across North America, for The Hertz Corporation and its customers.

The residential segment is anticipated to expand at a steady CAGR over the forecast period. The segment is further bifurcated into private houses and apartments/societies. Vehicle charger manufacturers are now focusing on the development of residential EV chargers to ensure higher availability and increased vehicle range. OEMs are partnering with charging network operators, EV manufacturers, utility service providers, and corporates to deploy fast-charging stations to increase their geographical presence and to enable cost-effective deployment of the EV charging network.
Regional Insights
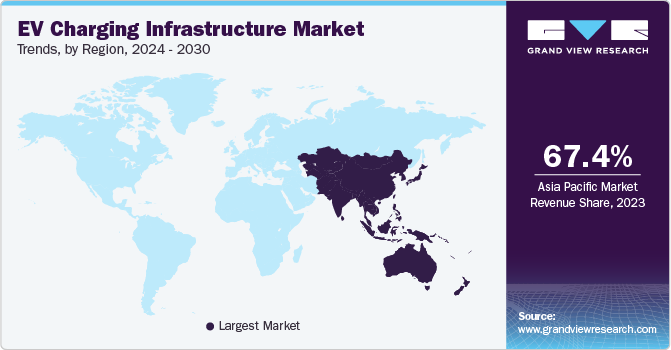
Asia Pacific dominated the market and accounted for a 67.4% revenue share in 2023. Countries such as China, Japan, and South Korea, known as hubs of electric vehicles, are heavily investing in the development of charging infrastructure. For instance, in January 2022, the Chinese Government announced its intention to invest in the deployment of EV infrastructure to achieve its target of supporting 20 million EVs on-road by 2025.

Moreover, South Korea has declared an investment of approximately USD 180.3 million to expand the EV charging infrastructure nationwide, as part of its initiative to encourage eco-friendly vehicles in the transportation sector. Furthermore, in 2020, Japan's electric charging stations exceeded the number of petrol stations, with the country boasting over 40,000 charging outlets. Such factors contribute to the growth of the Asia Pacific EV charging infrastructure market.
Europe is anticipated to witness significant growth in this market. Several European countries have set ambitious goals for reducing carbon emission and electric car stock commitments by 2020. For instance, in July 2018, the U.K. government passed the Automated and Electric Vehicles (AEV) Act. It provides the government with new powers to ensure rapid development of EVCI on motorways and fuel stations. Other European countries, such as France, the U.K, Germany, and Belgium, are also focusing on developing electric vehicle charging and support infrastructure to enable interoperability across different EVs throughout the region, thereby contributing to the growth of the Europe EV charging infrastructure market.
Key Companies & Market Share Insights
Some key players operating in this market include ChargePoint, Inc., Tesla. Inc., ABB Ltd., and bp pulse.
-
ChargePoint, Inc. has delivered over 87 million charging sessions to date and has a customer base of over 4,000 commercial and fleet clients. The company has been undertaking various strategic initiatives to expand its presence in Europe. The company’s acquisition of General Electric’s EV charging network business is expected to add around 8,000 residential and 1,800 commercial charging points to its existing network.
-
ABB Ltd. is leading the charge in product development and business expansion initiatives. The company is expanding its U.S. manufacturing operations to better serve its customers and help advance the adoption of electric vehicles from private vehicles to transit fleets and buses.
Leviton Manufacturing Co., Inc., Blink Charging Co., Eaton Corporation plc, Schneider Electric, Webasto Group, Siemens, Broadband TelCom Power, Inc., Delta Electronics, Inc., and Tritium DCFC Limited are some emerging market participants in the electric vehicle charging infrastructure market.
-
Leviton Manufacturing Co., Inc. provides EV chargers as well as total EV electrical infrastructure, including load center, surge protection, safety disconnects, metering, and more. The company provides multiple solutions for commercial, residential, and public plug-in electric vehicle charging options.
-
Webasto Group is a German company engaged in the manufacture of sunroofs, electric-car chargers, and air-conditioning systems. In June 2018, Webasto Group acquired the EV charging business division of AeroVironment Incorporation, a vehicle manufacturer. The acquisition was aimed to strengthen Webasto Group’s battery systems and plug-in electric vehicle charging business in the U.S. and retain its position as a global systems provider to major automotive OEMs.
Key EV Charging Infrastructure Companies:
- ABB Ltd.
- ChargePoint, Inc.
- Leviton Manufacturing Co., Inc.
- Blink Charging Co.
- Tesla Inc.
- Webasto Group
- bp pulse
- Eaton Corporation plc
- Schneider Electric, Inc.
- Siemens
- BTC Power
- Delta Electronics, Inc.
- Tritium DCFC Limited
Recent Developments:
-
In April 2023, ABB Ltd.’s ABB E-mobility business signed a Memorandum of Understanding (MoU) with PLN Icon Plus, a subsidiary of PT PLN Persero, to facilitate a partnership for developing the EV charging infrastructure in Indonesia
-
In February 2023, ChargePoint Holdings, Inc. and Fisker, Inc., an automobile company, announced an agreement to improve the driving experience of Fisker Ocean drivers. The partnership aims to ensure that Fisker Ocean drivers can access charging facilities conveniently and seamlessly
-
In February 2023, bp pulse unveiled plans to invest USD 1 billion in the development of electric vehicle (EV) charging stations in the U.S. by 2030, with a significant aspect of the investment dedicated to collaborating with The Hertz Corporation on the construction of fast-charging infrastructure at The Hertz Corporation’s facilities in prominent cities such as Austin, Atlanta, Boston, Denver, Chicago, New York City, Houston, Miami, San Francisco, and Washington, DC
Electric Vehicle (EV) Charging Infrastructure Market Report Scope
Report Attribute
Details
Market size value in 2024
USD 32.26 billion
Revenue forecast in 2030
USD 125.39 billion
Growth rate
CAGR of 25.4% from 2024 to 2030
Actual Data
2017 - 2023
Forecast period
2024 - 2030
Quantitative units
Revenue in USD million/billion, volume in unit, and CAGR from 2024 to 2030
Report coverage
Revenue forecast, company market share, competitive landscape, growth factors, and trends
Segments covered
Charger type, charging type, installation type, connector, level of charging, connectivity, operation, deployment, application, region
Regional scope
North America; Europe; Asia Pacific; Latin America; Middle East & Africa
Country scope
U.S.; Canada; Netherlands; U.K.; Germany; France; Norway; China; Japan; India; South Korea; Brazil; Mexico; Kingdom of Saudi Arabia; South Africa; UAE
Key companies profiled
ABB Ltd.; ChargePoint, Inc.; Leviton Manufacturing Co., Inc.; Blink Charging Co.; Tesla Inc.; Webasto Group; bp pulse; Eaton Corporation plc; Schneider Electric, Inc.; Siemens; BTC Power; Delta Electronics, Inc.; Tritium DCFC Limited
Customization scope
Free report customization (equivalent to up to 8 analysts working days) with purchase. Addition or alteration to country, regional, and segment scope
Pricing and purchase options
Avail customized purchase options to meet your exact research needs. Explore purchase options
Global EV Charging Infrastructure Market Report Segmentation
This report forecasts revenue growth at the global, regional, and country levels and provides an analysis of the latest industry trends in each of the sub-segments from 2017 to 2030. For this study, Grand View Research has segmented the global electric vehicle (EV) charging infrastructure market report based on charger type, charging type, installation type, connector, level of charging, connectivity, operation, deployment, application, and region:
-
Charger Type Outlook (Revenue, USD Million; Volume, Units, 2017 - 2030)
-
Slow Charger
-
Fast Charger
-
-
Charging Type Outlook (Revenue, USD Million; Volume, Units, 2017 - 2030)
-
AC
-
DC
-
-
Installation Type Outlook (Revenue, USD Million; Volume, Units, 2017 - 2030)
-
Fixed
-
Portable
-
-
ConnectorOutlook (Revenue, USD Million; Volume, Units, 2017 - 2030)
-
CHAdeMO
-
CCS
-
Others
-
-
Level of Charging Outlook (Revenue, USD Million; Volume, Units, 2017 - 2030)
-
Level 1
-
Level 2
-
Level 3
-
-
Connectivity Outlook (Revenue, USD Million; Volume, Units, 2017 - 2030)
-
Non-connected Charging Stations
-
Connected Charging Stations
-
-
Operation Outlook (Revenue, USD Million; Volume, Units, 2017 - 2030)
-
Mode 1
-
Mode 2
-
Mode 3
-
Mode 4
-
-
Deployment Outlook (Revenue, USD Million; Volume, Units, 2017 - 2030)
-
Private
-
Semi-Public
-
Public
-
-
Application Outlook (Revenue, USD Million; Volume, Units, 2017 - 2030)
-
Commercial
-
Destination Charging Stations
-
Highway Charging Stations
-
Bus Charging Stations
-
Fleet Charging Stations
-
Other Charging Stations
-
-
Residential
-
Private Houses
-
Apartments/Societies
-
-
-
Regional Outlook (Revenue, USD Million; Volume, Units, 2017 - 2030)
-
North America
-
U.S.
-
Canada
-
-
Europe
-
Netherlands
-
U.K.
-
France
-
Norway
-
Germany
-
-
Asia Pacific
-
China
-
Japan
-
India
-
South Korea
-
-
Latin America
-
Brazil
-
Mexico
-
-
Middle East & Africa
-
Kingdom of Saudi Arabia
-
UAE
-
South Africa
-
-
Frequently Asked Questions About This Report
b. The global electric vehicle (EV) charging infrastructure market size was estimated at USD 25.83 billion in 2023 and is expected to reach USD 32.26 billion in 2024.
b. The global electric vehicle (EV) charging infrastructure market is expected to grow at a compound annual growth rate of 25.4% from 2024 to 2030 to reach USD 125.39 billion by 2030.
b. Asia Pacific dominated the EV charging infrastructure market with a share of 67.4% in 2023. This is attributable to governments in various countries such as China, Japan, and South Korea heavily investing in the development of charging infrastructure.
b. Some key players operating in the EV charging infrastructure market include AeroVironment Inc.; ABB; BP Chargemaster; ChargePoint, Inc.; ClipperCreek; Eaton; General Electric; Leviton Manufacturing Co., Inc.; SemaConnect, Inc., Schneider Electric; Siemens; Tesla, Inc.; and Webasto.
b. Key factors driving the electric vehicle charging infrastructure market growth include the rising focus of government agencies on providing funds to Original Equipment Manufacturers (OEMs) for the development of charging stations..
Share this report with your colleague or friend.
![gvr icn]()
NEED A CUSTOM REPORT?
We can customize every report - free of charge - including purchasing stand-alone sections or country-level reports, as well as offer affordable discounts for start-ups & universities. Contact us now
![Certified Icon]()
We are GDPR and CCPA compliant! Your transaction & personal information is safe and secure. For more details, please read our privacy policy.
We are committed towards customer satisfaction, and quality service.
"The quality of research they have done for us has been excellent."


