The global chemical distribution market size was estimated at USD 268.9 billion in 2024 and is anticipated to grow at a CAGR of 7.3% from 2025 to 2030. The demand for products is projected to be driven by rising chemical consumption in various end-use industries, including construction, pharmaceuticals, polymers & resins, and plastics. Essential raw materials are produced and supplied by the chemical industry to businesses in the manufacturing and industrial sectors. These raw materials are sold directly by producers or distributed to end users by outside distributors. Due to outsourcing value-added services like logistics, packaging, blending, waste removal, inventory management, and technical training, the distribution of commodity and specialty chemicals by third parties is predicted to grow significantly more than selling products directly to end users.
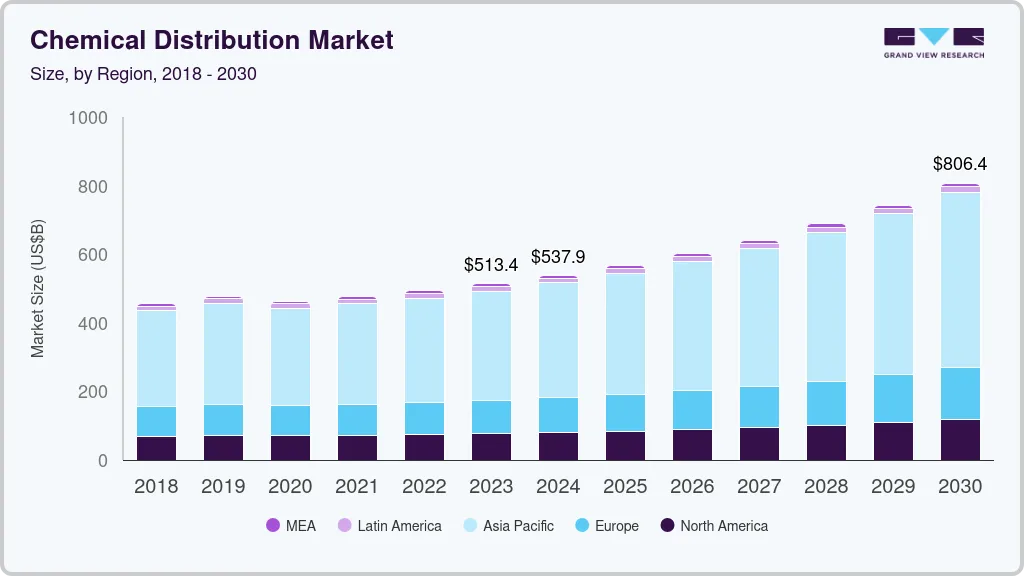
Transporting and storing products in bulk and packaged form is known as chemical distribution. Sacks, barrels, containers, and pipelines are frequently used to disperse them. The chemical business creates a variety of chemicals such as raw materials for oil and petroleum, cosmetics, food, textile, paint, building construction, and agricultural industries. Distributors worldwide offer a range of specialty and common chemicals.
The market services provide a crucial link for producers to connect with smaller clients in less developed areas. The chemical distributors' assistance aids the growth of the global chemical industry in assisting chemical producers in entering new markets. Today, emerging markets like those in the Asia Pacific, the Middle East, Latin America, and Africa are crucial because the chemical industry may grow tremendously in these areas. This sector also makes significant contributions to both developed and developing markets.
Commodity chemicals accounted for the largest revenue share of 63.7% in 2024. As economies expand, there is an increased demand for products that rely on commodity chemicals, such as plastics, fertilizers, and solvents. Industries such as automotive, construction, and agriculture heavily depend on these chemicals for manufacturing. For instance, the rise in construction activities leads to higher demand for polymers and resins used in building materials. This correlation between economic activity and product consumption underscores the importance of macroeconomic indicators in forecasting demand within this segment.
The specialty chemicals segment is anticipated to register the fastest growth with a CAGR of 7.9% worldwide during the forecast period. Specialty chemicals are high-value, low-volume products that serve various industries, from automotive to agriculture to pharmaceuticals. Unlike commodity chemicals, specialty chemicals are often tailored to meet specific needs and provide enhanced functionality. As industries continue to emphasize product quality, sustainability, and innovation, the demand for these specialized chemicals is surging, thus contributing significantly to the segment's growth.
The industrial manufacturing accounted for the largest revenue share of 23.2% in 2024. As industries such as automotive, aerospace, electronics, and machinery continue to expand, the demand for specialized chemicals used in the production of advanced materials, coatings, lubricants, adhesives, and composites has risen significantly. This growth is underpinned by increasing industrialization in emerging economies, where rapid urbanization and infrastructure development are boosting the need for industrial goods.
Downstream chemicals are expected to grow at a CAGR of 7.3% over the forecast period. The increasing demand for materials such as resins, plastics, and coatings, essential for manufacturing a wide range of consumer goods and industrial products, plays a pivotal role in expanding the market for downstream chemicals. As global urbanization continues to rise, particularly in developing regions, the demand for infrastructure and consumer products drives the need for commodity chemicals.
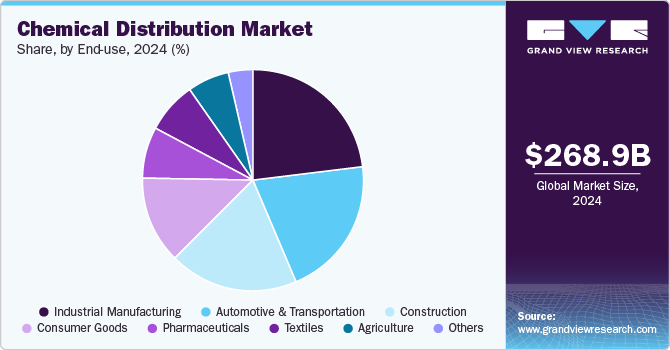
In addition, the pharmaceuticals segment is anticipated to register the fastest CAGR over the forecast period. Specialty chemicals are pivotal in producing active pharmaceutical ingredients (APIs), excipients, and formulations that meet strict regulatory standards. As healthcare systems worldwide continue to modernize and expand, pharmaceutical companies are under pressure to develop more sophisticated, effective, and safer drugs, fueling the demand for specialty chemicals tailored to these needs.
The industrial manufacturing is anticipated to grow significantly over the forecast period. Industrial manufacturing relies heavily on commodity chemicals such as solvents, lubricants, adhesives, and coatings for various applications, making it an essential sector in the overall chemicals distribution market. As industries worldwide ramp up production to meet consumer and business demands, the need for consistent and affordable supplies of chemicals has led to sustained growth in the sector.
North America chemical distribution market held a substantial market revenue share in 2024. As North American industries continue to innovate and modernize, the demand for high-quality chemicals is increasing. The market is critical in ensuring a seamless supply chain and providing industries with suitable materials at the right time. As manufacturing processes become more complex and customized, distributors are essential in meeting the tailored needs of their customers by offering specialized products and technical expertise.
The chemical distribution market in the U.S. held the largest share in North America. The U.S. is a global leader in manufacturing, and these sectors require a wide array of chemicals, from basic industrial chemicals to advanced specialty chemicals. For example, the automotive industry demands coatings, adhesives, and polymers, while agriculture relies on agrochemicals like fertilizers, pesticides, and herbicides. Chemical distributors in the U.S. are crucial in supplying these materials to ensure efficient production processes.
The Asia Pacific chemical distribution market accounted for the largest revenue share of 62.2% in 2024. Asia Pacific has experienced significant economic growth over the past few decades, with countries such as China, India, and Southeast Asian nations being major contributors. The expansion of industries such as automotive, construction, electronics, pharmaceuticals, and agriculture in these economies has created a robust demand for various chemicals. Chemical distributors, acting as intermediaries between manufacturers and end-users, are crucial in meeting this demand by ensuring the efficient delivery of raw materials and chemicals to diverse sectors.
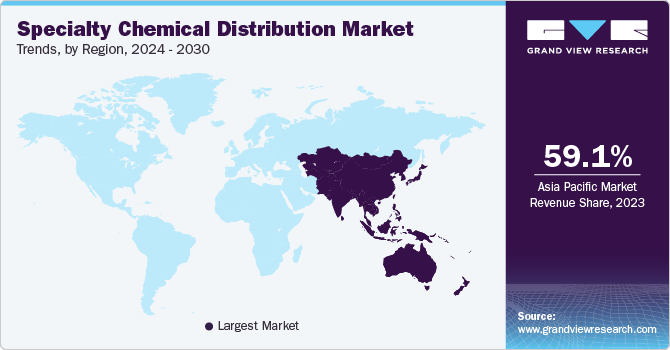
The chemical distribution market in China is experiencing substantial growth. As the world’s largest manufacturing hub, China’s demand for chemicals across various sectors, such as automotive, electronics, construction, textiles, and consumer goods, is immense. The rapid expansion of infrastructure and the growth of urban centers have significantly increased the demand for construction chemicals, specialty coatings, adhesives, and polymers. Chemical distributors are crucial in ensuring these industries have access to high-quality, cost-effective raw materials to meet their production needs, making them indispensable partners in China’s industrial growth.
Europe chemical distribution market is anticipated to grow significantly over the forecast period As European industries expand and modernize, the demand for specialized chemicals ranging from basic to high-performance materials has surged. This creates an opportunity for chemical distributors to cater to a broad range of applications, offering everything from solvents and additives to specialty chemicals for advanced manufacturing processes.
Some key players operating in the market include Univar Solution Inc., Helm AG, Brenntag AG, and others:
Univar Solutions Inc. is a global chemical and ingredient distributor, providing various products and services to multiple industries, including agriculture, food and beverage, personal care, pharmaceuticals, and industrial applications. The company operates a vast distribution network that delivers over 10,000 products from more than 1,000 suppliers to customers across North America, Europe, Asia Pacific, and Latin America.
Helm AG operates through an extensive network of over 30 countries, facilitating the supply of chemicals to various industries, including agriculture, pharmaceuticals, and manufacturing. The company offers a diverse portfolio that includes basic chemicals, specialty chemicals, and agrochemicals, ensuring compliance with stringent safety and environmental regulations.
The following are the leading companies in the chemical distribution market. These companies collectively hold the largest market share and dictate industry trends.
View a comprehensive list of companies in the Chemical Distribution Market
Report Attribute |
Details |
Market size value in 2025 |
USD 283.45 billion |
Revenue forecast in 2030 |
USD 403.22 billion |
Growth rate |
CAGR of 7.3% from 2025 to 2030 |
Actual data |
2018 - 2024 |
Forecast period |
2025 - 2030 |
Quantitative units |
Revenue in USD million/billion, and CAGR from 2025 to 2030 |
Report coverage |
Revenue forecast, company ranking, competitive landscape, growth factors, and trends |
Regional Scope |
North America; Europe; Asia Pacific; Central & South America; Middle East & Africa |
Country scope |
U.S.; Canada; Mexico; Germany; UK; Italy; France; Spain; Belgium; China; India; Japan; South Korea; Taiwan; Brazil; Argentina; Saudi Arabia; South Africa; UAE; Qatar; Kuwait; Bahrain; Oman |
Segments covered |
Type, end-use, region |
Key companies profiled |
Univar Solutions Inc.; Helm AG; Brenntag AG; Ter Group; Barentz; Azelis; Safic Alan; ICC Industries, Inc.; Jebsen & Jessen Pte. Ltd.; Quimidroga; Solvadis Deutschland GmbH; Ashland; Caldic B.V.; Wilbur Ellis Holdings, Inc.; Omya AG; IMCD; Biesterfeld AG; Stockmeier Group; REDA Chemicals; Manuchar |
Customization scope |
Free report customization (equivalent up to 8 analysts working days) with purchase. Addition or alteration to country, regional & segment scope. |
Pricing and purchase options |
Avail customized purchase options to meet your exact research needs. Explore purchase options |
This report forecasts revenue growth at global, regional, and country levels and provides an analysis of the industry trends in each of the sub-segments from 2018 to 2030. For this study, Grand View Research has segmented the global chemical distribution market based on the type, end-use, and region:
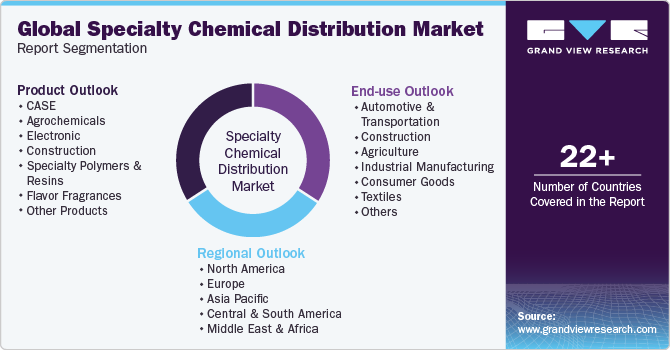
Product Outlook (Revenue, USD Million, 2018 - 2030)
Specialty Chemicals
CASE
Agrochemicals
Electronic
Construction
Specialty Polymers & Resins
Personal Care & Pharmaceuticals
Other Specialty Chemicals
Commodity Chemicals
Plastic & Polymers
Synthetic Rubber
Explosives
Petrochemicals
Other Commodity Chemicals
End-use Outlook (Revenue, USD Million, 2018 - 2030)
Specialty Chemicals
Automotive & Transportation
Construction
Agriculture
Industrial Manufacturing
Consumer Goods
Textiles
Pharmaceuticals
Other Specialty Chemical End-uses
Commodity Chemicals
Downstream chemicals
Textile
Electrical & Electronics
Automotive & Transportation
Industrial Manufacturing
Other Commodity Chemicals End-uses
Regional Outlook (Revenue, USD Million, 2018 - 2030)
North America
U.S.
Canada
Mexico
Europe
Germany
UK
France
Italy
Spain
Belgium
Asia Pacific
China
India
Japan
South Korea
Taiwan
Central & South America
Brazil
Argentina
Middle East & Africa
Saudi Arabia
South Africa
UAE
Qatar
Kuwait
Oman
Bahrain
b. The global chemical distribution market size was estimated at USD 268.93 billion in 2024 and is expected to reach USD 283.45 billion in 2025.
b. The global chemical distribution market is expected to grow at a compound annual growth rate of 7.3% from 2025 to 2030 to reach USD 403.22 billion by 2030.
b. Commodity chemicals dominated the chemical distribution market with a share of 63.7% in 2024 owing to an increased demand for products that rely on commodity chemicals.
b. Some key players operating in the chemical distribution market include Univar AG, Helm AG, Brenntag AG, Azelis Holdings SA, IMCD Group, BASF SE and Biesterfeld AG.
b. Key factors that are driving the market growth include increasing consumption of chemicals across end-use industries such as construction, pharmaceutical, polymers and resins coupled with high complexity in reaching the customers.
Table of Contents
Chapter 1 Methodology and Scope
1.1 Market Segmentation & Scope
1.2 Market Definition
1.3 Information Procurement
1.3.1 Purchased Database
1.3.2 GVR’s Internal Database
1.3.3 Secondary Sources
1.3.4 Third-Party Perspectives
1.3.5 Primary Research
1.4 Information Analysis
1.4.1 Data Analysis Models
1.5 Market Formulation & Data Visualization
1.6 Data Validation & Publishing
Chapter 2 Executive Summary
2.1 Market Outlook
2.2 Segmental Outlook
2.3 Competitive Insights
Chapter 3 Chemical Distribution Market Variables, Trends & Scope
3.1 Parent Market Outlook
3.2 Chemical Distribution Market - Value Chain Analysis
3.2.1 Manufacturing Trends
3.2.2 Sales Channel Analysis
3.3 Technology Overview
3.4 Regulatory Framework
3.4.1 Analyst Perspective
3.5 Chemical Distribution Market - Market Dynamics
3.5.1 Market Driver Analysis
3.5.2 Market Restraint Analysis
3.5.3 Market Opportunity Analysis
3.5.4 Industry Challenges
3.5.5 Industry Analysis - Porter's
3.5.5.1 Threat from New Entrant
3.5.5.2 Bargaining Power of Buyers
3.5.5.3 Competitive Rivalry
3.5.5.4 Threat of Substitutes
3.5.5.5 Bargaining Power of Suppliers
3.5.5.6 Substitute Material Analysis
3.5.6 PESTEL Analysis by SWOT
3.5.6.1 Political Landscape
3.5.6.2 Environmental Landscape
3.5.6.3 Social Landscape
3.5.6.4 Technology Landscape
3.5.6.5 Economic Landscape
3.5.6.6 Legal Landscape
3.5.7 Market Disruption Analysis
Chapter 4 Chemical Distribution Market- Supplier Portfolio Analysis
4.1 List of Raw Material Suppliers
4.2 Raw Material Trend
4.3 Postfolio Analysis/ Kraljic Matrix
4.4 Engagemet Model
4.5 Negotiation Strategies
4.6 Sourcing Best Practices
Chapter 5 Chemical Distribution Market: Product Type Estimates & Trend Analysis
5.1 Product movement analysis & market share, 2024 & 2030 (%)
5.2 Chemical distribution market size & forecasts and trend analysis by product, 2018 - 2030 (USD Million)
5.2.1 Specialty Chemicals
5.2.1.1 Specialty Chemicals distribution market estimates & forecast, by product, 2018 - 2020 (USD Million)
5.2.1.2 CASE
5.2.1.3 Agrochemicals
5.2.1.4 Construction Chemicals
5.2.1.5 Electrinic Chemicals
5.2.1.6 Specialty Polymers & Resins
5.2.1.7 Flavros & Fragrances
5.2.1.8 Other Specialty Chemcials
5.2.2 Commodity Chemicals
5.2.2.1 Commodity Chemicals distribution market estimates & forecast, by product, 2018 - 2020 (USD Million)
5.2.2.2 Plastics & Polymers
5.2.2.3 Synthetic Rubber
5.2.2.4 Explosives
5.2.2.5 Petrochemicals
5.2.2.6 Other Commodity Chemicals
Chapter 6 Chemical Distribution Market: End use Estimates & Trend Analysis
6.1 End-use movement analysis & market share, 2024 & 2030 (%)
6.2 Chemical Distribution market size & forecasts and trend analysis by End use, 2018 - 2030 (USD Million)
6.2.1 Specialty Chemicals
6.2.1.1 Specialty chemical Distribution Market estimates and forecasts, by end-use, 2018 - 2030 (USD Million)
6.2.1.2 Automotive & Transportation
6.2.1.2.1 Specialty chemical Distribution Market estimates and forecasts, in Automotive & Transportation, 2018 - 2030 (USD Million)
6.2.1.3 Construction
6.2.1.3.1 Specialty chemical Distribution Market estimates and forecasts, in Construction, 2018 - 2030 (USD Million)
6.2.1.3 Agriculture
6.2.1.3.1 Specialty chemical Distribution Market estimates and forecasts, in Agriculture, 2018 - 2030 (USD Million)
6.2.1.4 Industrial Manufacturing
6.2.1.4.1 Specialty chemical Distribution Market estimates and forecasts, in Industrial Manufacturing, 2018 - 2030 (USD Million)
6.2.1.5 Consumer Goods
6.2.1.5.1 Specialty chemical Distribution Market estimates and forecasts, in Consumer Goods, 2018 - 2030 (USD Million)
6.2.1.6 Textiles
6.2.1.6.1 Specialty chemical Distribution Market estimates and forecasts, in Textiles, 2018 - 2030 (USD Million)
6.2.1.7 Pharmaceuticals
6.2.1.7.1 Specialty chemical Distribution Market estimates and forecasts, in Pharmaceuticals, 2018 - 2030 (USD Million)
6.2.1.8 Other Specialty Chemicals End-uses
6.2.1.8.1 Specialty chemical Distribution Market estimates and forecasts, in Other Specialty Chemicals End-uses, 2018 - 2030 (USD Million)
6.2.2 Commodity Chemicals
6.2.2.1 Commodity chemical Distribution Market estimates and forecasts, by end-use, 2018 - 2030 (USD Million)
6.2.2.2 Downstream Chemicals
6.2.2.2.1 Specialty chemical Distribution Market estimates and forecasts, in Downstream Chemicals, 2018 - 2030 (USD Million)
6.2.2.3 Textiles
6.2.2.3.1 Specialty chemical Distribution Market estimates and forecasts, in Textiles, 2018 - 2030 (USD Million)
6.2.2.4 Automotive & Transportation
6.2.2.4.1 Specialty chemical Distribution Market estimates and forecasts, in Automotive & Transportation, 2018 - 2030 (USD Million)
6.2.2.5 Electrical & Electronic
6.2.2.5.1 Specialty chemical Distribution Market estimates and forecasts, in Electrical & Electronic, 2018 - 2030 (USD Million)
6.2.2.6 Industrial Manufacturing
6.2.2.6.1 Specialty chemical Distribution Market estimates and forecasts, in Industrial Manufacturing, 2018 - 2030 (USD Million)
Chapter 7 Chemical Distribution Market: Regional Estimates & Trend Analysis
7.1 Global Chemical Distribution movement analysis & market share, 2024 & 2030 (%)
7.1.1 Global Chemical Distribution Market Estimates and Forecasts, by Product, 2018 - 2030 (USD Million)
7.1.1.1 Global Chemical Distribution Market Estimates and Forecasts, by Specialty Chemicals, 2018 - 2030 (USD Million)
7.1.1.2 Global Chemical Distribution Market Estimates and Forecasts, by Commodity Chemicals, 2018 - 2030 (USD Million)
7.1.2 Global Chemical Distribution Market Estimates and Forecasts, by End-Use, 2018 - 2030 (USD Million)
7.1.2.1 Global Chemical Distribution Market Estimates and Forecasts, by Specialty Chemicals, 2018 - 2030 (USD Million)
7.1.2.2 Global Chemical Distribution Market Estimates and Forecasts, by Commodity Chemicals, 2018 - 2030 (USD Million)
7.1.3 North America
7.1.3.1 North America Chemical Distribution Market Estimates and Forecasts, by Product, 2018 - 2030 (USD Million)
7.1.3.1.1 North America Chemical Distribution Market Estimates and Forecasts, by Specialty Chemicals, 2018 - 2030 (USD Million)
7.1.3.1.2 North America Chemical Distribution Market Estimates and Forecasts, by Commodity Chemicals, 2018 - 2030 (USD Million)
7.1.3.2 North America Chemical Distribution Market Estimates and Forecasts, by End-Use, 2018 - 2030 (USD Million)
7.1.3.2.1 North America Chemical Distribution Market Estimates and Forecasts, by Specialty Chemicals, 2018 - 2030 (USD Million)
7.1.3.2.2 North America Chemical Distribution Market Estimates and Forecasts, by Commodity Chemicals, 2018 - 2030 (USD Million)
7.1.3.3 U.S.
7.1.3.3.1 U.S. Chemical Distribution Market Estimates and Forecasts, by Product, 2018 - 2030 (USD Million)
7.1.3.3.1.1 U.S. Chemical Distribution Market Estimates and Forecasts, by Specialty Chemicals, 2018 - 2030 (USD Million)
7.1.3.3.1.2 U.S. Chemical Distribution Market Estimates and Forecasts, by Commodity Chemicals, 2018 - 2030 (USD Million)
7.1.3.3.2 U.S. Chemical Distribution Market Estimates and Forecasts, by End-Use, 2018 - 2030 (USD Million)
7.1.3.3.2.1 U.S. Chemical Distribution Market Estimates and Forecasts, by Specialty Chemicals, 2018 - 2030 (USD Million)
7.1.3.3.2.2 U.S. Chemical Distribution Market Estimates and Forecasts, by Commodity Chemicals, 2018 - 2030 (USD Million)
7.1.3.4 Canada
7.1.3.4.1 Canada Chemical Distribution Market Estimates and Forecasts, by Product, 2018 - 2030 (USD Million)
7.1.3.4.1.1 Canada Chemical Distribution Market Estimates and Forecasts, by Specialty Chemicals, 2018 - 2030 (USD Million)
7.1.3.4.1.2 Canada Chemical Distribution Market Estimates and Forecasts, by Commodity Chemicals, 2018 - 2030 (USD Million)
7.1.3.4.2 Canada Chemical Distribution Market Estimates and Forecasts, by End-Use, 2018 - 2030 (USD Million)
7.1.3.4.2.1 Canada Chemical Distribution Market Estimates and Forecasts, by Specialty Chemicals, 2018 - 2030 (USD Million)
7.1.3.4.2.2 Canada Chemical Distribution Market Estimates and Forecasts, by Commodity Chemicals, 2018 - 2030 (USD Million)
7.1.3.5 Mexico
7.1.3.5.1 Mexico Chemical Distribution Market Estimates and Forecasts, by Product, 2018 - 2030 (USD Million)
7.1.3.5.1.1 Mexico Chemical Distribution Market Estimates and Forecasts, by Specialty Chemicals, 2018 - 2030 (USD Million)
7.1.3.5.1.2 Mexico Chemical Distribution Market Estimates and Forecasts, by Commodity Chemicals, 2018 - 2030 (USD Million)
7.1.3.5.2 Mexico Chemical Distribution Market Estimates and Forecasts, by End-Use, 2018 - 2030 (USD Million)
7.1.3.5.2.1 Mexico Chemical Distribution Market Estimates and Forecasts, by Specialty Chemicals, 2018 - 2030 (USD Million)
7.1.3.5.2.2 Mexico Chemical Distribution Market Estimates and Forecasts, by Commodity Chemicals, 2018 - 2030 (USD Million)
7.1.4 Europe
7.1.4.1 Europe Chemical Distribution Market Estimates and Forecasts, by Product, 2018 - 2030 (USD Million)
7.1.4.1.1 Europe Chemical Distribution Market Estimates and Forecasts, by Specialty Chemicals, 2018 - 2030 (USD Million)
7.1.4.1.2 Europe Chemical Distribution Market Estimates and Forecasts, by Commodity Chemicals, 2018 - 2030 (USD Million)
7.1.4.2 Europe Chemical Distribution Market Estimates and Forecasts, by End-Use, 2018 - 2030 (USD Million)
7.1.4.2.1 Europe Chemical Distribution Market Estimates and Forecasts, by Specialty Chemicals, 2018 - 2030 (USD Million)
7.1.4.2.2 Europe Chemical Distribution Market Estimates and Forecasts, by Commodity Chemicals, 2018 - 2030 (USD Million)
7.1.4.3 Germany
7.1.4.3.1 Germany Chemical Distribution Market Estimates and Forecasts, by Product, 2018 - 2030 (USD Million)
7.1.4.3.1.1 Germany Chemical Distribution Market Estimates and Forecasts, by Specialty Chemicals, 2018 - 2030 (USD Million)
7.1.4.3.1.2 Germany Chemical Distribution Market Estimates and Forecasts, by Commodity Chemicals, 2018 - 2030 (USD Million)
7.1.4.3.2 Germany Chemical Distribution Market Estimates and Forecasts, by End-Use, 2018 - 2030 (USD Million)
7.1.4.3.2.1 Germany Chemical Distribution Market Estimates and Forecasts, by Specialty Chemicals, 2018 - 2030 (USD Million)
7.1.4.3.2.2 Germany Chemical Distribution Market Estimates and Forecasts, by Commodity Chemicals, 2018 - 2030 (USD Million)
7.1.4.4 UK
7.1.4.4.1 UK Chemical Distribution Market Estimates and Forecasts, by Product, 2018 - 2030 (USD Million)
7.1.4.4.1.1 UK Chemical Distribution Market Estimates and Forecasts, by Specialty Chemicals, 2018 - 2030 (USD Million)
7.1.4.4.1.2 UK Chemical Distribution Market Estimates and Forecasts, by Commodity Chemicals, 2018 - 2030 (USD Million)
7.1.4.4.2 UK Chemical Distribution Market Estimates and Forecasts, by End-Use, 2018 - 2030 (USD Million)
7.1.4.4.2.1 UK Chemical Distribution Market Estimates and Forecasts, by Specialty Chemicals, 2018 - 2030 (USD Million)
7.1.4.4.2.2 UK Chemical Distribution Market Estimates and Forecasts, by Commodity Chemicals, 2018 - 2030 (USD Million)
7.1.4.5 France
7.1.4.5.1 France Chemical Distribution Market Estimates and Forecasts, by Product, 2018 - 2030 (USD Million)
7.1.4.5.1.1 France Chemical Distribution Market Estimates and Forecasts, by Specialty Chemicals, 2018 - 2030 (USD Million)
7.1.4.5.1.2 France Chemical Distribution Market Estimates and Forecasts, by Commodity Chemicals, 2018 - 2030 (USD Million)
7.1.4.5.2 France Chemical Distribution Market Estimates and Forecasts, by End-Use, 2018 - 2030 (USD Million)
7.1.4.5.2.1 France Chemical Distribution Market Estimates and Forecasts, by Specialty Chemicals, 2018 - 2030 (USD Million)
7.1.4.5.2.2 France Chemical Distribution Market Estimates and Forecasts, by Commodity Chemicals, 2018 - 2030 (USD Million)
7.1.4.6 Italy
7.1.4.6.1 Italy Chemical Distribution Market Estimates and Forecasts, by Product, 2018 - 2030 (USD Million)
7.1.4.6.1.1 Italy Chemical Distribution Market Estimates and Forecasts, by Specialty Chemicals, 2018 - 2030 (USD Million)
7.1.4.6.1.2 Italy Chemical Distribution Market Estimates and Forecasts, by Commodity Chemicals, 2018 - 2030 (USD Million)
7.1.4.6.2 Italy Chemical Distribution Market Estimates and Forecasts, by End-Use, 2018 - 2030 (USD Million)
7.1.4.6.2.1 Italy Chemical Distribution Market Estimates and Forecasts, by Specialty Chemicals, 2018 - 2030 (USD Million)
7.1.4.6.2.2 Italy Chemical Distribution Market Estimates and Forecasts, by Commodity Chemicals, 2018 - 2030 (USD Million)
7.1.4.7 Spain
7.1.4.7.1 Spain Chemical Distribution Market Estimates and Forecasts, by Product, 2018 - 2030 (USD Million)
7.1.4.7.1.1 Spain Chemical Distribution Market Estimates and Forecasts, by Specialty Chemicals, 2018 - 2030 (USD Million)
7.1.4.7.1.2 Spain Chemical Distribution Market Estimates and Forecasts, by Commodity Chemicals, 2018 - 2030 (USD Million)
7.1.4.7.2 Spain Chemical Distribution Market Estimates and Forecasts, by End-Use, 2018 - 2030 (USD Million)
7.1.4.7.2.1 Spain Chemical Distribution Market Estimates and Forecasts, by Specialty Chemicals, 2018 - 2030 (USD Million)
7.1.4.7.2.2 Spain Chemical Distribution Market Estimates and Forecasts, by Commodity Chemicals, 2018 - 2030 (USD Million)
7.1.4.8 Belgium
7.1.4.8.1 Belgium Chemical Distribution Market Estimates and Forecasts, by Product, 2018 - 2030 (USD Million)
7.1.4.8.1.1 Belgium Chemical Distribution Market Estimates and Forecasts, by Specialty Chemicals, 2018 - 2030 (USD Million)
7.1.4.8.1.2 Belgium Chemical Distribution Market Estimates and Forecasts, by Commodity Chemicals, 2018 - 2030 (USD Million)
7.1.4.8.2 Belgium Chemical Distribution Market Estimates and Forecasts, by End-Use, 2018 - 2030 (USD Million)
7.1.4.8.2.1 Belgium Chemical Distribution Market Estimates and Forecasts, by Specialty Chemicals, 2018 - 2030 (USD Million)
7.1.4.8.2.2 Belgium Chemical Distribution Market Estimates and Forecasts, by Commodity Chemicals, 2018 - 2030 (USD Million)
7.1.5 Asia Pacific
7.1.5.1 Asia Pacific Chemical Distribution Market Estimates and Forecasts, by Product, 2018 - 2030 (USD Million)
7.1.5.1.1 Asia Pacific Chemical Distribution Market Estimates and Forecasts, by Specialty Chemicals, 2018 - 2030 (USD Million)
7.1.5.1.2 Asia Pacific Chemical Distribution Market Estimates and Forecasts, by Commodity Chemicals, 2018 - 2030 (USD Million)
7.1.5.2 Asia Pacific Chemical Distribution Market Estimates and Forecasts, by End-Use, 2018 - 2030 (USD Million)
7.1.5.2.1 Asia Pacific Chemical Distribution Market Estimates and Forecasts, by Specialty Chemicals, 2018 - 2030 (USD Million)
7.1.5.2.2 Asia Pacific Chemical Distribution Market Estimates and Forecasts, by Commodity Chemicals, 2018 - 2030 (USD Million)
7.1.5.3 China
7.1.5.3.1 China Chemical Distribution Market Estimates and Forecasts, by Product, 2018 - 2030 (USD Million)
7.1.5.3.1.1 China Chemical Distribution Market Estimates and Forecasts, by Specialty Chemicals, 2018 - 2030 (USD Million)
7.1.5.3.1.2 China Chemical Distribution Market Estimates and Forecasts, by Commodity Chemicals, 2018 - 2030 (USD Million)
7.1.5.3.2 China Chemical Distribution Market Estimates and Forecasts, by End-Use, 2018 - 2030 (USD Million)
7.1.5.3.2.1 China Chemical Distribution Market Estimates and Forecasts, by Specialty Chemicals, 2018 - 2030 (USD Million)
7.1.5.3.2.2 China Chemical Distribution Market Estimates and Forecasts, by Commodity Chemicals, 2018 - 2030 (USD Million)
7.1.5.4 India
7.1.5.4.1 India Chemical Distribution Market Estimates and Forecasts, by Product, 2018 - 2030 (USD Million)
7.1.5.4.1.1 India Chemical Distribution Market Estimates and Forecasts, by Specialty Chemicals, 2018 - 2030 (USD Million)
7.1.5.4.1.2 India Chemical Distribution Market Estimates and Forecasts, by Commodity Chemicals, 2018 - 2030 (USD Million)
7.1.5.4.2 India Chemical Distribution Market Estimates and Forecasts, by End-Use, 2018 - 2030 (USD Million)
7.1.5.4.2.1 India Chemical Distribution Market Estimates and Forecasts, by Specialty Chemicals, 2018 - 2030 (USD Million)
7.1.5.4.2.2 India Chemical Distribution Market Estimates and Forecasts, by Commodity Chemicals, 2018 - 2030 (USD Million)
7.1.5.5 Japan
7.1.5.5.1 Japan Chemical Distribution Market Estimates and Forecasts, by Product, 2018 - 2030 (USD Million)
7.1.5.5.1.1 Japan Chemical Distribution Market Estimates and Forecasts, by Specialty Chemicals, 2018 - 2030 (USD Million)
7.1.5.5.1.2 Japan Chemical Distribution Market Estimates and Forecasts, by Commodity Chemicals, 2018 - 2030 (USD Million)
7.1.5.5.2 Japan Chemical Distribution Market Estimates and Forecasts, by End-Use, 2018 - 2030 (USD Million)
7.1.5.5.2.1 Japan Chemical Distribution Market Estimates and Forecasts, by Specialty Chemicals, 2018 - 2030 (USD Million)
7.1.5.5.2.2 Japan Chemical Distribution Market Estimates and Forecasts, by Commodity Chemicals, 2018 - 2030 (USD Million)
7.1.5.6 South Korea
7.1.5.6.1 South Korea Chemical Distribution Market Estimates and Forecasts, by Product, 2018 - 2030 (USD Million)
7.1.5.6.1.1 South Korea Chemical Distribution Market Estimates and Forecasts, by Specialty Chemicals, 2018 - 2030 (USD Million)
7.1.5.6.1.2 South Korea Chemical Distribution Market Estimates and Forecasts, by Commodity Chemicals, 2018 - 2030 (USD Million)
7.1.5.6.2 South Korea Chemical Distribution Market Estimates and Forecasts, by End-Use, 2018 - 2030 (USD Million)
7.1.5.6.2.1 South Korea Chemical Distribution Market Estimates and Forecasts, by Specialty Chemicals, 2018 - 2030 (USD Million)
7.1.5.6.2.2 South Korea Chemical Distribution Market Estimates and Forecasts, by Commodity Chemicals, 2018 - 2030 (USD Million)
7.1.5.7 Taiwan
7.1.5.7.1 Taiwan Chemical Distribution Market Estimates and Forecasts, by Product, 2018 - 2030 (USD Million)
7.1.5.7.1.1 Taiwan Chemical Distribution Market Estimates and Forecasts, by Specialty Chemicals, 2018 - 2030 (USD Million)
7.1.5.7.1.2 Taiwan Chemical Distribution Market Estimates and Forecasts, by Commodity Chemicals, 2018 - 2030 (USD Million)
7.1.5.7.2 Taiwan Chemical Distribution Market Estimates and Forecasts, by End-Use, 2018 - 2030 (USD Million)
7.1.5.7.2.1 Taiwan Chemical Distribution Market Estimates and Forecasts, by Specialty Chemicals, 2018 - 2030 (USD Million)
7.1.5.7.2.2 Taiwan Chemical Distribution Market Estimates and Forecasts, by Commodity Chemicals, 2018 - 2030 (USD Million)
7.1.6 Central & South America
7.1.61 Central & South America Chemical Distribution Market Estimates and Forecasts, by Product, 2018 - 2030 (USD Million)
7.1.6.1.1 Central & South America Chemical Distribution Market Estimates and Forecasts, by Specialty Chemicals, 2018 - 2030 (USD Million)
7.1.6.1.2 Central & South America Chemical Distribution Market Estimates and Forecasts, by Commodity Chemicals, 2018 - 2030 (USD Million)
7.1.6.2 Central & South America Chemical Distribution Market Estimates and Forecasts, by End-Use, 2018 - 2030 (USD Million)
7.1.6.2.1 Central & South America Chemical Distribution Market Estimates and Forecasts, by Specialty Chemicals, 2018 - 2030 (USD Million)
7.1.6.2.2 Central & South America Chemical Distribution Market Estimates and Forecasts, by Commodity Chemicals, 2018 - 2030 (USD Million)
7.1.6.3 Brazil
7.1.6.3.1 Brazil Chemical Distribution Market Estimates and Forecasts, by Product, 2018 - 2030 (USD Million)
7.1.6.3.1.1 Brazil Chemical Distribution Market Estimates and Forecasts, by Specialty Chemicals, 2018 - 2030 (USD Million)
7.1.6.3.1.2 Brazil Chemical Distribution Market Estimates and Forecasts, by Commodity Chemicals, 2018 - 2030 (USD Million)
7.1.6.3.2 Brazil Chemical Distribution Market Estimates and Forecasts, by End-Use, 2018 - 2030 (USD Million)
7.1.6.3.2.1 Brazil Chemical Distribution Market Estimates and Forecasts, by Specialty Chemicals, 2018 - 2030 (USD Million)
7.1.6.3.2.2 Brazil Chemical Distribution Market Estimates and Forecasts, by Commodity Chemicals, 2018 - 2030 (USD Million)
7.1.6.4 Argentina
7.1.6.4.1 Argentina Chemical Distribution Market Estimates and Forecasts, by Product, 2018 - 2030 (USD Million)
7.1.6.4.1.1 Argentina Chemical Distribution Market Estimates and Forecasts, by Specialty Chemicals, 2018 - 2030 (USD Million)
7.1.6.4.1.2 Argentina Chemical Distribution Market Estimates and Forecasts, by Commodity Chemicals, 2018 - 2030 (USD Million)
7.1.6.4.2 Argentina Chemical Distribution Market Estimates and Forecasts, by End-Use, 2018 - 2030 (USD Million)
7.1.6.4.2.1 Argentina Chemical Distribution Market Estimates and Forecasts, by Specialty Chemicals, 2018 - 2030 (USD Million)
7.1.6.4.2.2 Argentina Chemical Distribution Market Estimates and Forecasts, by Commodity Chemicals, 2018 - 2030 (USD Million)
7.1.7 Middle East & Africa
7.1.7.1 Middle East & Africa Chemical Distribution Market Estimates and Forecasts, by Product, 2018 - 2030 (USD Million)
7.1.7.1.1 Middle East & Africa Chemical Distribution Market Estimates and Forecasts, by Specialty Chemicals, 2018 - 2030 (USD Million)
7.1.7.1.2 Middle East & Africa Chemical Distribution Market Estimates and Forecasts, by Commodity Chemicals, 2018 - 2030 (USD Million)
7.1.7.2 Middle East & Africa Chemical Distribution Market Estimates and Forecasts, by End-Use, 2018 - 2030 (USD Million)
7.1.7.2.1 Middle East & Africa Chemical Distribution Market Estimates and Forecasts, by Specialty Chemicals, 2018 - 2030 (USD Million)
7.1.7.2.2 Middle East & Africa Chemical Distribution Market Estimates and Forecasts, by Commodity Chemicals, 2018 - 2030 (USD Million)
7.1.7.3 South Africa
7.1.7.3.1 South Africa Chemical Distribution Market Estimates and Forecasts, by Product, 2018 - 2030 (USD Million)
7.1.7.3.1.1 South Africa Chemical Distribution Market Estimates and Forecasts, by Specialty Chemicals, 2018 - 2030 (USD Million)
7.1.7.3.1.2 South Africa Chemical Distribution Market Estimates and Forecasts, by Commodity Chemicals, 2018 - 2030 (USD Million)
7.1.7.3.2 South Africa Chemical Distribution Market Estimates and Forecasts, by End-Use, 2018 - 2030 (USD Million)
7.1.7.3.2.1 South Africa Chemical Distribution Market Estimates and Forecasts, by Specialty Chemicals, 2018 - 2030 (USD Million)
7.1.7.3.2.2 South Africa Chemical Distribution Market Estimates and Forecasts, by Commodity Chemicals, 2018 - 2030 (USD Million)
7.1.7.4 Saudi Arabia
7.1.7.4.1 Saudi Arabia Chemical Distribution Market Estimates and Forecasts, by Product, 2018 - 2030 (USD Million)
7.1.7.4.1.1 Saudi Arabia Chemical Distribution Market Estimates and Forecasts, by Specialty Chemicals, 2018 - 2030 (USD Million)
7.1.7.4.1.2 Saudi Arabia Chemical Distribution Market Estimates and Forecasts, by Commodity Chemicals, 2018 - 2030 (USD Million)
7.1.7.4.2 Saudi Arabia Chemical Distribution Market Estimates and Forecasts, by End-Use, 2018 - 2030 (USD Million)
7.1.7.4.2.1 Saudi Arabia Chemical Distribution Market Estimates and Forecasts, by Specialty Chemicals, 2018 - 2030 (USD Million)
7.1.7.4.2.2 Saudi Arabia Chemical Distribution Market Estimates and Forecasts, by Commodity Chemicals, 2018 - 2030 (USD Million)
7.1.7.5 UAE
7.1.7.5.1 UAE Chemical Distribution Market Estimates and Forecasts, by Product, 2018 - 2030 (USD Million)
7.1.7.5.1.1 UAE Chemical Distribution Market Estimates and Forecasts, by Specialty Chemicals, 2018 - 2030 (USD Million)
7.1.7.5.1.2 UAE Chemical Distribution Market Estimates and Forecasts, by Commodity Chemicals, 2018 - 2030 (USD Million)
7.1.7.5.2 UAE Chemical Distribution Market Estimates and Forecasts, by End-Use, 2018 - 2030 (USD Million)
7.1.7.5.2.1 UAE Chemical Distribution Market Estimates and Forecasts, by Specialty Chemicals, 2018 - 2030 (USD Million)
7.1.7.5.2.2 UAE Chemical Distribution Market Estimates and Forecasts, by Commodity Chemicals, 2018 - 2030 (USD Million)
7.1.7.6 Qatar
7.1.7.6.1 Qatar Chemical Distribution Market Estimates and Forecasts, by Product, 2018 - 2030 (USD Million)
7.1.7.6.1.1 Qatar Chemical Distribution Market Estimates and Forecasts, by Specialty Chemicals, 2018 - 2030 (USD Million)
7.1.7.6.1.2 Qatar Chemical Distribution Market Estimates and Forecasts, by Commodity Chemicals, 2018 - 2030 (USD Million)
7.1.7.6.2 Qatar Chemical Distribution Market Estimates and Forecasts, by End-Use, 2018 - 2030 (USD Million)
7.1.7.6.2.1 Qatar Chemical Distribution Market Estimates and Forecasts, by Specialty Chemicals, 2018 - 2030 (USD Million)
7.1.7.6.2.2 Qatar Chemical Distribution Market Estimates and Forecasts, by Commodity Chemicals, 2018 - 2030 (USD Million)
7.1.7.7 Kuwait
7.1.7.7.1 Kuwait Chemical Distribution Market Estimates and Forecasts, by Product, 2018 - 2030 (USD Million)
7.1.7.7.1.1 Kuwait Chemical Distribution Market Estimates and Forecasts, by Specialty Chemicals, 2018 - 2030 (USD Million)
7.1.7.7.1.2 Kuwait Chemical Distribution Market Estimates and Forecasts, by Commodity Chemicals, 2018 - 2030 (USD Million)
7.1.7.7.2 Kuwait Chemical Distribution Market Estimates and Forecasts, by End-Use, 2018 - 2030 (USD Million)
7.1.7.7.2.1 Kuwait Chemical Distribution Market Estimates and Forecasts, by Specialty Chemicals, 2018 - 2030 (USD Million)
7.1.7.7.2.2 Kuwait Chemical Distribution Market Estimates and Forecasts, by Commodity Chemicals, 2018 - 2030 (USD Million)
7.1.7.8 Oman
7.1.7.8.1 Oman Chemical Distribution Market Estimates and Forecasts, by Product, 2018 - 2030 (USD Million)
7.1.7.8.1.1 Oman Chemical Distribution Market Estimates and Forecasts, by Specialty Chemicals, 2018 - 2030 (USD Million)
7.1.7.8.1.2 Oman Chemical Distribution Market Estimates and Forecasts, by Commodity Chemicals, 2018 - 2030 (USD Million)
7.1.7.8.2 Oman Chemical Distribution Market Estimates and Forecasts, by End-Use, 2018 - 2030 (USD Million)
7.1.7.8.2.1 Oman Chemical Distribution Market Estimates and Forecasts, by Specialty Chemicals, 2018 - 2030 (USD Million)
7.1.7.8.2.2 Oman Chemical Distribution Market Estimates and Forecasts, by Commodity Chemicals, 2018 - 2030 (USD Million)
7.1.7.9 Bahrain
7.1.7.9.1 Bahrain Chemical Distribution Market Estimates and Forecasts, by Product, 2018 - 2030 (USD Million)
7.1.7.9.1.1 Bahrain Chemical Distribution Market Estimates and Forecasts, by Specialty Chemicals, 2018 - 2030 (USD Million)
7.1.7.9.1.2 Bahrain Chemical Distribution Market Estimates and Forecasts, by Commodity Chemicals, 2018 - 2030 (USD Million)
7.1.7.9.2 Bahrain Chemical Distribution Market Estimates and Forecasts, by End-Use, 2018 - 2030 (USD Million)
7.1.7.9.2.1 Bahrain Chemical Distribution Market Estimates and Forecasts, by Specialty Chemicals, 2018 - 2030 (USD Million)
7.1.7.9.2.2 Bahrain Chemical Distribution Market Estimates and Forecasts, by Commodity Chemicals, 2018 - 2030 (USD Million)
Chapter 8 Competitive Landscape
8.1 Recent Developments & Impact Analysis, By Key Market Participants
8.2 Company Market Positioning Analysis
8.3 Vendor Landscape
8.3.1 List of Key Manufacturers
8.3.2 List of Key Distributors/Channel Partners
8.3.3 List of Potential End-users
8.4 Competitive Environment
8.5 Strategy Framework
Chapter 9 Company Profiles
9.1 Univar SolutionsInc.
9.1.1 Company Introduction
9.1.2 Financial information
9.1.3 Product Portfolio
9.1.4 Strategic Initiatives
9.2 HELM AG
9.2.1 Company Introduction
9.2.2 Product Portfolio
9.2.3 Strategic Initiatives
9.3 BRENNTAG SE
9.3.1 Company Introduction
9.3.2 Financial information
9.3.3 Product Portfolio
9.3.4 Strategic Initiatives
9.4 Ter group
9.4.1 Company Introduction
9.4.2 Product Portfolio
9.4.3 Strategic Initiatives
9.5 BARENTZ
9.5.1 Company Introduction
9.5.2 Product Portfolio
9.5.3 Strategic Initiatives
9.6 Azelis
9.6.1 Company Introduction
9.6.2 Product Portfolio
9.6.3 Strategic Initiatives
9.7 Safic-Alcan
9.7.1 Company Introduction
9.7.2 Product Portfolio
9.7.3 Strategic Initiatives
9.8 ICC Industries, Inc.
9.8.1 Company Introduction
9.8.2 Product Portfolio
9.9 Jebsen & Jessen Pte. Ltd.
9.9.1 Company Introduction
9.9.2 Product Portfolio
9.9.3 Strategic Initiatives
9.10 QUIMIDROGA
9.10.1 Company Introduction
9.10.2 Product Portfolio
9.10.3 Strategic Initiatives
9.11 SOLVADIS DEUTSCHLAND GmbH
9.11.1 Company Introduction
9.11.2 Product Portfolio
9.12 ASHLAND
9.12.1 Company Introduction
9.12.2 Financial Information
9.12.3 Product Portfolio
9.12.4 Strategic Initiatives
9.13 Caldic B.V.
9.13.1 Company Introduction
9.13.2 Financial Information
9.13.3 Product Portfolio
9.13.4 Strategic Initiatives
9.14 Wilbur-Ellis Holdings, Inc.
9.14.1 COMPANY introduction
9.14.2 Product Portfolio
9.15 Omya AG
9.15.1 Company Introduction
9.15.2 Product Portfolio
9.15.3 Strategic Initiatives
9.16 IMCD
9.16.1 Company Introduction
9.16.2 Financial Information
9.16.3 Product Portfolio
9.16.4 Strategic Initiatives
9.17 Biesterfeld AG
9.17.1 Company Introduction
9.17.2 Product Portfolio
9.17.3 Strategic Initiatives
9.18 STOCKMEIER Group
9.18.1 Company Introduction
9.18.2 Product Portfolio
9.18.3 Strategic Initiatives
9.19 REDA Chemicals
9.19.1 Company Introduction
9.19.2 Product Portfolio
9.19.3 Strategic Initiatives
9.20 Manuchar
9.20.1 Company Introduction
9.20.2 Product Portfolio
List of Tables
Table 1 List of Key Raw Material Suppliers
Table 2 Global Chemical Distribution Market Size, Forecasts, and Trend Analysis, By Product Type, 2018 - 2030 (USD Million)
Table 3 Global Specialty Chemical Distribution Market Size, Forecasts, and Trend Analysis, By Product, 2018 - 2030 (USD Million)
Table 4 Global Commodity Chemical Distribution Market Size, Forecasts, and Trend Analysis, By Product, 2018 - 2030 (USD Million)
Table 5 Global Specialty Chemical Distribution Market Size, Forecasts, and Trend Analysis, By End-use, 2018 - 2030 (USD Million)
Table 6 Global Commodity Chemical Distribution Market Size, Forecasts, and Trend Analysis, By End-use, 2018 - 2030 (USD Million)
Table 7 North America Chemical Distribution Market Size, Forecasts, and Trend Analysis, By Product Type, 2018 - 2030 (USD Million)
Table 8 North America Specialty Chemical Distribution Market Size, Forecasts, and Trend Analysis, By Product, 2018 - 2030 (USD Million)
Table 9 North America Commodity Chemical Distribution Market Size, Forecasts, and Trend Analysis, By Product, 2018 - 2030 (USD Million)
Table 10 North America Specialty Chemical Distribution Market Size, Forecasts, and Trend Analysis, By End-use, 2018 - 2030 (USD Million)
Table 11 North America Commodity Chemical Distribution Market Size, Forecasts, and Trend Analysis, By End-use, 2018 - 2030 (USD Million)
Table 12 U.S. Chemical Distribution Market Size, Forecasts, and Trend Analysis, By Product Type, 2018 - 2030 (USD Million)
Table 13 U.S. Specialty Chemical Distribution Market Size, Forecasts, and Trend Analysis, By Product, 2018 - 2030 (USD Million)
Table 14 U.S. Commodity Chemical Distribution Market Size, Forecasts, and Trend Analysis, By Product, 2018 - 2030 (USD Million)
Table 15 U.S. Specialty Chemical Distribution Market Size, Forecasts, and Trend Analysis, By End-use, 2018 - 2030 (USD Million)
Table 16 U.S. Commodity Chemical Distribution Market Size, Forecasts, and Trend Analysis, By End-use, 2018 - 2030 (USD Million)
Table 17 Canada Chemical Distribution Market Size, Forecasts, and Trend Analysis, By Product Type, 2018 - 2030 (USD Million)
Table 18 Canada Specialty Chemical Distribution Market Size, Forecasts, and Trend Analysis, By Product, 2018 - 2030 (USD Million)
Table 19 Canada Commodity Chemical Distribution Market Size, Forecasts, and Trend Analysis, By Product, 2018 - 2030 (USD Million)
Table 20 Canada Specialty Chemical Distribution Market Size, Forecasts, and Trend Analysis, By End-use, 2018 - 2030 (USD Million)
Table 21 Canada Commodity Chemical Distribution Market Size, Forecasts, and Trend Analysis, By End-use, 2018 - 2030 (USD Million)
Table 22 Mexico Chemical Distribution Market Size, Forecasts, and Trend Analysis, By Product Type, 2018 - 2030 (USD Million)
Table 23 Mexico Specialty Chemical Distribution Market Size, Forecasts, and Trend Analysis, By Product, 2018 - 2030 (USD Million)
Table 24 Mexico Commodity Chemical Distribution Market Size, Forecasts, and Trend Analysis, By Product, 2018 - 2030 (USD Million)
Table 25 Mexico Specialty Chemical Distribution Market Size, Forecasts, and Trend Analysis, By End-use, 2018 - 2030 (USD Million)
Table 26 Mexico Commodity Chemical Distribution Market Size, Forecasts, and Trend Analysis, By End-use, 2018 - 2030 (USD Million)
Table 27 Europe Chemical Distribution Market Size, Forecasts, and Trend Analysis, By Product Type, 2018 - 2030 (USD Million)
Table 28 Europe Specialty Chemical Distribution Market Size, Forecasts, and Trend Analysis, By Product, 2018 - 2030 (USD Million)
Table 29 Europe Commodity Chemical Distribution Market Size, Forecasts, and Trend Analysis, By Product, 2018 - 2030 (USD Million)
Table 30 Europe Specialty Chemical Distribution Market Size, Forecasts, and Trend Analysis, By End-use, 2018 - 2030 (USD Million)
Table 31 Europe Commodity Chemical Distribution Market Size, Forecasts, and Trend Analysis, By End-use, 2018 - 2030 (USD Million)
Table 32 Germany Chemical Distribution Market Size, Forecasts, and Trend Analysis, By Product Type, 2018 - 2030 (USD Million)
Table 33 Germany Specialty Chemical Distribution Market Size, Forecasts, and Trend Analysis, By Product, 2018 - 2030 (USD Million)
Table 34 Germany Commodity Chemical Distribution Market Size, Forecasts, and Trend Analysis, By Product, 2018 - 2030 (USD Million)
Table 35 Germany Specialty Chemical Distribution Market Size, Forecasts, and Trend Analysis, By End-use, 2018 - 2030 (USD Million)
Table 36 Germany Commodity Chemical Distribution Market Size, Forecasts, and Trend Analysis, By End-use, 2018 - 2030 (USD Million)
Table 37 UK Chemical Distribution Market Size, Forecasts, and Trend Analysis, By Product Type, 2018 - 2030 (USD Million)
Table 38 UK Specialty Chemical Distribution Market Size, Forecasts, and Trend Analysis, By Product, 2018 - 2030 (USD Million)
Table 39 UK Commodity Chemical Distribution Market Size, Forecasts, and Trend Analysis, By Product, 2018 - 2030 (USD Million)
Table 40 UK Specialty Chemical Distribution Market Size, Forecasts, and Trend Analysis, By End-use, 2018 - 2030 (USD Million)
Table 41 UK Commodity Chemical Distribution Market Size, Forecasts, and Trend Analysis, By End-use, 2018 - 2030 (USD Million)
Table 42 France Chemical Distribution Market Size, Forecasts, and Trend Analysis, By Product Type, 2018 - 2030 (USD Million)
Table 43 France Specialty Chemical Distribution Market Size, Forecasts, and Trend Analysis, By Product, 2018 - 2030 (USD Million)
Table 44 France Commodity Chemical Distribution Market Size, Forecasts, and Trend Analysis, By Product, 2018 - 2030 (USD Million)
Table 45 France Specialty Chemical Distribution Market Size, Forecasts, and Trend Analysis, By End-use, 2018 - 2030 (USD Million)
Table 46 France Commodity Chemical Distribution Market Size, Forecasts, and Trend Analysis, By End-use, 2018 - 2030 (USD Million)
Table 47 Italy Chemical Distribution Market Size, Forecasts, and Trend Analysis, By Product Type, 2018 - 2030 (USD Million)
Table 48 Italy Specialty Chemical Distribution Market Size, Forecasts, and Trend Analysis, By Product, 2018 - 2030 (USD Million)
Table 49 Italy Commodity Chemical Distribution Market Size, Forecasts, and Trend Analysis, By Product, 2018 - 2030 (USD Million)
Table 50 Italy Specialty Chemical Distribution Market Size, Forecasts, and Trend Analysis, By End-use, 2018 - 2030 (USD Million)
Table 51 Italy Commodity Chemical Distribution Market Size, Forecasts, and Trend Analysis, By End-use, 2018 - 2030 (USD Million)
Table 52 Belgium Chemical Distribution Market Size, Forecasts, and Trend Analysis, By Product Type, 2018 - 2030 (USD Million)
Table 53 Belgium Specialty Chemical Distribution Market Size, Forecasts, and Trend Analysis, By Product, 2018 - 2030 (USD Million)
Table 54 Belgium Commodity Chemical Distribution Market Size, Forecasts, and Trend Analysis, By Product, 2018 - 2030 (USD Million)
Table 55 Belgium Specialty Chemical Distribution Market Size, Forecasts, and Trend Analysis, By End-use, 2018 - 2030 (USD Million)
Table 56 Belgium Commodity Chemical Distribution Market Size, Forecasts, and Trend Analysis, By End-use, 2018 - 2030 (USD Million)
Table 57 Asia Pacific Chemical Distribution Market Size, Forecasts, and Trend Analysis, By Product Type, 2018 - 2030 (USD Million)
Table 58 Asia Pacific Specialty Chemical Distribution Market Size, Forecasts, and Trend Analysis, By Product, 2018 - 2030 (USD Million)
Table 59 Asia Pacific Commodity Chemical Distribution Market Size, Forecasts, and Trend Analysis, By Product, 2018 - 2030 (USD Million)
Table 60 Asia Pacific Specialty Chemical Distribution Market Size, Forecasts, and Trend Analysis, By End-use, 2018 - 2030 (USD Million)
Table 61 Asia Pacific Commodity Chemical Distribution Market Size, Forecasts, and Trend Analysis, By End-use, 2018 - 2030 (USD Million)
Table 62 China Chemical Distribution Market Size, Forecasts, and Trend Analysis, By Product Type, 2018 - 2030 (USD Million)
Table 63 China Specialty Chemical Distribution Market Size, Forecasts, and Trend Analysis, By Product, 2018 - 2030 (USD Million)
Table 64 China Commodity Chemical Distribution Market Size, Forecasts, and Trend Analysis, By Product, 2018 - 2030 (USD Million)
Table 65 China Specialty Chemical Distribution Market Size, Forecasts, and Trend Analysis, By End-use, 2018 - 2030 (USD Million)
Table 66 China Commodity Chemical Distribution Market Size, Forecasts, and Trend Analysis, By End-use, 2018 - 2030 (USD Million)
Table 67 India Chemical Distribution Market Size, Forecasts, and Trend Analysis, By Product Type, 2018 - 2030 (USD Million)
Table 68 India Specialty Chemical Distribution Market Size, Forecasts, and Trend Analysis, By Product, 2018 - 2030 (USD Million)
Table 69 India Commodity Chemical Distribution Market Size, Forecasts, and Trend Analysis, By Product, 2018 - 2030 (USD Million)
Table 70 India Specialty Chemical Distribution Market Size, Forecasts, and Trend Analysis, By End-use, 2018 - 2030 (USD Million)
Table 71 India Commodity Chemical Distribution Market Size, Forecasts, and Trend Analysis, By End-use, 2018 - 2030 (USD Million)
Table 72 Japan Chemical Distribution Market Size, Forecasts, and Trend Analysis, By Product Type, 2018 - 2030 (USD Million)
Table 73 Japan Specialty Chemical Distribution Market Size, Forecasts, and Trend Analysis, By Product, 2018 - 2030 (USD Million)
Table 74 Japan Commodity Chemical Distribution Market Size, Forecasts, and Trend Analysis, By Product, 2018 - 2030 (USD Million)
Table 75 Japan Specialty Chemical Distribution Market Size, Forecasts, and Trend Analysis, By End-use, 2018 - 2030 (USD Million)
Table 76 Japan Commodity Chemical Distribution Market Size, Forecasts, and Trend Analysis, By End-use, 2018 - 2030 (USD Million)
Table 77 South Korea Chemical Distribution Market Size, Forecasts, and Trend Analysis, By Product Type, 2018 - 2030 (USD Million)
Table 78 South Korea Specialty Chemical Distribution Market Size, Forecasts, and Trend Analysis, By Product, 2018 - 2030 (USD Million)
Table 79 South Korea Commodity Chemical Distribution Market Size, Forecasts, and Trend Analysis, By Product, 2018 - 2030 (USD Million)
Table 80 South Korea Specialty Chemical Distribution Market Size, Forecasts, and Trend Analysis, By End-use, 2018 - 2030 (USD Million)
Table 81 South Korea Commodity Chemical Distribution Market Size, Forecasts, and Trend Analysis, By End-use, 2018 - 2030 (USD Million)
Table 82 Taiwan Chemical Distribution Market Size, Forecasts, and Trend Analysis, By Product Type, 2018 - 2030 (USD Million)
Table 83 Taiwan Specialty Chemical Distribution Market Size, Forecasts, and Trend Analysis, By Product, 2018 - 2030 (USD Million)
Table 84 Taiwan Commodity Chemical Distribution Market Size, Forecasts, and Trend Analysis, By Product, 2018 - 2030 (USD Million)
Table 85 Taiwan Specialty Chemical Distribution Market Size, Forecasts, and Trend Analysis, By End-use, 2018 - 2030 (USD Million)
Table 86 Taiwan Commodity Chemical Distribution Market Size, Forecasts, and Trend Analysis, By End-use, 2018 - 2030 (USD Million)
Table 87 Central & South America Chemical Distribution Market Size, Forecasts, and Trend Analysis, By Product Type, 2018 - 2030 (USD Million)
Table 88 Central & South America Specialty Chemical Distribution Market Size, Forecasts, and Trend Analysis, By Product, 2018 - 2030 (USD Million)
Table 89 Central & South America Commodity Chemical Distribution Market Size, Forecasts, and Trend Analysis, By Product, 2018 - 2030 (USD Million)
Table 90 Central & South America Specialty Chemical Distribution Market Size, Forecasts, and Trend Analysis, By End-use, 2018 - 2030 (USD Million)
Table 91 Central & South America Commodity Chemical Distribution Market Size, Forecasts, and Trend Analysis, By End-use, 2018 - 2030 (USD Million)
Table 92 Brazil Chemical Distribution Market Size, Forecasts, and Trend Analysis, By Product Type, 2018 - 2030 (USD Million)
Table 93 Brazil Specialty Chemical Distribution Market Size, Forecasts, and Trend Analysis, By Product, 2018 - 2030 (USD Million)
Table 94 Brazil Commodity Chemical Distribution Market Size, Forecasts, and Trend Analysis, By Product, 2018 - 2030 (USD Million)
Table 95 Brazil Specialty Chemical Distribution Market Size, Forecasts, and Trend Analysis, By End-use, 2018 - 2030 (USD Million)
Table 96 Brazil Commodity Chemical Distribution Market Size, Forecasts, and Trend Analysis, By End-use, 2018 - 2030 (USD Million)
Table 97 Argentina Chemical Distribution Market Size, Forecasts, and Trend Analysis, By Product Type, 2018 - 2030 (USD Million)
Table 98 Argentina Specialty Chemical Distribution Market Size, Forecasts, and Trend Analysis, By Product, 2018 - 2030 (USD Million)
Table 99 Argentina Commodity Chemical Distribution Market Size, Forecasts, and Trend Analysis, By Product, 2018 - 2030 (USD Million)
Table 100 Argentina Specialty Chemical Distribution Market Size, Forecasts, and Trend Analysis, By End-use, 2018 - 2030 (USD Million)
Table 101 Argentina Commodity Chemical Distribution Market Size, Forecasts, and Trend Analysis, By End-use, 2018 - 2030 (USD Million)
Table 102 Middle East & Africa Chemical Distribution Market Size, Forecasts, and Trend Analysis, By Product Type, 2018 - 2030 (USD Million)
Table 103 Middle East & Africa Specialty Chemical Distribution Market Size, Forecasts, and Trend Analysis, By Product, 2018 - 2030 (USD Million)
Table 104 Middle East & Africa Commodity Chemical Distribution Market Size, Forecasts, and Trend Analysis, By Product, 2018 - 2030 (USD Million)
Table 105 Middle East & Africa Specialty Chemical Distribution Market Size, Forecasts, and Trend Analysis, By End-use, 2018 - 2030 (USD Million)
Table 106 Middle East & Africa Commodity Chemical Distribution Market Size, Forecasts, and Trend Analysis, By End-use, 2018 - 2030 (USD Million)
Table 107 UAE Chemical Distribution Market Size, Forecasts, and Trend Analysis, By Product Type, 2018 - 2030 (USD Million)
Table 108 UAE Specialty Chemical Distribution Market Size, Forecasts, and Trend Analysis, By Product, 2018 - 2030 (USD Million)
Table 109 UAE Commodity Chemical Distribution Market Size, Forecasts, and Trend Analysis, By Product, 2018 - 2030 (USD Million)
Table 110 UAE Specialty Chemical Distribution Market Size, Forecasts, and Trend Analysis, By End-use, 2018 - 2030 (USD Million)
Table 111 UAE Commodity Chemical Distribution Market Size, Forecasts, and Trend Analysis, By End-use, 2018 - 2030 (USD Million)
Table 112 Saudi Arabia Chemical Distribution Market Size, Forecasts, and Trend Analysis, By Product Type, 2018 - 2030 (USD Million)
Table 113 Saudi Arabia Specialty Chemical Distribution Market Size, Forecasts, and Trend Analysis, By Product, 2018 - 2030 (USD Million)
Table 114 Saudi Arabia Commodity Chemical Distribution Market Size, Forecasts, and Trend Analysis, By Product, 2018 - 2030 (USD Million)
Table 115 Saudi Arabia Specialty Chemical Distribution Market Size, Forecasts, and Trend Analysis, By End-use, 2018 - 2030 (USD Million)
Table 116 Saudi Arabia Commodity Chemical Distribution Market Size, Forecasts, and Trend Analysis, By End-use, 2018 - 2030 (USD Million)
Table 117 Qatar Chemical Distribution Market Size, Forecasts, and Trend Analysis, By Product Type, 2018 - 2030 (USD Million)
Table 118 Qatar Specialty Chemical Distribution Market Size, Forecasts, and Trend Analysis, By Product, 2018 - 2030 (USD Million)
Table 119 Qatar Commodity Chemical Distribution Market Size, Forecasts, and Trend Analysis, By Product, 2018 - 2030 (USD Million)
Table 120 Qatar Specialty Chemical Distribution Market Size, Forecasts, and Trend Analysis, By End-use, 2018 - 2030 (USD Million)
Table 121 Qatar Commodity Chemical Distribution Market Size, Forecasts, and Trend Analysis, By End-use, 2018 - 2030 (USD Million)
Table 122 Kuwait Chemical Distribution Market Size, Forecasts, and Trend Analysis, By Product Type, 2018 - 2030 (USD Million)
Table 123 Kuwait Specialty Chemical Distribution Market Size, Forecasts, and Trend Analysis, By Product, 2018 - 2030 (USD Million)
Table 124 Kuwait Commodity Chemical Distribution Market Size, Forecasts, and Trend Analysis, By Product, 2018 - 2030 (USD Million)
Table 125 Kuwait Specialty Chemical Distribution Market Size, Forecasts, and Trend Analysis, By End-use, 2018 - 2030 (USD Million)
Table 126 Kuwait Commodity Chemical Distribution Market Size, Forecasts, and Trend Analysis, By End-use, 2018 - 2030 (USD Million)
Table 127 Oman Chemical Distribution Market Size, Forecasts, and Trend Analysis, By Product Type, 2018 - 2030 (USD Million)
Table 128 Oman Specialty Chemical Distribution Market Size, Forecasts, and Trend Analysis, By Product, 2018 - 2030 (USD Million)
Table 129 Oman Commodity Chemical Distribution Market Size, Forecasts, and Trend Analysis, By Product, 2018 - 2030 (USD Million)
Table 130 Oman Specialty Chemical Distribution Market Size, Forecasts, and Trend Analysis, By End-use, 2018 - 2030 (USD Million)
Table 131 Oman Commodity Chemical Distribution Market Size, Forecasts, and Trend Analysis, By End-use, 2018 - 2030 (USD Million)
Table 132 Bahrain Chemical Distribution Market Size, Forecasts, and Trend Analysis, By Product Type, 2018 - 2030 (USD Million)
Table 133 Bahrain Specialty Chemical Distribution Market Size, Forecasts, and Trend Analysis, By Product, 2018 - 2030 (USD Million)
Table 134 Bahrain Commodity Chemical Distribution Market Size, Forecasts, and Trend Analysis, By Product, 2018 - 2030 (USD Million)
Table 135 Bahrain Specialty Chemical Distribution Market Size, Forecasts, and Trend Analysis, By End-use, 2018 - 2030 (USD Million)
Table 136 Bahrain Commodity Chemical Distribution Market Size, Forecasts, and Trend Analysis, By End-use, 2018 - 2030 (USD Million)
Table 137 List of Key Global Players & Recent Developments & Their Impact on the Industry
Table 138 List of Key Manufacturers
Table 139 List of Key Distributors/Channel Partners
Table 140 List of Potential End-users
List of Figures
Fig. 1 Chemical Distribution Market Segmentation & Scope
Fig. 2 Information procurement
Fig. 3 Data analysis models
Fig. 4 Market formulation and validation
Fig. 5 Data validating & publishing
Fig. 6 Chemical Distribution Market Snapshot
Fig. 7 Chemical Distribution Market Segmental Outlook, by Product, 2024 (USD Million)
Fig. 8 Chemical Distribution Market Segmental Outlook, by End-use 2024 (USD Million)
Fig. 9 Chemical distribution market, 2018 - 2030 (USD Million)
Fig. 10 Chemical Distribution Market - Value Chain Analysis
Fig. 11 Chemical Distribution Market - Market Dynamics
Fig. 12 PORTER’S Analysis
Fig. 13 PESTEL Analysis
Fig. 14 Chemical Distribution market revenue share, by product, 2024 & 2030 (USD Million)
Fig. 15 Chemical Distribution market revenue share, by End-use, 2024 & 2030 (USD Million)
Fig. 16 Chemical Distribution revenue market, by region, 2024 & 2030 (USD Million)
Fig. 17 Chemical Distribution Market - Strategy Framework
Market Segmentation
Report content
Qualitative Analysis
Quantitative Analysis
Research Methodology
Grand View Research employs a comprehensive and iterative research methodology focused on minimizing deviance in order to provide the most accurate estimates and forecast possible. The company utilizes a combination of bottom-up and top-down approaches for segmenting and estimating quantitative aspects of the market. In Addition, a recurring theme prevalent across all our research reports is data triangulation that looks market from three different perspectives. Critical elements of the methodology employed for all our studies include:
Preliminary data mining
Raw market data is obtained and collated on a broad front. Data is continuously filtered to ensure that only validated and authenticated sources are considered. In addition, data is also mined from a host of reports in our repository, as well as a number of reputed paid databases. For a comprehensive understanding of the market, it is essential to understand the complete value chain, and in order to facilitate this; we collect data from raw material suppliers, distributors as well as buyers.
Technical issues and trends are obtained from surveys, technical symposia, and trade journals. Technical data is also gathered from an intellectual property perspective, focusing on white space and freedom of movement. Industry dynamics with respect to drivers, restraints, pricing trends are also gathered. As a result, the material developed contains a wide range of original data that is then further cross-validated and authenticated with published sources.
Statistical model
Our market estimates and forecasts are derived through simulation models. A unique model is created customized for each study. Gathered information for market dynamics, technology landscape, application development, and pricing trends are fed into the model and analyzed simultaneously. These factors are studied on a comparative basis, and their impact over the forecast period is quantified with the help of correlation, regression, and time series analysis. Market forecasting is performed via a combination of economic tools, technological analysis, industry experience, and domain expertise.
Econometric models are generally used for short-term forecasting, while technological market models are used for long-term forecasting. These are based on an amalgamation of the technology landscape, regulatory frameworks, economic outlook, and business principles. A bottom-up approach to market estimation is preferred, with key regional markets analyzed as separate entities and integration of data to obtain global estimates. This is critical for a deep understanding of the industry as well as ensuring minimal errors. Some of the parameters considered for forecasting include:
• Market drivers and restraints, along with their current and expected impact
• Raw material scenario and supply v/s price trends
• Regulatory scenario and expected developments
• Current capacity and expected capacity additions up to 2030
We assign weights to these parameters and quantify their market impact using weighted average analysis, to derive an expected market growth rate.
Primary validation
This is the final step in estimating and forecasting for our reports. Exhaustive primary interviews are conducted, face to face as well as over the phone to validate our findings and assumptions used to obtain them. Interviewees are approached from leading companies across the value chain including suppliers, technology providers, domain experts, and buyers so as to ensure a holistic and unbiased picture of the market. These interviews are conducted across the globe, with language barriers overcome with the aid of local staff and interpreters. Primary interviews not only help in data validation but also provide critical insights into the market, current business scenario, and future expectations and enhance the quality of our reports. All our estimates and forecast are verified through exhaustive primary research with Key Industry Participants (KIPs) which typically include:
• Market-leading companies
• Raw material suppliers
• Product distributors
• Buyers
The key objectives of primary research are as follows:
• To validate our data in terms of accuracy and acceptability
• To gain an insight in to the current market and future expectations
Data Collection Matrix
Perspective |
Primary research |
Secondary research |
Supply-side |
|
|
Demand-side |
|
|
Industry Analysis Matrix
Qualitative analysis |
Quantitative analysis |
|
|
NEED A CUSTOM REPORT?
We can customize every report - free of charge - including purchasing stand-alone sections or country-level reports, as well as offer affordable discounts for start-ups & universities. Contact us now
We are GDPR and CCPA compliant! Your transaction & personal information is safe and secure. For more details, please read our privacy policy.
"The quality of research they have done for us has been excellent."