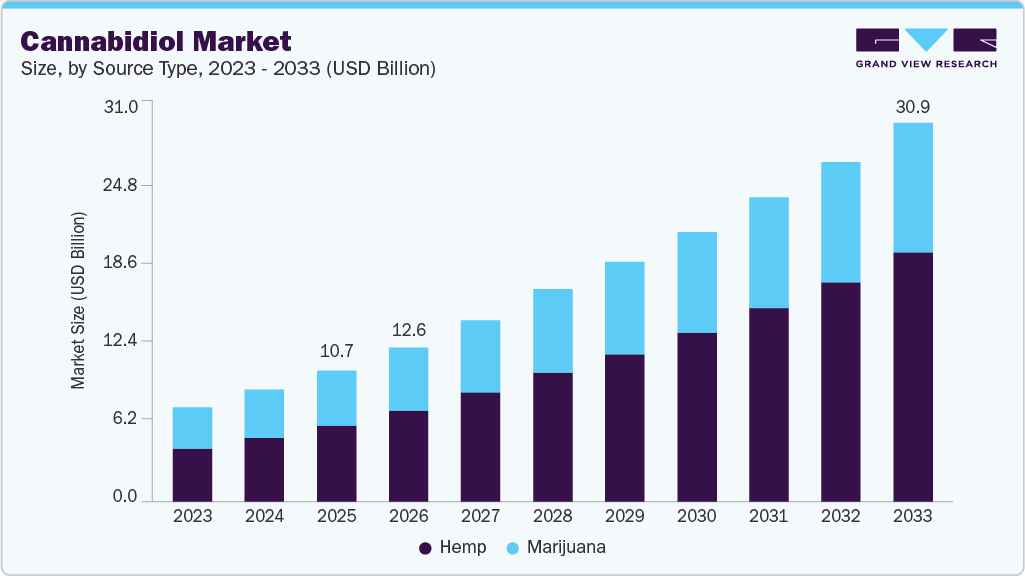
The global cannabidiol market size was valued at USD 7.71 billion in 2023 and is expected to grow at a compound annual growth rate (CAGR) of 15.8% from 2024 to 2030. The CBD market size is expected to grow with the increasing legalization of hemp-based products. Companies are developing a variety of cannabidiol products, including edibles, topicals, and beverages, to meet the demand from consumers. Rise of e-commerce has allowed companies to reach a wider audience and increase sales through online channels, which has positively impacted the CBD industry growth projections.
In addition, growing interest in the potential health benefits of cannabidiol has led to increased investment in research and development to understand its effects better and develop new products. Cannabidiol (CBD) market is becoming more competitive, with a growing number of companies entering the market and offering similar products, which in turn is bolstering the global CBD market size.
Growing recognition of therapeutic benefits of cannabidiol has driven consumers to purchase these products, even if they are expensive. As a result, commercial retailers are now focusing on selling cannabis-based items, which have a higher profit margin. For instance, Abercrombie & Fitch—a clothing retailer—plans to sell CBD-infused body care products in more than 160 of its 250-plus stores. Many health and wellness stores, such as Walgreens Boots Alliance, CVS Health, and Rite Aid, now offer CBD-based products. CBD is a non-psychoactive compound found in the hemp plant and is used in various forms, such as cream, edibles, oils, and tinctures. It is marketed for its potential health benefits, such as reducing anxiety and pain. It has seen a surge in demand due to the increasing legalization and normalization of marijuana and hemp-based products.
It effectively treats conditions such as anxiety, seizures, and pain. Demand for CBD for health and wellness is the primary factor driving the market's growth. Additionally, increasing acceptance and use of these products due to government approvals are expected to increase production and sales. Furthermore, CBD oil is growing in popularity as an ingredient in skincare products for treating acne and wrinkles. For instance, Sephora recently added a line of CBD skincare products to its stores, and Ulta Beauty plans to launch its line of CBD-based products. Many new companies are also entering the market for CBD-infused cosmetic products.
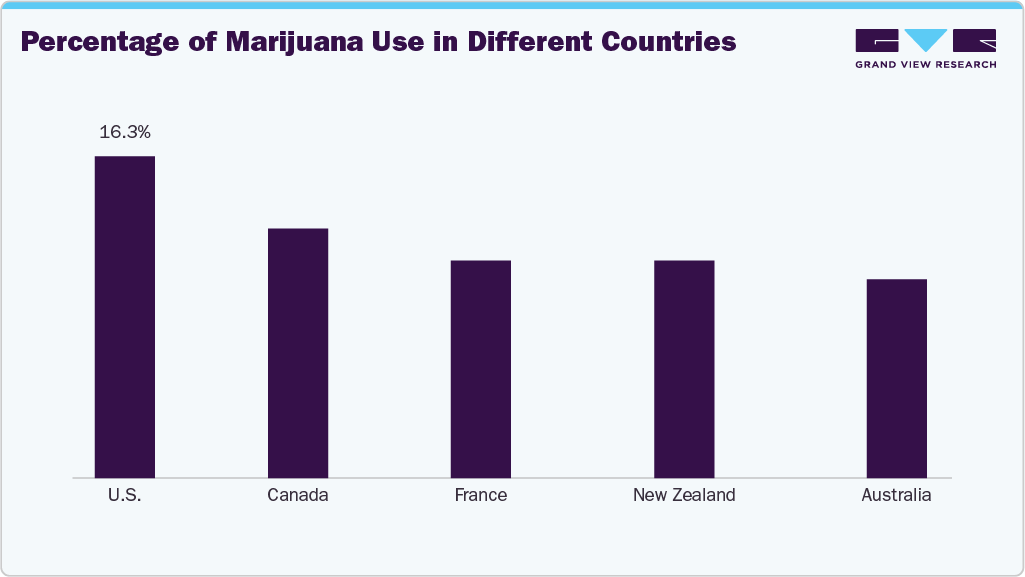
Companies such as Echo Pharmaceuticals have created products such as Arvisol, an oral tablet containing pure cannabinoids for treating conditions such as epilepsy and schizophrenia. Moreover, companies in the market are launching various products and services to maintain a competitive edge. For instance, in December 2021, Avicanna Inc., a biopharmaceutical company specializing in developing and selling cannabinoid-based products made from plants, announced the introduction of the re+PLAY sports recovery brand in partnership with Harrington Wellness. This brand focused on using CBD for sports recovery and was created through a collaboration with NBA veteran Al Harrington, who founded Harrington Wellness.
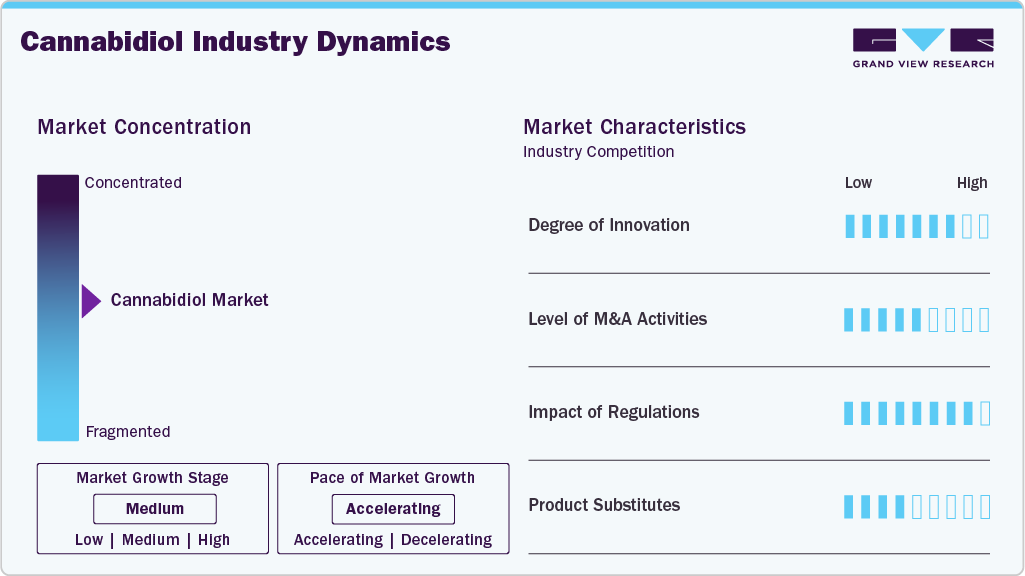
Analyzing the Cannabidiol (CBD) industry statistics, we have derived the market growth stage to be high, and pace of the market growth is accelerating. Cannabidiol market is characterized by a high degree of innovation owing to increased R&D activities on the use of cannabis and its medicinal properties, rising product demand due to its health benefits without intoxication, and increasing preference for cannabis extracts such as oils and tinctures.
Cannabidiol market is also characterized by a medium level of merger and acquisition (M&A) activity by the leading players. Through M&A activity, these companies can expand their product portfolio, enter new territories, and strengthen their market position.For instance, in March 2022, Aurora Cannabis Inc. announced to acquire TerraFarma Inc., a parent company of Thrive Cannabis. This acquisition aims to strengthen Aurora's position in the Canadian market and expand its product portfolio.
Global cannabidiol industry is flourishing owing to the rising number of countries devising a systematic regulatory framework for the cultivation and sale of cannabis. For instance, in August 2022, the Swiss Federal Narcotics Act was amended to utilize cannabis for medical purposes. Wide acceptance and rising awareness of Cannabidiol (CBD) in various countries, majorly for medical purposes, is gaining impetus.
Legalization of cannabis, cannabis-based products, and the popularity of CBD-infused foods are rapidly rising due to the various health benefits associated with CBD. Thus, due to legalization, some market players are expanding their market presence in such areas.
In 2023, hemp segment dominated the market and generated 55.7% of the revenue. This segment is expected to grow fastest due to rising demand from the pharmaceutical industry and growing consumer awareness of health benefits. Legalizing medicinal cannabis and growing consumer disposable income is also expected to boost the demand for cannabidiol in the pharmaceutical sector. High demand for CBD products includes oils, tinctures, concentrates, capsules, topical solutions such as salves, lip balms, lotions, and edibles like baked goods, coffee, chocolate, gum, and candies.
Furthermore, uses CBD derived from hemp is growing quickly because of its abilities to fight inflammation, aging, and act as an antioxidant. Various industries such as pharmaceuticals, personal care products, nutraceuticals, and food and beverage companies are creating products that use CBD for health and wellness reasons. Due to these factors, the segment is expected to experience significant growth in the future.
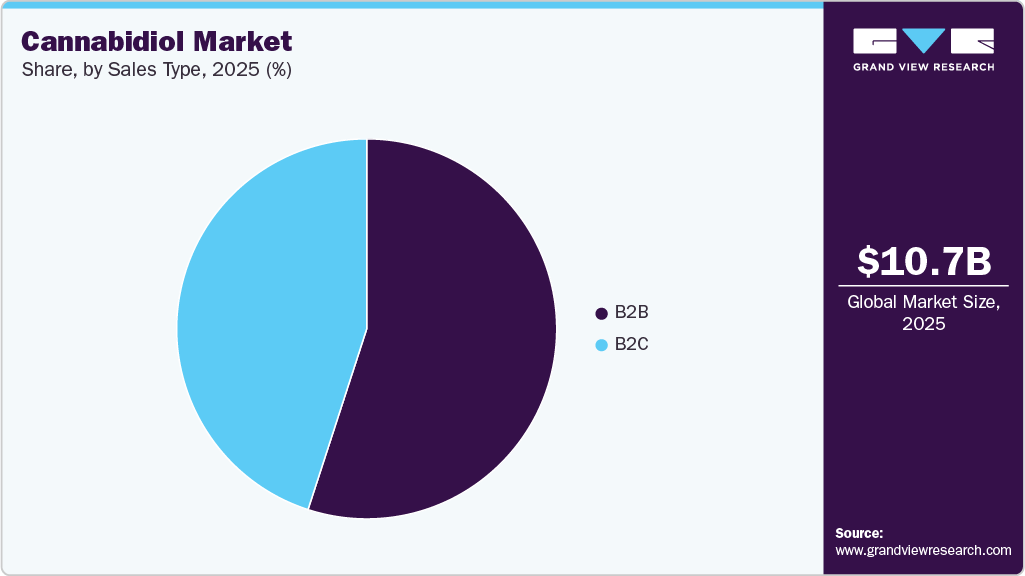
B2B segment dominated the market and accounted for the largest revenue share in 2023. This segment is anticipated to grow at fastest CAGR over the forecast period, owing to rise in the number of wholesalers offering CBD oil and the growing demand for CBD oil as a raw material. Additionally, legalization of CBD products in various countries has opened more opportunities for supplying these products due to the expanding consumer base.
The sub-segment of hospital pharmacies within the B2C segment is expected to experience significant growth over the forecast period. This growth is due to rise in companies partnering with retail pharmacies to improve their exposure and establish a dedicated space for customers to purchase CBD products. Moreover, the market is anticipated to offer ample opportunities for market participants due to the increase in pharmacies stocking up on the products, formation of exclusive partnerships between companies and retail pharmacies, and growing number of patients choosing CBD as a treatment option.
In B2B end use, pharmaceuticals segment accounted for a largest revenue share in 2023. The segment is expected to see substantial growth over the forecast period. A growing number of clinical trials to assess the effects of CBD on various health conditions is likely to fuel demand for these products over the forecast period. In addition, many companies purchase bulk CBD oil and produce CBD-infused products that consumers widely used as an alternative for managing pain and stress. As a result, these products are likely to be in a growth phase in the market.
Pharmaceutical segment is expected to experience the quickest expansion over the forecast period. The transformation of cannabidiol from herbal remedies to prescription drugs is expected to drive market growth. Additionally, growing recognition of the medical benefits of cannabidiol, including its therapeutic properties, is expected to fuel demand for these products in the pharmaceutical sector.
In 2023, North America dominated the market with a revenue share of 87.4%. North America is expected to experience significant growth in the cannabidiol market due to several factors, such as a large number of health-conscious individuals, growing acceptance of CBD products, the presence of major manufacturers, and the approval of the U.S. Farm Bill in 2020. The region is considered the most advanced in cannabis and its products, including cannabidiol, with the highest number of CBD companies and favorable laws regarding the use of CBD products. In addition, growing awareness amongst the American citizens towards the multiple benefits associated with cannabidiol is boosting the U.S. CBD market.
Europe is expected to witness fastest growth over the forecast period. Increasing awareness concerning the health benefits among consumers, easy availability, and affordable prices have resulted in the increased popularity of CBD oil in this region. Increasing awareness concerning the health benefits among consumers, easy availability, and affordable prices have resulted in the increased popularity of CBD oil in the UK. Furthermore, CBD oil is often used in personal care products such as shampoos, creams, and lotions. The products offered at stores comprise a low percentage of CBD and are mixed with other substances. CBD is marketed in various forms, namely CBD capsules, CBD edibles, CBD hemp oil, and CBD vaping e-liquid. For instance, under Ambiance Cosmetics, Eos Scientific launched six lines of CBD-instilled cosmetics, including oils, balms, and moisturizers.
Asia Pacific is anticipated to record significant growth over the forecast period due to establishment of hemp production facilities, particularly in China. China is the leading hemp grower in Asia, producing nearly half of the world's hemp. It exports around 90% of its products to the U.S., Germany, the U.K., the Netherlands, and Japan and has started growing hemp in three provinces for CBD extraction purposes. The new government policies supporting the industry, low CBD production costs, and unique large-scale manufacturing infrastructure and expertise are anticipated to create intense competition for hemp companies in the U.S., Canada, and the European Union with low-cost CBD supplies.
Some of the key players operating in the market include ENDOCA, Cannoid, LLC, Medical Marijuana, Inc., Canopy Growth Corporation and Folium Europe B.V
ENDOCA primarily manufactures and distributes pharmaceutical-grade hemp-derived cannabidiol (CBD) products across the globe. The vertically integrated company is involved in cultivating, processing, extracting, and selling CBD products.
Cannoid, LLC produces hemp-based therapeutics and works on a contract basis. The company’s primary focus is on cannabinoid oil encapsulation. It offers softgels for various purposes. Its product portfolio includes soft gels with Cannabidivarin (CBDV) for neuromodulation, soft gels with controlled Cannabidiolic Acid (CBDA), and Cannabigerolic Acid (CBGA) fractions intended for immunity.
NuLeaf Naturals, LLC, Isodiol International Inc., PharmaHemp, and The Cronos Group Cannoid, LLC, are some of the emerging market participants in the cannabidiol market.
NuLeaf Naturals, LLC manufactures and distributes hemp-derived CBD products in the U.S. market. The company provides wholesale, lab-tested, and organic CBD oil & extracts to its consumers in the global market.
PharmaHemp produces and supplies a range of Cannabidiol (CBD) products. The company provides a range of CBD products under its brand “PharmaHemp CBD.”
In January 2023, Medical Marijuana, Inc. announced that HempMeds Brasil, its subsidiary, had launched 2 new full-spectrum products in Brazil. The concentrations range from 3,000-6,000 mg and are available in 30 mL and 60 mL jars.
In October 2022, Medical Marijuana, Inc. announced the collaboration of its subsidiary, HempMeds Mexico, with the Autonomous University of Barcelona, Spain, and the Meritorious Autonomous University of Puebla, Mexico to conduct a study demonstrating the benefits of CBD in treating Parkinson’s disease.
In October 2022, High Tide, Inc. announced the launch of multi-cannabinoid products by its subsidiary, NuLeaf Naturals, in Ontario, Canada. The products listed for sale include Full Spectrum Hemp Multicannabinoid oil and plant-based softgels with delta-9 tetrahydrocannabinol, cannabichromene, cannabidiol, cannabigerol, and cannabinol.
In September 2022, Kannaway, a subsidiary of Medical Marijuana, Inc., announced a distribution agreement with Complete Hemp Technologies (CHT), a long-time partner, regarding the expansion of its capabilities in Europe. As per the agreement, CHT added warehousing and daily operations to the services it already offers to Kannaway in the region.
In January 2022, Elixinol announced the launch of 2 innovative CBD products - the Sleep Rapid Rest Liposome and Sleep Gummies - that focus on offering support for sleep. The former contains a customized formula of CBN (cannabinol), CBD, chamomile, and lemon balm. On the other hand, the Sleep Gummy contains 2mg CBN and 15mg CBD.
Report Attribute |
Details |
Market size value in 2024 |
USD 9.14 billion |
Revenue forecast in 2030 |
USD 22.05 billion |
Growth rate |
CAGR of 15.8% from 2024 to 2030 |
Actual data |
2018 - 2023 |
Forecast data |
2024 - 2030 |
Quantitative units |
Revenue in USD million/billion and CAGR from 2024 to 2030 |
Report coverage |
Revenue forecast, company share, competitive landscape, growth factors, and trends |
Segments covered |
Source type, sales type, end-use, region |
Regional scope |
North America; Europe; Asia Pacific; Latin America; MEA |
Country Scope |
U.S.; Canada; U.K.; Germany; Netherlands; Switzerland; Italy; France; Poland; Czech Republic; Croatia; China; Japan; India; South Korea; New Zealand; Australia; Brazil; Argentina; Mexico; Colombia; Uruguay; Chile; South Africa; Israel |
Key Companies Profiled |
ENDOCA; Cannoid, LLC; Medical Marijuana, Inc.; Folium Europe B.V.; Canopy Growth Corporation; Elixinol; NuLeaf Naturals, LLC; Isodiol International, Inc.; PharmaHemp; The Cronos Group |
Customization scope |
Free report customization (equivalent to up to 8 analyst’s working days) with purchase. Addition or alteration to country, regional & segment scope. |
Pricing and purchase options |
Avail customized purchase options to meet your exact research needs. Explore purchase options |
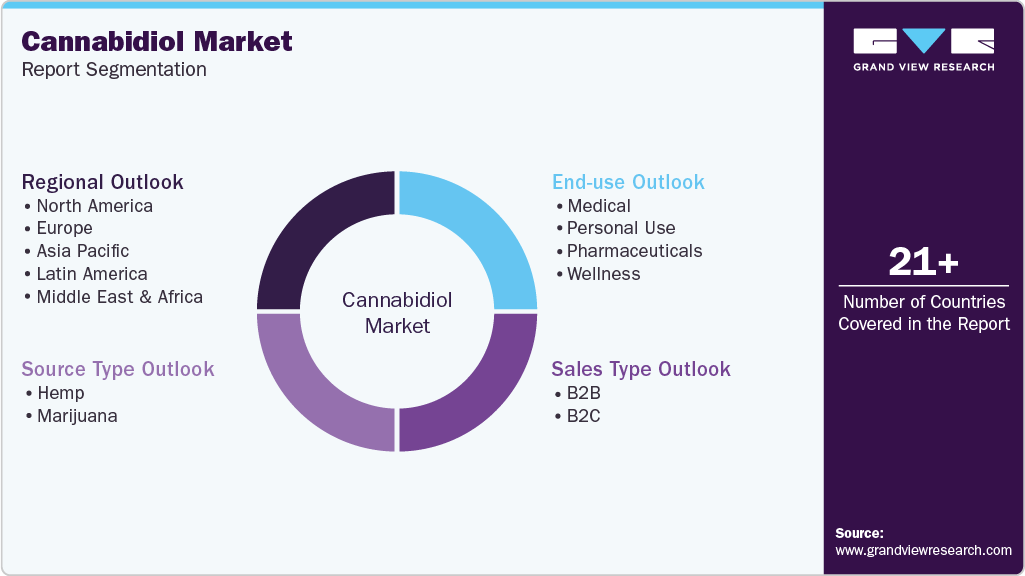
This report forecasts revenue growth at global, regional, and country levels and provides an analysis of the latest industry trends in each of the sub-segments from 2018 to 2030. For the purpose of this study, Grand View Research has segmented the global cannabidiol market on the basis of source type, sales type, end-use, and region:
Source Type Outlook (Revenue, USD Million, 2018 - 2030)
Hemp
Marijuana
Sales Type Outlook (Revenue, USD Million, 2018 - 2030)
B2B
By End-use
Pharmaceuticals
Wellness
Food & Beverages
Personal Care & Cosmetics
Nutraceuticals
Others
B2C
By Sales Channel
Hospital Pharmacies
Online
Retail Stores
By End-use
Medical
Chronic Pain
Mental Disorders
Cancer
Others
Personal Use
End-use Outlook (Revenue, USD Million, 2018 - 2030)
Medical
Chronic Pain
Mental Disorders
Cancer
Others
Personal Use
Pharmaceuticals
Wellness
Food & Beverages
Personal Care & Cosmetics
Nutraceuticals
Others
Regional Outlook (Revenue, USD Million, 2018 - 2030)
North America
U.S.
Canada
Europe
U.K.
Germany
Netherlands
Switzerland
Italy
France
Poland
Czech Republic
Croatia
Asia Pacific
China
India
South Korea
Japan
New Zealand
Australia
Latin America
Argentina
Brazil
Mexico
Colombia
Uruguay
Chile
Middle East & Africa (MEA)
Israel
South Africa
b. The global cannabidiol market size was estimated at USD 7.71 billion in 2023 and is expected to reach USD 9.14 billion in 2024.
b. The global cannabidiol market is expected to grow at a compound annual growth rate of 15.8% from 2024 to 2030 to reach USD 22.05 billion by 2030.
b. Hemp segment dominated the CBD market and accounted for a revenue share of over 55.7% in 2023. This is attributable to the high availability of hemp-derived products in dispensaries, government-approved pharmacies, and stores.
b. Some key players operating in the cannabidiol market include ENDOCA; Isodiol International, Inc.; Medical Marijuana, Inc.; Cannoid, LLC; Elixinol; Folium Biosciences; NuLeaf Naturals, LLC; and Pharmahemp d.o.o.
b. Key factors that are driving the CBD market growth include increasing demand for cannabidiol (CBD) for medical and wellness purposes owing to its healing properties.
Table of Contents
Chapter 1. Cannabidiol Market: Methodology and Scope
1.1. Market Segmentation & Scope
1.2. Segment Definitions
1.2.1. Source type
1.2.2. Sales type
1.2.3. End use
1.2.4. Estimates and forecasts timeline
1.3. Research Methodology
1.4. Information Procurement
1.4.1. Purchased database
1.4.2. GVR’s internal database
1.4.3. Secondary sources
1.4.4. Primary research
1.4.5. Details of primary research
1.5. Information or Data Analysis
1.5.1. Data analysis models
1.6. Market Formulation & Validation
1.7. Model Details
1.7.1. Commodity flow analysis (Model 1)
1.7.2. Approach 1: Commodity flow approach
1.7.3. Volume price analysis (Model 2)
1.7.4. Approach 2: Volume price analysis
1.8. List of Secondary Sources
1.9. List of Primary Sources
1.10. Objectives
Chapter 2. Cannabidiol Market: Executive Summary
2.1. Market Outlook
2.2. Segment Outlook
2.2.1. Source type outlook
2.2.2. Sales type outlook
2.2.3. End use outlook
2.2.4. Regional outlook
2.3. Competitive Insights
Chapter 3. Cannabidiol Market: Variables, Trends & Scope
3.1. Market Lineage Outlook
3.1.1. Parent market outlook
3.1.2. Related/ancillary market outlook
3.2. Cannabis Regulatory Scenario, By Country
3.2.1. U.S.
3.2.1.1. Cultivation/Production
3.2.1.2. Legal Status (CBD & THC)
3.2.1.3. Regulatory Bodies Involved
3.2.2. Canada
3.2.2.1. Cultivation/Production
3.2.2.2. Legal Status (CBD & THC)
3.2.2.3. Regulatory Bodies Involved
3.2.3. Germany
3.2.3.1. Cultivation/Production
3.2.3.2. Legal Status (CBD & THC)
3.2.3.3. Regulatory Bodies Involved
3.2.4. Italy
3.2.4.1. Cultivation/Production
3.2.4.2. Legal Status (CBD & THC)
3.2.4.3. Regulatory Bodies Involved
3.2.5. Croatia
3.2.5.1. Cultivation/Production
3.2.5.2. Legal Status (CBD & THC)
3.2.5.3. Regulatory Bodies Involved
3.2.6. Netherlands
3.2.6.1. Cultivation/Production
3.2.6.2. Legal Status (CBD & THC)
3.2.6.3. Regulatory Bodies Involved
3.2.7. Czech Republic
3.2.7.1. Cultivation/Production
3.2.7.2. Legal Status (CBD & THC)
3.2.7.3. Regulatory Bodies Involved
3.2.8. Poland
3.2.8.1. Cultivation/Production
3.2.8.2. Legal Status (CBD & THC)
3.2.8.3. Regulatory Bodies Involved
3.2.9. Switzerland
3.2.9.1. Cultivation/Production
3.2.9.2. Legal Status (CBD & THC)
3.2.9.3. Regulatory Bodies Involved
3.2.10. Australia
3.2.10.1. Cultivation/Production
3.2.10.2. Legal Status (CBD & THC)
3.2.10.3. Regulatory Bodies Involved
3.2.11. Israel
3.2.11.1. Cultivation/Production
3.2.11.2. Legal Status (CBD & THC)
3.2.11.3. Regulatory Bodies Involved
3.2.12. Uruguay
3.2.12.1. Cultivation/Production
3.2.12.2. Legal Status (CBD & THC)
3.2.12.3. Regulatory Bodies Involved
3.2.13. Colombia
3.2.13.1. Cultivation/Production
3.2.13.2. Legal Status (CBD & THC)
3.2.13.3. Regulatory Bodies Involved
3.2.14. Argentina
3.2.14.1. Cultivation/Production
3.2.14.2. Legal Status (CBD & THC)
3.2.14.3. Regulatory Bodies Involved
3.2.15. Chile
3.2.15.1. Cultivation/Production
3.2.15.2. Legal Status (CBD & THC)
3.2.15.3. Regulatory Bodies Involved
3.3. Market Dynamics
3.3.1. Market driver analysis
3.3.2. Market restraint analysis
3.4. Cannabidiol Market Analysis Tools
3.4.1. Industry Analysis - Porter’s
3.4.1.1. Supplier power
3.4.1.2. Buyer power
3.4.1.3. Substitution threat
3.4.1.4. Threat of new entrant
3.4.1.5. Competitive rivalry
3.4.2. PESTEL Analysis
3.4.2.1. Political landscape
3.4.2.2. Technological landscape
3.4.2.3. Economic landscape
3.5. Import/Export Scenario, by Country
3.5.1. U.S.
3.5.2. Canada
3.5.3. Germany
3.5.4. Italy
3.5.5. France
3.5.6. Croatia
3.5.7. Netherlands
3.5.8. Czech Republic
3.5.9. Poland
3.5.10. Switzerland
3.5.11. Uruguay
3.5.12. Columbia
3.5.13. Brazil
3.5.14. Argentina
3.5.15. Chile
3.5.16. Australia
3.5.17. China
3.5.18. India
3.5.19. Japan
3.5.20. New Zealand
3.5.21. South Korea
Chapter 4. Cannabidiol Market: Source Type Estimates & Trend Analysis
4.1. Source Type Market Share, 2023 & 2030
4.2. Segment Dashboard
4.3. Global Cannabidiol Market by Source Type Outlook
4.4. Market Size & Forecasts and Trend Analyses, 2018 to 2030 for the following
4.4.1. Hemp
4.4.1.1. Market estimates and forecasts 2018 to 2030 (USD Million)
4.4.2. Marijuana
4.4.2.1. Market estimates and forecasts 2018 to 2030 (USD Million)
Chapter 5. Cannabidiol Market: Sales Type Estimates & Trend Analysis
5.1. Sales Type Market Share, 2023 & 2030
5.2. Segment Dashboard
5.3. Global Cannabidiol Market by Sales Type Outlook
5.4. Market Size & Forecasts and Trend Analyses, 2018 to 2030 for the following
5.4.1. Business to Business (B2B)
5.4.1.1. Market estimates and forecasts 2018 to 2030 (USD Million)
5.4.2. Business to Consumer (B2C)
5.4.2.1. Hospital Pharmacies
5.4.2.1.1. Market estimates and forecasts 2018 to 2030 (USD Million)
5.4.2.2. Online Stores
5.4.2.2.1. Market estimates and forecasts 2018 to 2030 (USD Million)
5.4.2.3. Retail Stores
5.4.2.3.1. Market estimates and forecasts 2018 to 2030 (USD Million)
Chapter 6. Cannabidiol Market: End Use Estimates & Trend Analysis
6.1. End Use Market Share, 2023 & 2030
6.2. Segment Dashboard
6.3. Global Cannabidiol Market by End Use Outlook
6.4. Market Size & Forecasts and Trend Analyses, 2018 to 2030 for the following
6.4.1. Medical
6.4.1.1. Chronic Pain
6.4.1.1.1. Market estimates and forecasts 2018 to 2030 (USD million)
6.4.1.2. Mental Disorders
6.4.1.2.1. Market estimates and forecasts 2018 to 2030 (USD million)
6.4.1.3. Cancer
6.4.1.3.1. Market estimates and forecasts 2018 to 2030 (USD million)
6.4.1.4. Others
6.4.1.4.1. Market estimates and forecasts 2018 to 2030 (USD million)
6.4.2. Personal Use
6.4.2.1. Market estimates and forecasts 2018 to 2030 (USD Million)
6.4.3. Pharmaceutical
6.4.3.1. Market estimates and forecasts 2018 to 2030 (USD Million)
6.4.4. Wellness
6.4.4.1. Market estimates and forecasts 2018 to 2030 (USD Million)
6.4.4.2. Food & Beverages
6.4.4.2.1. Market estimates and forecasts 2018 to 2030 (USD million)
6.4.4.3. Personal Care & Cosmetics
6.4.4.3.1. Market estimates and forecasts 2018 to 2030 (USD million)
6.4.4.4. Nutraceuticals
6.4.4.4.1. Market estimates and forecasts 2018 to 2030 (USD million)
6.4.4.5. Others
6.4.4.5.1. Market estimates and forecasts 2018 to 2030 (USD million)
Chapter 7. Cannabidiol Market: Regional Estimates & Trend Analysis
7.1. Regional Market Share Analysis, 2023 & 2030
7.2. Regional Market Dashboard
7.3. Global Regional Market Snapshot
7.4. Market Size, & Forecasts Trend Analysis, 2018 to 2030:
7.5. North America
7.5.1. U.S.
7.5.1.1. Key country dynamics
7.5.1.2. Regulatory framework
7.5.1.3. Competitive Scenario
7.5.1.4. U.S. market estimates and forecasts 2018 to 2030 (USD Million)
7.5.2. Canada
7.5.2.1. Key country dynamics
7.5.2.2. Regulatory framework
7.5.2.3. Competitive Scenario
7.5.2.4. Canada market estimates and forecasts 2018 to 2030 (USD Million)
7.6. Europe
7.6.1. UK
7.6.1.1. Key country dynamics
7.6.1.2. Regulatory framework
7.6.1.3. Competitive Scenario
7.6.1.4. UK market estimates and forecasts 2018 to 2030 (USD Million)
7.6.2. Germany
7.6.2.1. Key country dynamics
7.6.2.2. Regulatory framework
7.6.2.3. Competitive Scenario
7.6.2.4. Germany market estimates and forecasts 2018 to 2030 (USD Million)
7.6.3. France
7.6.3.1. Key country dynamics
7.6.3.2. Regulatory framework
7.6.3.3. Competitive Scenario
7.6.3.4. France market estimates and forecasts 2018 to 2030 (USD Million)
7.6.4. Italy
7.6.4.1. Key country dynamics
7.6.4.2. Regulatory framework
7.6.4.3. Competitive Scenario
7.6.4.4. Italy market estimates and forecasts 2018 to 2030 (USD Million)
7.6.5. Switzerland
7.6.5.1. Key country dynamics
7.6.5.2. Regulatory framework
7.6.5.3. Competitive Scenario
7.6.5.4. Spain market estimates and forecasts 2018 to 2030 (USD Million)
7.6.6. The Netherlands
7.6.6.1. Key country dynamics
7.6.6.2. Regulatory framework
7.6.6.3. Competitive Scenario
7.6.6.4. Norway market estimates and forecasts 2018 to 2030 (USD Million)
7.6.7. Poland
7.6.7.1. Key country dynamics
7.6.7.2. Regulatory framework
7.6.7.3. Competitive Scenario
7.6.7.4. Sweden market estimates and forecasts 2018 to 2030 (USD Million)
7.6.8. Czech Republic
7.6.8.1. Key country dynamics
7.6.8.2. Regulatory framework
7.6.8.3. Competitive Scenario
7.6.8.4. Denmark market estimates and forecasts 2018 to 2030 (USD Million)
7.6.9. Croatia
7.6.9.1. Key country dynamics
7.6.9.2. Regulatory framework
7.6.9.3. Competitive Scenario
7.6.9.4. Denmark market estimates and forecasts 2018 to 2030 (USD Million)
7.7. Asia Pacific
7.7.1. Japan
7.7.1.1. Key country dynamics
7.7.1.2. Regulatory framework
7.7.1.3. Competitive Scenario
7.7.1.4. Japan market estimates and forecasts 2018 to 2030 (USD Million)
7.7.2. China
7.7.2.1. Key country dynamics
7.7.2.2. Regulatory framework
7.7.2.3. Competitive Scenario
7.7.2.4. China market estimates and forecasts 2018 to 2030 (USD Million)
7.7.3. India
7.7.3.1. Key country dynamics
7.7.3.2. Regulatory framework
7.7.3.3. Competitive Scenario
7.7.3.4. India market estimates and forecasts 2018 to 2030 (USD Million)
7.7.4. Australia
7.7.4.1. Key country dynamics
7.7.4.2. Regulatory framework
7.7.4.3. Competitive Scenario
7.7.4.4. Australia market estimates and forecasts 2018 to 2030 (USD Million)
7.7.5. South Korea
7.7.5.1. Key country dynamics
7.7.5.2. Regulatory framework
7.7.5.3. Competitive Scenario
7.7.5.4. South Korea market estimates and forecasts 2018 to 2030 (USD Million)
7.7.6. New Zealand
7.7.6.1. Key country dynamics
7.7.6.2. Regulatory framework
7.7.6.3. Competitive Scenario
7.7.6.4. Thailand market estimates and forecasts 2018 to 2030 (USD Million)
7.8. Latin America
7.8.1. Brazil
7.8.1.1. Key country dynamics
7.8.1.2. Regulatory framework
7.8.1.3. Competitive Scenario
7.8.1.4. Brazil market estimates and forecasts 2018 to 2030 (USD Million)
7.8.2. Mexico
7.8.2.1. Key country dynamics
7.8.2.2. Regulatory framework
7.8.2.3. Competitive Scenario
7.8.2.4. Mexico market estimates and forecasts 2018 to 2030 (USD Million)
7.8.3. Argentina
7.8.3.1. Key country dynamics
7.8.3.2. Regulatory framework
7.8.3.3. Competitive Scenario
7.8.3.4. Argentina market estimates and forecasts 2018 to 2030 (USD Million)
7.8.4. Colombia
7.8.4.1. Key country dynamics
7.8.4.2. Regulatory framework
7.8.4.3. Competitive Scenario
7.8.4.4. Argentina market estimates and forecasts 2018 to 2030 (USD Million)
7.8.5. Uruguay
7.8.5.1. Key country dynamics
7.8.5.2. Regulatory framework
7.8.5.3. Competitive Scenario
7.8.5.4. Argentina market estimates and forecasts 2018 to 2030 (USD Million)
7.8.6. Chile
7.8.6.1. Key country dynamics
7.8.6.2. Regulatory framework
7.8.6.3. Competitive Scenario
7.8.6.4. Argentina market estimates and forecasts 2018 to 2030 (USD Million)
7.9. MEA
7.9.1. South Africa
7.9.1.1. Key country dynamics
7.9.1.2. Regulatory framework
7.9.1.3. Competitive Scenario
7.9.1.4. South Africa market estimates and forecasts 2018 to 2030 (USD Million)
7.9.2. Israel
7.9.2.1. Key country dynamics
7.9.2.2. Regulatory framework
7.9.2.3. Competitive Scenario
7.9.2.4. UAE market estimates and forecasts 2018 to 2030 (USD Million)
Chapter 8. Competitive Landscape
8.1. Recent Developments & Impact Analysis, By Key Market Participants
8.2. Company/Competition Categorization
8.3. Vendor Landscape
8.3.1. ENDOCA
8.3.1.1. Company news
8.3.1.2. Financial performance
8.3.1.3. Product benchmarking
8.3.1.4. Strategic initiatives
8.3.2. Cannoid, LLC
8.3.2.1. Company news
8.3.2.2. Financial performance
8.3.2.3. Product benchmarking
8.3.2.4. Strategic initiatives
8.3.3. Medical Marijuana, Inc.
8.3.3.1. Company news
8.3.3.2. Financial performance
8.3.3.3. Product benchmarking
8.3.3.4. Strategic initiatives
8.3.4. Folium Europe B.V.
8.3.4.1. Company news
8.3.4.2. Financial performance
8.3.4.3. Product benchmarking
8.3.4.4. Strategic initiatives
8.3.5. Canopy Growth Corporation
8.3.5.1. Company news
8.3.5.2. Financial performance
8.3.5.3. Product benchmarking
8.3.5.4. Strategic initiatives
8.3.6. Elixinol
8.3.6.1. Company news
8.3.6.2. Financial performance
8.3.6.3. Product benchmarking
8.3.6.4. Strategic initiatives
8.3.7. NuLeaf Naturals, LLC
8.3.7.1. Company news
8.3.7.2. Financial performance
8.3.7.3. Product benchmarking
8.3.7.4. Strategic initiatives
8.3.8. Isodiol International, Inc.
8.3.8.1. Company news
8.3.8.2. Financial performance
8.3.8.3. Product benchmarking
8.3.8.4. Strategic initiatives
8.3.9. PharmaHemp
8.3.9.1. Company news
8.3.9.2. Financial performance
8.3.9.3. Product benchmarking
8.3.9.4. Strategic initiatives
8.3.10. The Cronos Group
8.3.10.1. Company news
8.3.10.2. Financial performance
8.3.10.3. Product benchmarking
8.3.10.4. Strategic initiatives
List of Tables
Table 1 List of abbreviation
Table 2 North America cannabidiol market, by region, 2018 - 2030 (USD Million)
Table 3 North America cannabidiol market, by source type, 2018 - 2030 (USD Million)
Table 4 North America cannabidiol market, by sales type, 2018 - 2030 (USD Million)
Table 5 North America cannabidiol market, by end use, 2018 - 2030 (USD Million)
Table 6 U.S. cannabidiol market, by source type, 2018 - 2030 (USD Million)
Table 7 U.S. cannabidiol market, by sales type, 2018 - 2030 (USD Million)
Table 8 U.S. cannabidiol market, by end use, 2018 - 2030 (USD Million)
Table 9 Canada cannabidiol market, by source type, 2018 - 2030 (USD Million)
Table 10 Canada cannabidiol market, by sales type, 2018 - 2030 (USD Million)
Table 11 Canada cannabidiol market, by end use, 2018 - 2030 (USD Million)
Table 12 Europe cannabidiol market, by region, 2018 - 2030 (USD Million)
Table 13 Europe cannabidiol market, by source type, 2018 - 2030 (USD Million)
Table 14 Europe cannabidiol market, by sales type, 2018 - 2030 (USD Million)
Table 15 Europe cannabidiol market, by end use, 2018 - 2030 (USD Million)
Table 16 Germany cannabidiol market, by source type, 2018 - 2030 (USD Million)
Table 17 Germany cannabidiol market, by sales type, 2018 - 2030 (USD Million)
Table 18 Germany cannabidiol market, by end use, 2018 - 2030 (USD Million)
Table 19 UK cannabidiol market, by source type, 2018 - 2030 (USD Million)
Table 20 UK cannabidiol market, by sales type, 2018 - 2030 (USD Million)
Table 21 UK cannabidiol market, by end use, 2018 - 2030 (USD Million)
Table 22 France cannabidiol market, by source type, 2018 - 2030 (USD Million)
Table 23 France cannabidiol market, by sales type, 2018 - 2030 (USD Million)
Table 24 France cannabidiol market, by end use, 2018 - 2030 (USD Million)
Table 25 Italy cannabidiol market, by source type, 2018 - 2030 (USD Million)
Table 26 Italy cannabidiol market, by sales type, 2018 - 2030 (USD Million)
Table 27 Italy cannabidiol market, by end use, 2018 - 2030 (USD Million)
Table 28 Switzerland cannabidiol market, by source type, 2018 - 2030 (USD Million)
Table 29 Switzerland cannabidiol market, by sales type, 2018 - 2030 (USD Million)
Table 30 Switzerland cannabidiol market, by end use, 2018 - 2030 (USD Million)
Table 31 Poland cannabidiol market, by source type, 2018 - 2030 (USD Million)
Table 32 Poland cannabidiol market, by sales type, 2018 - 2030 (USD Million)
Table 33 Poland cannabidiol market, by end use, 2018 - 2030 (USD Million)
Table 34 The Netherlands cannabidiol market, by source type, 2018 - 2030 (USD Million)
Table 35 The Netherlands cannabidiol market, by sales type, 2018 - 2030 (USD Million)
Table 36 The Netherlands cannabidiol market, by end use, 2018 - 2030 (USD Million)
Table 37 Czech Republic cannabidiol market, by source type, 2018 - 2030 (USD Million)
Table 38 Czech Republic cannabidiol market, by sales type, 2018 - 2030 (USD Million)
Table 39 Czech Republic cannabidiol market, by end use, 2018 - 2030 (USD Million)
Table 40 Croatia cannabidiol market, by source type, 2018 - 2030 (USD Million)
Table 41 Croatia cannabidiol market, by sales type, 2018 - 2030 (USD Million)
Table 42 Croatia cannabidiol market, by end use, 2018 - 2030 (USD Million)
Table 43 Asia Pacific cannabidiol market, by region, 2018 - 2030 (USD Million)
Table 44 Asia Pacific cannabidiol market, by source type, 2018 - 2030 (USD Million)
Table 45 Asia Pacific cannabidiol market, by sales type, 2018 - 2030 (USD Million)
Table 46 Asia Pacific cannabidiol market, by end use, 2018 - 2030 (USD Million)
Table 47 China cannabidiol market, by source type, 2018 - 2030 (USD Million)
Table 48 China cannabidiol market, by sales type, 2018 - 2030 (USD Million)
Table 49 China cannabidiol market, by end use, 2018 - 2030 (USD Million)
Table 50 Japan cannabidiol market, by source type, 2018 - 2030 (USD Million)
Table 51 Japan cannabidiol market, by sales type, 2018 - 2030 (USD Million)
Table 52 Japan cannabidiol market, by end use, 2018 - 2030 (USD Million)
Table 53 India cannabidiol market, by source type, 2018 - 2030 (USD Million)
Table 54 India cannabidiol market, by sales type, 2018 - 2030 (USD Million)
Table 55 India cannabidiol market, by end use, 2018 - 2030 (USD Million)
Table 56 South Korea cannabidiol market, by source type, 2018 - 2030 (USD Million)
Table 57 South Korea cannabidiol market, by sales type, 2018 - 2030 (USD Million)
Table 58 South Korea cannabidiol market, by end use, 2018 - 2030 (USD Million)
Table 59 Australia cannabidiol market, by source type, 2018 - 2030 (USD Million)
Table 60 Australia cannabidiol market, by sales type, 2018 - 2030 (USD Million)
Table 61 Australia cannabidiol market, by end use, 2018 - 2030 (USD Million)
Table 62 New Zealand cannabidiol market, by source type, 2018 - 2030 (USD Million)
Table 63 New Zealand cannabidiol market, by sales type, 2018 - 2030 (USD Million)
Table 64 New Zealand cannabidiol market, by end use, 2018 - 2030 (USD Million)
Table 65 Latin America cannabidiol market, by source type, 2018 - 2030 (USD Million)
Table 66 Latin America cannabidiol market, by sales type, 2018 - 2030 (USD Million)
Table 67 Latin America cannabidiol market, by end use, 2018 - 2030 (USD Million)
Table 68 Brazil cannabidiol market, by source type, 2018 - 2030 (USD Million)
Table 69 Brazil cannabidiol market, by sales type, 2018 - 2030 (USD Million)
Table 70 Brazil cannabidiol market, by end use, 2018 - 2030 (USD Million)
Table 71 Mexico cannabidiol market, by source type, 2018 - 2030 (USD Million)
Table 72 Mexico cannabidiol market, by sales type, 2018 - 2030 (USD Million)
Table 73 Mexico cannabidiol market, by end use, 2018 - 2030 (USD Million)
Table 74 Argentina cannabidiol market, by source type, 2018 - 2030 (USD Million)
Table 75 Argentina cannabidiol market, by sales type, 2018 - 2030 (USD Million)
Table 76 Argentina cannabidiol market, by end use, 2018 - 2030 (USD Million)
Table 77 Colombia cannabidiol market, by source type, 2018 - 2030 (USD Million)
Table 78 Colombia cannabidiol market, by sales type, 2018 - 2030 (USD Million)
Table 79 Colombia cannabidiol market, by end use, 2018 - 2030 (USD Million)
Table 80 Uruguay cannabidiol market, by source type, 2018 - 2030 (USD Million)
Table 81 Uruguay cannabidiol market, by sales type, 2018 - 2030 (USD Million)
Table 82 Uruguay cannabidiol market, by end use, 2018 - 2030 (USD Million)
Table 83 Chile cannabidiol market, by source type, 2018 - 2030 (USD Million)
Table 84 Chile cannabidiol market, by sales type, 2018 - 2030 (USD Million)
Table 85 Chile cannabidiol market, by end use, 2018 - 2030 (USD Million)
Table 86 MEA cannabidiol market, by region, 2018 - 2030 (USD Million)
Table 87 MEA cannabidiol market, by source type, 2018 - 2030 (USD Million)
Table 88 MEA cannabidiol market, by sales type, 2018 - 2030 (USD Million)
Table 89 MEA cannabidiol market, by end use, 2018 - 2030 (USD Million)
Table 90 South Africa cannabidiol market, by source type, 2018 - 2030 (USD Million)
Table 91 South Africa cannabidiol market, by sales type, 2018 - 2030 (USD Million)
Table 92 South Africa cannabidiol market, by end use, 2018 - 2030 (USD Million)
Table 93 Israel cannabidiol market, by source type, 2018 - 2030 (USD Million)
Table 94 Israel cannabidiol market, by sales type, 2018 - 2030 (USD Million)
Table 95 Israel cannabidiol market, by end use, 2018 - 2030 (USD Million)
List of Figures
Fig. 1 Market research process
Fig. 2 Data triangulation techniques
Fig. 3 Primary research pattern
Fig. 4 Market research approaches
Fig. 5 Value-chain-based sizing & forecasting
Fig. 6 QFD modeling for market share assessment
Fig. 7 Market formulation & validation
Fig. 8 Cannabidiol market: market outlook
Fig. 9 Cannabidiol competitive insights
Fig. 10 Parent market outlook
Fig. 11 Related/ancillary market outlook
Fig. 12 Penetration and growth prospect mapping
Fig. 13 Industry value chain analysis
Fig. 14 Cannabidiol market driver impact
Fig. 15 Cannabidiol market restraint impact
Fig. 16 Cannabidiol market strategic initiatives analysis
Fig. 17 Cannabidiol market: Source type movement analysis
Fig. 18 Cannabidiol market: Source type outlook and key takeaways
Fig. 19 Hemp market estimates and forecast, 2018 - 2030
Fig. 20 Marijuana market estimates and forecast, 2018 - 2030
Fig. 21 Cannabidiol Market: Sales type movement Analysis
Fig. 22 Cannabidiol market: Sales type outlook and key takeaways
Fig. 23 Business to Business (B2B) market estimates and forecasts, 2018 - 2030
Fig. 24 Business to Business (B2C) market estimates and forecasts,2018 - 2030
Fig. 25 Hospital pharmacies market estimates and forecasts,2018 - 2030
Fig. 26 Online stores market estimates and forecasts,2018 - 2030
Fig. 27 Retail pharmacies market estimates and forecasts,2018 - 2030
Fig. 28 Cannabidiol market: end use movement analysis
Fig. 29 Cannabidiol market: end use outlook and key takeaways
Fig. 30 Medical use market estimates and forecasts, 2018 - 2030
Fig. 31 Chronic pain market estimates and forecasts,2018 - 2030
Fig. 32 Mental disorders market estimates and forecasts, 2018 - 2030
Fig. 33 Cancer market estimates and forecasts,2018 - 2030
Fig. 34 Others market estimates and forecasts, 2018 - 2030
Fig. 35 Personal use market estimates and forecasts,2018 - 2030
Fig. 36 Pharmaceutical CBD market estimates and forecasts,2018 - 2030
Fig. 37 Wellness market estimates and forecasts,2018 - 2030
Fig. 38 Food & beverages market estimates and forecasts,2018 - 2030
Fig. 39 Personal care & cosmetics market estimates and forecasts,2018 - 2030
Fig. 40 Nutraceuticals market estimates and forecasts,2018 - 2030
Fig. 41 Others end use market estimates and forecasts,2018 - 2030
Fig. 42 Global cannabidiol market: Regional movement analysis
Fig. 43 Global cannabidiol market: Regional outlook and key takeaways
Fig. 44 North America market estimates and forecasts, 2018 - 2030
Fig. 45 U.S. market estimates and forecasts, 2018 - 2030
Fig. 46 Canada market estimates and forecasts, 2018 - 2030
Fig. 47 Europe market estimates and forecasts, 2018 - 2030
Fig. 48 UK market estimates and forecasts, 2018 - 2030
Fig. 49 Germany market estimates and forecasts, 2018 - 2030
Fig. 50 France market estimates and forecasts, 2018 - 2030
Fig. 51 Italy market estimates and forecasts, 2018 - 2030
Fig. 52 Switzerland market estimates and forecasts, 2018 - 2030
Fig. 53 Poland market estimates and forecasts, 2018 - 2030
Fig. 54 Czech Republic market estimates and forecasts, 2018 - 2030
Fig. 55 Croatia market estimates and forecasts, 2018 - 2030
Fig. 56 Asia Pacific market estimates and forecasts, 2018 - 2030
Fig. 57 China market estimates and forecasts, 2018 - 2030
Fig. 58 Japan market estimates and forecasts, 2018 - 2030
Fig. 59 India market estimates and forecasts, 2018 - 2030
Fig. 60 New Zealand market estimates and forecasts, 2018 - 2030
Fig. 61 South Korea market estimates and forecasts, 2018 - 2030
Fig. 62 Australia market estimates and forecasts, 2018 - 2030
Fig. 63 Latin America market estimates and forecasts, 2018 - 2030
Fig. 64 Brazil market estimates and forecasts, 2018 - 2030
Fig. 65 Mexico market estimates and forecasts, 2018 - 2030
Fig. 66 Argentina market estimates and forecasts, 2018 - 2030
Fig. 67 Colombia market estimates and forecasts, 2018 - 2030
Fig. 68 Uruguay market estimates and forecasts, 2018 - 2030
Fig. 69 Chile market estimates and forecasts, 2018 - 2030
Fig. 70 Middle East and Africa market estimates and forecasts, 2018 - 2030
Fig. 71 South Africa market estimates and forecasts, 2018 - 2030
Fig. 72 Israel market estimates and forecasts, 2018 - 2030
Market Segmentation
In recent years, CBD has been legalized in several countries across the globe for industrial applications such as pharmaceuticals, personal care & cosmetics, and food & beverages, as it was found safe for human consumption when consumed in the prescribed quantity. There is a high demand for various CBD-infused products, such as beauty products, cannabis oil, beverages, gummies, capsules, etc. As per Federal law in the U.S., the production and distribution of hemp-based CBD have been legalized owing to its medicinal benefits. A few prominent states in the country, such as New Jersey, Delaware, Oklahoma, New Hampshire, Florida, Connecticut, and New Mexico, have legalized the use of cannabis only for medical purposes and not for recreational purposes. Such favorable regulations are anticipated to drive the CBD market over the forecast period. Growing marijuana has been legalized in most European countries, providing opportunities for startups dealing with marijuana-based products to explore the market. The European CBD market is characterized by favorable regulatory support for CBD.
Several scientific studies have confirmed the therapeutic properties of CBD, and CBD-based products are gaining wide recognition in the health and wellness sector. CBD is currently used by patients to treat various mental disorders, cancer, and arthritis, among others. CBD oil is a natural approach for treating anxiety and depression without creating any addiction. CBD has proven to be effective in reducing the number of seizures. Cancer patients undergoing chemotherapy and radiation treatments often suffer from nausea, vomiting, and postcancer pain. These adverse effects can be reduced by regular intake of CBD oil. These factors along with the associated medical benefits are likely to propel market growth over the forecast period.
In recent years, CBD has gained popularity across the globe and is used to treat a wide range of lifestyle diseases and medical conditions such as inflammation, pain, sleep disorders, epilepsy, schizophrenia, anorexia, symptoms of multiple sclerosis, and other conditions. In addition, CBD is in high demand for use in cosmetic products such as lotions, creams, and moisturizers, as well as in food items & beverages. However, there are several uncertainties pertaining to its safety, quality, and legality. In the European Union (EU), seeds for planting are only to be purchased from certified providers to ensure that the right variety of hemp is cultivated as hemp is a rich source of CBD. In addition, only outdoor agricultural fields are permitted in Europe. In the U.S., the cultivation of CBD is illegal in certain parts of the country even though CBD-infused products are available. These legal restriction and stringent government regulations can act as a hindrance to the market growth.
This section will provide insights into the contents included in this cannabidiol market report and help gain clarity on the structure of the report to assist readers in navigating smoothly.
Industry overview
Industry trends
Market drivers and restraints
Market size
Growth prospects
Porter’s analysis
PESTEL analysis
Key market opportunities prioritized
Competitive landscape
Company overview
Financial performance
Product benchmarking
Latest strategic developments
Market size, estimates, and forecast from 2018 to 2030
Market estimates and forecast for product segments up to 2030
Regional market size and forecast for product segments up to 2030
Market estimates and forecast for application segments up to 2030
Regional market size and forecast for application segments up to 2030
Company financial performance
A three-pronged approach was followed for deducing the cannabidiol market estimates and forecasts. The process has three steps: information procurement, analysis, and validation. The whole process is cyclical, and steps repeat until the estimates are validated. The three steps are explained in detail below:
Information procurement: Information procurement is one of the most extensive and important stages in our research process, and quality data is critical for accurate analysis. We followed a multi-channel data collection process for cannabidiol market to gather the most reliable and current information possible.
Analysis: We mine the data collected to establish baselines for forecasting, identify trends and opportunities, gain insight into consumer demographics and drivers, and so much more. We utilized different methods of cannabidiol market data depending on the type of information we’re trying to uncover in our research.
Market Research Efforts: Bottom-up Approach for estimating and forecasting demand size and opportunity, top-down Approach for new product forecasting and penetration, and combined approach of both Bottom-up and Top-down for full coverage analysis.
Value-Chain-Based Sizing & Forecasting: Supply-side estimates for understanding potential revenue through competitive benchmarking, forecasting, and penetration modeling.
Demand-side estimates for identifying parent and ancillary markets, segment modeling, and heuristic forecasting.
Qualitative Functional Deployment (QFD) Modelling for market share assessment.
Market formulation and validation: We mine the data collected to establish baselines for forecasting, identify trends and opportunities, gain insight into consumer demographics and drivers, and so much more. We utilize different methods of data analysis depending on the type of information we’re trying to uncover in our research.
Market Formulation: This step involves the finalization of market numbers. This step on an internal level is designed to manage outputs from the Data Analysis step.
Data Normalization: The final market estimates and forecasts are then aligned and sent to industry experts, in-panel quality control managers for validation.
This step also entails the finalization of the report scope and data representation pattern.
Validation: The process entails multiple levels of validation. All these steps run in parallel, and the study is forwarded for publishing only if all three levels render validated results.
The cannabidiol market was categorized into four segments, namely source type (Hemp, Marijuana), sales type (B2B, B2C), end-use (Medical, Personal Use, Pharmaceuticals, Wellness), regions (North America, Europe, Asia Pacific, Latin America, Middle East & Africa).
The cannabidiol market was segmented into source type, sales type, end-use, and regions. The demand at a segment level was deduced using a funnel method. Concepts like the TAM, SAM, SOM, etc., were put into practice to understand the demand. We at GVR deploy three methods to deduce market estimates and determine forecasts. These methods are explained below:
Demand estimation of each product across countries/regions summed up to from the total market.
Variable analysis for demand forecast.
Demand estimation via analyzing paid database, and company financials either via annual reports or paid database.
Primary interviews for data revalidation and insight collection.
Used extensively for new product forecasting or analyzing penetration levels.
Tool used invoice product flow and penetration models Use of regression multi-variant analysis for forecasting Involves extensive use of paid and public databases.
Primary interviews and vendor-based primary research for variable impact analysis.
The cannabidiol market was analyzed at a regional level. The globe was divided into North America, Europe, Asia Pacific, Latin America, and Middle East & Africa, keeping in focus variables like consumption patterns, export-import regulations, consumer expectations, etc. These regions were further divided into twenty-five countries, namely, the U.S.; Canada; the UK; Germany; Netherlands; Switzerland; Italy; France; Poland; Czech Republic; Croatia; China; Japan; India; South Korea; New Zealand; Australia; Brazil; Argentina; Mexico; Colombia; Uruguay; Chile; South Africa; Israel.
All three above-mentioned market research methodologies were applied to arrive at regional-level conclusions. The regions were then summed up to form the global market.
The cannabidiol market was analyzed via companies operating in the sector. Analyzing these companies and cross-referencing them to the demand equation helped us validate our assumptions and conclusions. Key market players analyzed include:
Canopy Growth Corporation - Canopy Growth Corporation is a producer and distributor of medical cannabis. The company operates through its subsidiaries, which undertake the production, packaging, and distribution of marijuana to various end users. The company’s product offerings are edibles, beverages, vapes, dried flowers, oils, concentrates, soft gel capsules, and hemp.
Aphria, Inc. - Aphria, Inc. produces and sells medical marijuana and its derivatives, such as cannabis oils through online store or phone. It markets Sativa, Indica, and hybrid varieties of marijuana. Aphria, Inc. is listed on the Toronto Stock Exchange and the U.S. OTCQB Venture Market Stock Exchange.
Aurora Cannabis - Aurora Cannabis deals in Indica, Sativa, and hybrid varieties of cannabis. The company provides a variety of cannabis strains with different THC and CBD levels. The company is vertically integrated, as it is involved in the cultivation, development, research, and supply of cannabis to retailers.
Maricann, Inc. (Wayland Group Corporation) - Wayland Group Corporation, formerly known as Maricann Inc, is a privately held producer and distributor of medical cannabis. Its product portfolio includes cannabis oil and buds. The company mostly caters to the Canadian medical marijuana market; however, it has a presence in other emerging medical marijuana markets, such as Germany. Maricann is listed on the Canadian Securities Exchange (CSE).
Tilray - Tilraywas the first producer licensed to legally export cannabis products from North America to Australia, Europe, and New Zealand for commercial and research purposes. Tilray is a privately held company involved in the cultivation, processing, research, and distribution of medical marijuana. The company has GMP certified unit that processes cannabis flowers and other extracts. The company’s customers are pharmacies, physicians, patients, hospitals, governments, and researchers.
GW Pharmaceuticals, PLC - GW Pharmaceuticals, plc is a biopharmaceutical company. It mainly focuses on developing, commercializing, and discovering novel therapeutics cannabinoid products. The company’s leading cannabinoid product is EPIDIOLEX, a liquid formulation used in treating seizures. It has received Orphan Drug designation from the U.S. FDA for EPIDIOLEX for treating Dravet syndrome, Lennox- Gastaut syndrome, infantile spasms, and tuberous sclerosis complex.
ABcann Medicinals, Inc. - ABcann Medicinals, Inc. uses special technology for growing standardized medical cannabis in a controlled environment and also educates people on cannabis. It offers chemical-free, soil-grown, and pesticide-free medical cannabis and sells it based on THC and CBD levels.
Organigram Holding, Inc. - Organigram Holding, Inc. produces and markets medical cannabis within Canada. It offers a broad portfolio of cannabis oils. Some of the key brands of the company are Banook, Rossignol, Shubie, and Utopia. Organigram is a licensed medical cannabis producer regulated by the Marihuana Medical Access Regulation (MMAR) of the government of Canada.
Tikun Olam - Tikun Olam is the largest supplier of medical marijuana in Israel and is globally known as the pioneer of modern medical cannabis. It is involved in the cultivation of medical cannabis for its administration to patients. It holds the first cultivation license in Israel, Australia, and Greece. It has developed multiple award-winning strains such as Alaska, Erez, and Midnight.
The Cronos Group - The Cronos Group is a parent organization comprising various companies that hold licenses or are in the process of obtaining licenses to cultivate and process medical cannabis & for its allied businesses. The company also distributes medical cannabis to pharmacies.
Supply Side Estimates
Company revenue estimation via referring to annual reports, investor presentations, and Hoover’s.
Segment revenue determination via variable analysis and penetration modeling.
Competitive benchmarking to identify market leaders and their collective revenue shares.
Forecasting via analyzing commercialization rates, pipelines, market initiatives, distribution networks, etc.
Demand side estimates
Identifying parent markets and ancillary markets
Segment penetration analysis to obtain pertinent
revenue/volume
Heuristic forecasting with the help of subject matter experts
Forecasting via variable analysis
Understanding market dynamics (in terms of drivers, restraints, & opportunities) in the countries.
Understanding trends & variables in the individual countries & their impact on growth and using analytical tools to provide high-level insights into the market dynamics and the associated growth pattern.
Understanding market estimates and forecasts (with the base year as 2023, historic information from 2018 to 2023, and forecast from 2024 to 2030). Regional estimates & forecasts for each category are available and are summed up to form the global market estimates.
The report provides market value for the base year 2023 and a yearly forecast till 2030 in terms of revenue/volume or both. The market for each of the segment outlooks has been provided on region & country basis for the above-mentioned forecast period.
The key industry dynamics, major technological trends, and application markets are evaluated to understand their impact on the demand for the forecast period. The growth rates were estimated using correlation, regression, and time-series analysis.
We have used the bottom-up approach for market sizing, analyzing key regional markets, dynamics, & trends for various products and end-users. The total market has been estimated by integrating the country markets.
All market estimates and forecasts have been validated through primary interviews with the key industry participants.
Inflation has not been accounted for to estimate and forecast the market.
Numbers may not add up due to rounding off.
Europe consists of EU-8, Central & Eastern Europe, along with the Commonwealth of Independent States (CIS).
Asia Pacific includes South Asia, East Asia, Southeast Asia, and Oceania (Australia & New Zealand).
Latin America includes Central American countries and the South American continent
Middle East includes Western Asia (as assigned by the UN Statistics Division) and the African continent.
GVR strives to procure the latest and unique information for reports directly from industry experts, which gives it a competitive edge. Quality is of utmost importance to us, therefore every year we focus on increasing our experts’ panel. Primary interviews are one of the critical steps in identifying recent market trends and scenarios. This process enables us to justify and validate our market estimates and forecasts to our clients. With more than 8,000 reports in our database, we have connected with some key opinion leaders across various domains, including healthcare, technology, consumer goods, and the chemical sector. Our process starts with identifying the right platform for a particular type of report, i.e., emails, LinkedIn, seminars, or telephonic conversation, as every report is unique and requires a differentiated approach.
We send out questionnaires to different experts from various regions/ countries, which is dependent on the following factors:
Report/Market scope: If the market study is global, we send questionnaires to industry experts across various regions, including North America, Europe, Asia Pacific, Latin America, and MEA.
Market Penetration: If the market is driven by technological advancements, population density, disease prevalence, or other factors, we identify experts and send out questionnaires based on region or country dominance.
The time to start receiving responses from industry experts varies based on how niche or well-penetrated the market is. Our reports include a detailed chapter on the KoL opinion section, which helps our clients understand the perspective of experts already in the market space.
NEED A CUSTOM REPORT?
We can customize every report - free of charge - including purchasing stand-alone sections or country-level reports, as well as offer affordable discounts for start-ups & universities. Contact us now
We are GDPR and CCPA compliant! Your transaction & personal information is safe and secure. For more details, please read our privacy policy.
"The quality of research they have done for us has been excellent."