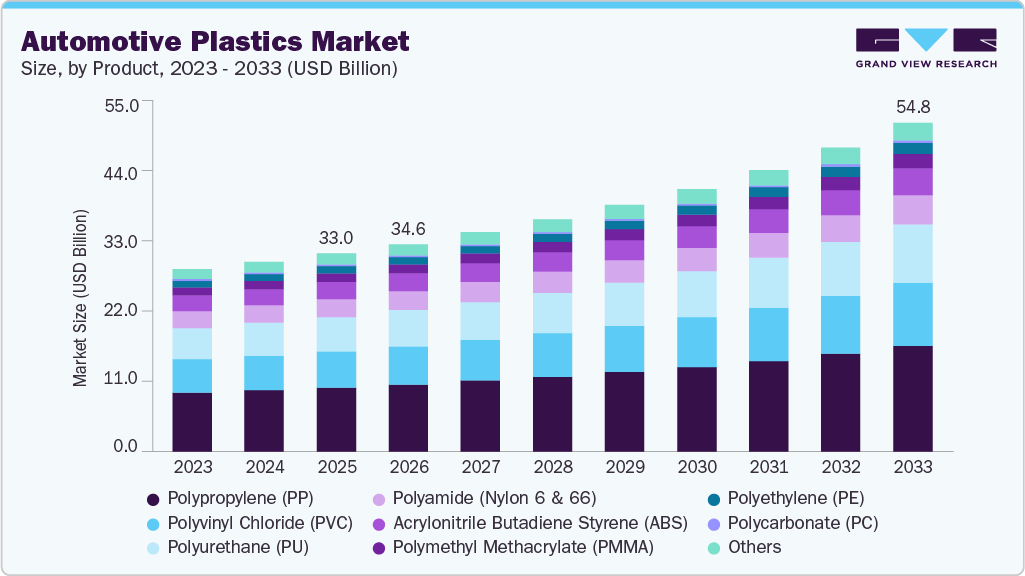
The global automotive plastics market size was estimated at USD 30.44 billion in 2023 and is anticipated to grow a compound annual growth rate (CAGR) of 5.6% from 2024 to 2030. The expansion of the market is being fueled by the increasing demand for lightweight materials in vehicle manufacturing, driven by the pursuit of enhanced fuel efficiency and reduced emissions. Growing awareness of environmental sustainability is a key trend, pushing automakers toward eco-friendly and recyclable plastic solutions. Additionally, advancements in polymer technology and a rising focus on interior aesthetics are expected to contribute to the projected growth of the market.
The rapidly evolving automotive industry in China is driving the demand for automotive plastics, as manufacturers strive to comply with environmental standards and governmental regulations pertaining to vehicle weight and emission levels. Plastics are increasingly being utilized in vehicles to reduce weight, promote fuel savings, and enhance efficiency.
The market in China is also poised to benefit from the government's substantial subsidies to manufacturers and favorable discounts and incentives for customers who purchase electric cars. This trend is particularly promising, given the rising popularity of electric vehicles and their potential to revolutionize the automotive industry.
China is extremely rich in resources, such as petrochemical reserves, and is characterized by the availability of highly skilled labor. Major automotive plastics players are shifting their manufacturing facilities to China on account of rising demand for the product coupled with a favorable business environment.
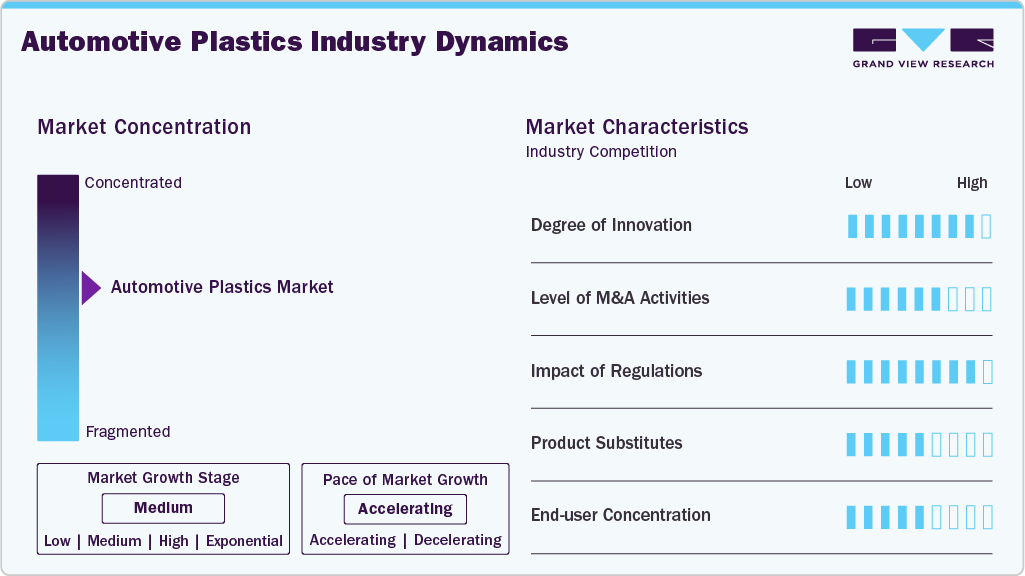
Market growth stage is high, and pace of market growth is accelerating owing to moderately consolidated market. Automotive plastic manufacturers are actively implementing challenging strategic initiatives such as mergers & acquisitions, new product launches, production expansion, among others.
The global Automotive Plastics Market is marked by the significant level of innovation, as plastics are witnessing an increasing demand owing to their properties, including lightweight, versatility, and flexibility, which allow technological innovations and design freedom. These properties provide technological innovation with cost-efficiency and sustainability. Also, as the automotive industry navigates economic challenges and cost pressures, thermoforming remains a key component in the quest for efficient and economical manufacturing solutions, ensuring continued growth and innovation within the automotive plastics market.
Furthermore, the impact of regulations on market have been medium as vehicle weight regulations and standardization of emission norms are anticipated to impact the market growth positively and Favorable federal regulations laid down by agencies such as the Environmental Protection Agency (EPA) and National Highway Traffic Safety Administration (NHTSA) regarding carbon emissions, along with the EU initiatives to develop plastics applications for the creation of light and fuel-efficient cars, are likely to boost the growth of the global market.
In addition to that, End-user concentration is a significant factor market. Since there is a diverse end-user base with varying degrees of concentration. Understanding these demographics and their motivations is crucial for manufacturers and retailers to develop effective marketing strategies and target specific customer segments.
Polypropylene (PP) resin dominated product segmentation in 2023 with a significant revenue share of above 32.0%. The product finds application in both rigid and flexible packaging owing to its physical and chemical properties. PP offers excellent chemical and electrical resistance at very high temperatures. It is semi-rigid, translucent, and provides integral hinge property. PP is quite light weighted as compared to other plastics and is widely used in automotive sector.
Followed by polyvinyl chloride (PVC) at a market revenue share of above 18.0% in 2023. Polyvinyl Chloride (PVC) is a prominent automotive plastic, playing a crucial role in enhancing the durability and functionality of various vehicle components. PVC is widely used in automotive interiors for manufacturing dashboards, door panels, and seat coverings, due to its exceptional resistance to wear, chemicals, and sunlight. Its ability to withstand harsh environmental conditions makes it a preferred choice for exterior applications as well, including window seals, weather stripping, and under-the-hood components.
Injection molding dominated process segmentation in 2023 with a significant revenue share of above 56.0%. This plastic is one of the most used methods for molding plastic in the automobile industry. It involves pumping molten plastic material under intense pressure into a metal mold to create personalized plastic parts and fittings. The injection molding technique has become increasingly important in the mass manufacture of intricate plastic molds due to modern improvements aimed at reducing error rates.
The volatile prices of key raw materials such as ethylene, benzene, styrene, and propylene as well as growing environmental concerns regarding their disposal, are likely to hamper growth in the adoption of injection molding process over the forecast period. Companies are focused on developing injection molded plastics using bio-based counterparts to address these challenges.
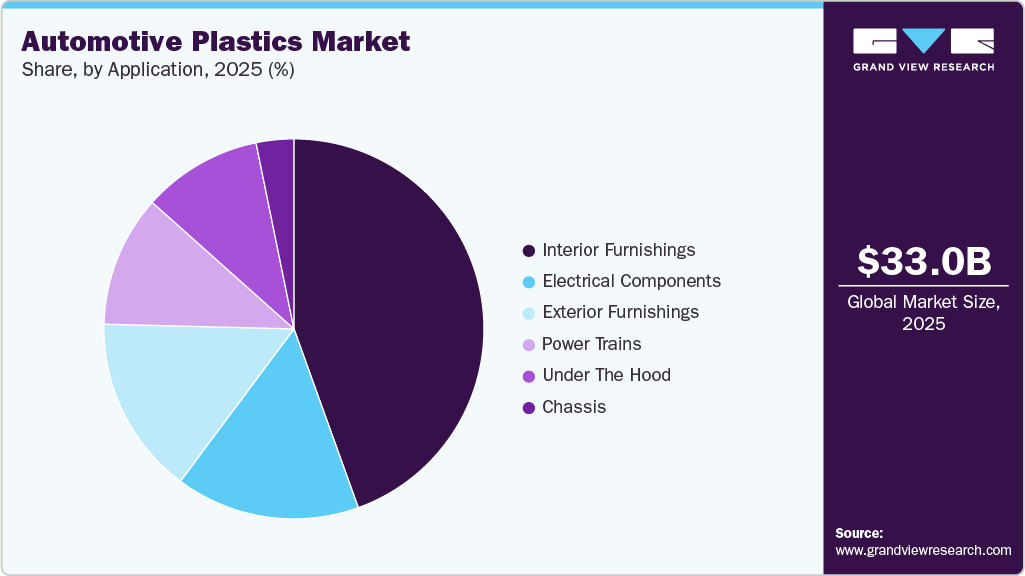
Interior furnishing dominated application segmentation for 2023 in terms of revenue share above 44.0%. Automotive plastics find extensive use in car interiors, encompassing body and light panels, seat covers, steering wheels, and fascia systems. High-performance plastics like GMT and ABS composites are increasingly replacing traditional rubber, metal, and other materials in the construction of internal components such as load floors, seat bases, rear package shelves, and headliners.
Rising digitalization has fostered the demand for automotive electronics integrated into car dashboards with highly advanced technology & features. Safety concerns and high electrical insulation properties of plastics have fostered their demand for such instrument panels containing advanced electronic systems.
Exterior furnishings represent a crucial aspect where plastics, such as polycarbonate and polypropylene, play a significant role in improving the visual appeal and functionality of vehicles. Plastics offer a lightweight alternative to traditional materials, contributing to improved fuel efficiency and overall vehicle performance. From sleek body panels to durable bumpers, plastics are pivotal in creating exterior components that not only enhance the aesthetic appeal of automobiles but also provide crucial impact resistance and durability in various weather conditions. The versatility of plastics allows for innovative designs and intricate detailing in exterior furnishings, contributing to the dynamic and ever-evolving landscape of automotive aesthetics.
Passenger cars dominated the global automotive plastics market in 2023, with growth driven by recovery of the global production environment, as well as rising sales of electric vehicles. The shift from combustion engines to electric motors has drastically changed the architecture & platform framework of passenger car manufacturing. This has led to a shift in demand patterns of plastics.
Automotive OEMs are increasing procuring plastics that present higher thermal insulation properties, are lightweight, and demonstrate higher tolerance to wear & tear. These requirements from OEMs are paving way for the development of new plastics grades and also changing the point-of-applications of plastics to better suit the electric vehicle architecture.
Asia Pacific dominated global automotive plastics market in 2023 with a market share of above 46.0% and is characterized by the availability of cheap labor, land, and resources. The growing automotive industry, especially in emerging economies such as India, China, Vietnam, Indonesia, and Thailand, is expected to positively influence the growth of automotive plastics market over the forecast period.
Expanding manufacturing base and increasing investments in technological advancements pertaining to vehicle production process are expected to positively influence the automotive sector. Automotive plastics exhibit superior properties including toughness, recyclability, durability, thermal stability, design flexibility, corrosion resistance, and resilience, as well as are lightweight. These plastics are widely used in automobiles in exterior, interior, chassis, and engine components to reduce the overall weight of the vehicle, thereby increasing fuel efficiency.
Rapidly evolving automotive industry in China is driving the demand for automotive plastics, as manufacturers strive to comply with environmental standards and governmental regulations pertaining to vehicle weight and emission levels. Plastics are increasingly being utilized in vehicles to reduce weight, promote fuel savings, and enhance efficiency. The market in China is also poised to benefit from the government's substantial subsidies to manufacturers and favorable discounts and incentives for customers who purchase electric cars. This trend is particularly promising, given the rising popularity of electric vehicles and their potential to revolutionize the automotive industry.
Rapidly evolving automotive industry is driving the growth of automotive plastics market in China, as manufacturers strive to comply with environmental standards and governmental regulations pertaining to vehicle weight and emission levels. Plastics are increasingly being utilized in vehicles to reduce weight, promote fuel savings, and enhance efficiency. The market in China is also poised to benefit from the government's substantial subsidies to manufacturers and favorable discounts and incentives for customers who purchase electric cars. This trend is particularly promising, given the rising popularity of electric vehicles and their potential to revolutionize the automotive industry.
The demand for plastics in automotive applications is characterized by the presence of globally leading automotive OEMs in the region and heavy R&D activities undertaken by these entities. As one of the automotive innovation hubs, the region dictates the trajectory of plastics usage patterns in the manufacturing of various components. In 2023, the region’s automotive production increased by 7%, momentarily indicating a rebound after multiple disruptions in the form of pandemic-induced lockdowns, chip shortages, regional conflicts, and disturbances in maritime trade routes; however, emergence of Asia Pacific as a key production base and weaker macroeconomic indicators paints a grim picture of the future demand for automotive polymers in the region. Europe accounted for over 30% of the global automotive plastics market revenue in 2023, with its market share expected to decline over the forecast period.
Most of key players operating in market have integrated their raw material and distribution operations to maintain additive quality and expand their regional presence. This provides companies a competitive advantage in form of cost benefits, thus increasing profit margins. Companies are undertaking research and development activities to develop new industrial plastics to sustain market competition and changing end-user requirements.
Research activities focused on development of new materials, which combine several properties, are projected to gain wide acceptance in this industry in coming years. Furthermore, active players implement strategic initiatives for maintaining competitive environmental. For instance, in March 2023, BASF SE partnered with Zhejiang REEF Technology to create advanced recyclate formulations for the automotive, packaging, and consumer sectors. BASF will provide IrgaCycle solutions and technical assistance for recycled polymer formulations, which will be tested at BASF's facilities.
In June 2023, Borealis AG acquired Rialti S.p.A., a leading polypropylene (PP) compounding company specializing in recyclates in the Varese region of Italy. This strategic move enhances Borealis' position by adding substantial expertise and production capacity to its PP compounding business. The acquisition specifically emphasizes expanding the volume of PP compounds derived from mechanical recyclates. The increased capacity is expected to fortify Borealis' specialized and circular portfolios. This enables the company to respond effectively to growing market demands for an extensive array of sustainable and high-performance solutions.
In May 2023, Lear, a leading automotive technology company, intends to establish a connection systems facility in Morocco dedicated to producing components for automakers, suppliers, and its E-systems and seating units.
In November 2022, Covestro AG and HASCO Vision partnered to recycle post-industrial plastics. Covestro collects used plastics from HASCO's production facilities, transforms them into high-quality post-industrial recycled polycarbonates and polycarbonate blends, and then provides them to HASCO to manufacture new automotive components.
Report Attribute |
Details |
Market size value in 2024 |
USD 31.63 billion |
Revenue forecast in 2030 |
USD 43.77 billion |
Growth rate |
CAGR of 5.6% from 2024 to 2030 |
Base year for estimation |
2023 |
Historical data |
2018 - 2023 |
Forecast period |
2024 - 2030 |
Report updated |
January 2024 |
Quantitative units |
Volume in kilotons, revenue in USD million/billion, CAGR from 2024 to 2030 |
Report coverage |
Volume forecast, revenue forecast, competitive landscape, growth factors and trends |
Segments covered |
Product, process, application, vehicle type and region |
Regional scope |
North America; Europe; Asia Pacific; Central & South America; Middle East & Africa |
Country Scope |
U.S.; Canada; Mexico; Germany; UK; France; Italy; China; India; Japan; Southeast Asia; Australia; Malaysia; Brazil |
Key companies profiled |
Akzo Nobel N.V.; BASF SE; Covestro AG; Evonik Industries AG; Adient plc; Magna International, Inc.; Momentive Performance Materials, Inc.; SABIC; Dow, Inc.; Borealis AG; Hanwha Azdel Inc.; Grupo Antolin; Lear Corporation; Owens Corning; Quadrant AG; Royal DSM N.V.; TEIJIN LIMITED |
Customization scope |
Free report customization (equivalent up to 8 analyst’s working days) with purchase. Addition or alteration to country, regional & segment scope |
Pricing and purchase options |
Avail customized purchase options to meet your exact research needs. Explore purchase options |
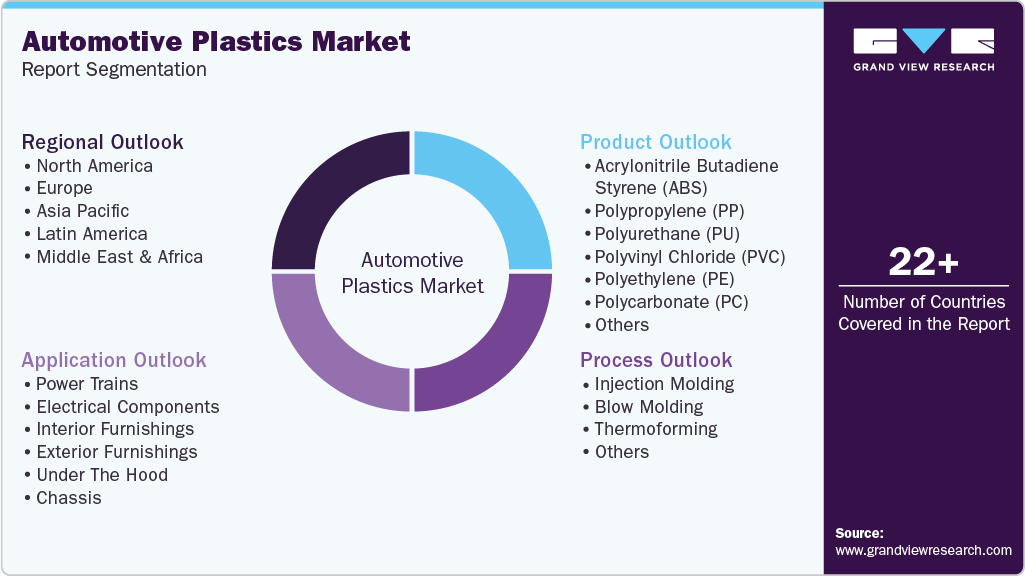
This report forecasts revenue growth at global, regional, and country levels and provides an analysis of latest industry trends in each of sub-segments from 2018 to 2030. For this study, Grand View Research has segmented Automotive Plastics market report based on product, process, application, vehicle type and region:
Product Outlook (Volume, Kilotons; Revenue, USD Million, 2018 - 2030)
Acrylonitrile butadiene styrene (ABS)
Polypropylene (PP)
PP LGF 20
PP LGF 30
PP LGF 40
Others
Polyurethane (PU)
Polyvinyl Chloride (PVC)
Rigid PVC
Flexible PVC
Polyethylene (PE)
High-density Polyethylene (HDPE)
Other PE Grades
Polybutylene Terephthalate (PBT)
Polycarbonate (PC)
Polymethyl methacrylate (PMMA)
Polyamide (Nylon 6, Nylon 66)
Others
Process Outlook (Volume, Kilotons; Revenue, USD Million, 2018 - 2030)
Injection Molding
Blow Molding
Thermoforming
Others
Application Outlook (Volume, Kilotons; Revenue, USD Million, 2018 - 2030)
Powertrains
Electrical Components
Interior Furnishing
IMD or IML
Others
Exterior Furnishing
Under the hood
Chassis
Vehicle Type Outlook (Volume, Kilotons; Revenue, USD Million, 2018 - 2030)
Passenger Cars
Internal Combustion Engine (ICE) Vehicles
Electric Vehicles
Battery Electric Vehicles (BEV)
Plug-in Hybrid Electric Vehicles (PHEV)
Fuel Cell Electric Vehicles (FCEV)
Light Commercial Vehicles
Medium & Heavy Commercial Vehicles
Regional Outlook (Volume, Kilotons; Revenue, USD Million, 2018 - 2030)
North America
U.S.
Canada
Mexico
Europe
Germany
UK
France
Italy
Asia Pacific
China
India
Japan
Southeast Asia
Central & South America
Brazil
Middle East & Africa
b. The global automotive plastics market size was estimated at USD 30.44 billion in 2023 and is expected to reach USD 31.63 billion in 2024.
b. The global automotive plastics market is expected to grow at a compound annual growth rate of 5.4% from 2024 to 2030 to reach USD 43.44 billion by 2030.
b. The polypropylene segment led the global automotive plastics market and accounted for the largest revenue share of more than 32.30% in 2023.
b. The injection molding segment led the global automotive plastics market and accounted for the largest revenue share of more than 56.15% in 2023.
b. The interior furnishings segment led the global automotive plastics market and accounted for the largest revenue share of more than 44.25% in 2023.
Table of Contents
Chapter 1. Automotive Plastics Market: Methodology and Scope
1.1. Market Segmentation & Scope
1.2. Market Definition
1.3. Information Procurement
1.3.1. Purchased Database
1.3.2. GVR’s Internal Database
1.3.3. Secondary Sources & Third-Party Perspectives
1.3.4. Primary Research
1.4. Information Analysis
1.4.1. Data Analysis Models
1.5. Market Formulation & Data Visualization
1.6. Data Validation & Publishing
Chapter 2. Automotive Plastics Market: Executive Summary
2.1. Market Snapshot, 2023
2.2. Polymer Segment Snapshot, 2023
2.3. Application Segment Snapshot, 2023
2.4. Competitive Landscape Snapshot
Chapter 3. Automotive Plastics Market: Variables, Trends & Scope
3.1. Market Lineage Outlook
3.1.1. Global Plastic Additives Market Outlook
3.2. Penetration & Growth Prospect Mapping
3.3. Industry Value Chain Analysis
3.3.1. Raw Material Trends
3.3.2. Manufacturing Trends
3.4. Regulatory Framework
3.5. Market Dynamics
3.5.1. Market Driver Analysis
3.5.2. Market Restraint Analysis
3.5.3. Industry Challenges
3.5.4. Industry Opportunities
3.6. Automotive Plastics Market- Business Environment Analysis
3.6.1. Industry Analysis- Porter’s Five Force Analysis
3.6.2. Industry Analysis- Macroeconomic Factors Analysis
3.7. East European Geopolitical Implication of the Industry Overview
3.8. Impact of COVID-19 on Automotive Plastics Market
Chapter 4. Automotive Plastics Market: Product Estimates & Trend Analysis
4.1. Product Movement Analysis & Market Share, 2023 & 2030
4.2. Automotive Plastics Market Estimates & Forecast, By Process, 2018 to 2030 (Kilotons) (USD Million)
4.3. Acrylonitrile Butadiene Styrene (ABS)
4.3.1. Market Estimates and Forecasts, 2018 - 2030 (Kilotons) (USD Million)
4.4. Polypropylene (PP)
4.4.1. Market Estimates and Forecasts, 2018 - 2030 (Kilotons) (USD Million)
4.5. Polyurethane (PU)
4.5.1. Market Estimates and Forecasts, 2018 - 2030 (Kilotons) (USD Million)
4.6. Polyvinyl Chloride (PVC)
4.6.1. Market Estimates and Forecasts, 2018 - 2030 (Kilotons) (USD Million)
4.6.2. Rigid PVC
4.6.2.1. Market Estimates and Forecasts, 2018 - 2030 (Kilotons) (USD Million)
4.6.3. Flexible PVC
4.6.3.1. Market Estimates and Forecasts, 2018 - 2030 (Kilotons) (USD Million)
4.7. Polyethylene (PE)
4.7.1. Market Estimates and Forecasts, 2018 - 2030 (Kilotons) (USD Million)
4.7.2. High-density Polyethylene (HDPE)
4.7.2.1. Market Estimates and Forecasts, 2018 - 2030 (Kilotons) (USD Million)
4.7.3. Other PE Grades
4.7.3.1. Market Estimates and Forecasts, 2018 - 2030 (Kilotons) (USD Million)
4.8. Polybutylene Terephthalate (PBT)
4.8.1. Market Estimates and Forecasts, 2018 - 2030 (Kilotons) (USD Million)
4.9. Polycarbonate (PC)
4.9.1. Market Estimates and Forecasts, 2018 - 2030 (Kilotons) (USD Million)
4.10. Polymethyl Methacrylate (PMMA)
4.10.1. Market Estimates and Forecasts, 2018 - 2030 (Kilotons) (USD Million)
4.11. Polyamide (PA)
4.11.1. Market Estimates and Forecasts, 2018 - 2030 (Kilotons) (USD Million)
4.12. Others
4.12.1. Market Estimates and Forecasts, 2018 - 2030 (Kilotons) (USD Million)
Chapter 5. Automotive Plastics Market: Process Estimates & Trend Analysis
5.1. Process Movement Analysis & Market Share, 2023 & 2030
5.2. Automotive Plastics Market Estimates & Forecast, By Process, 2018 to 2030 (Kilotons) (USD Million)
5.3. Injection Molding
5.3.1. Market Estimates and Forecasts, 2018 - 2030 (Kilotons) (USD Million)
5.4. Blow Molding
5.4.1. Market Estimates and Forecasts, 2018 - 2030 (Kilotons) (USD Million)
5.5. Thermoforming
5.5.1. Market Estimates and Forecasts, 2018 - 2030 (Kilotons) (USD Million)
5.6. Others
5.6.1. Market Estimates and Forecasts, 2018 - 2030 (Kilotons) (USD Million)
Chapter 6. Automotive Plastics Market: Application Estimates & Trend Analysis
6.1. Application Movement Analysis & Market Share, 2023 & 2030
6.2. Market Estimates & Forecasts, 2018 - 2030 (Kilotons) (USD Million)
6.3. Powertrains
6.3.1. Market Estimates and Forecasts, 2018 - 2030 (Kilotons) (USD Million)
6.4. Electrical Components
6.4.1. Market Estimates and Forecasts, 2018 - 2030 (Kilotons) (USD Million)
6.5. Interior furnishing
6.5.1. Market Estimates and Forecasts, 2018 - 2030 (Kilotons) (USD Million)
6.6. Others
6.6.1. Market Estimates and Forecasts, 2018 - 2030 (Kilotons) (USD Million)
Chapter 7. Automotive Plastics Market: Vehicle Type Estimates & Trend Analysis
7.1. Vehicle Type Movement Analysis & Market Share, 2023 & 2030
7.2. Automotive Plastics Market Estimates & Forecast, By Vehicle Type, 2018 to 2030 (Kilotons) (USD Million)
7.3. Passenger Cars
7.3.1. Market Estimates and Forecasts, 2018 - 2030 (Kilotons) (USD Million)
7.3.2. Internal Combustion Engine (ICE) Vehicles
7.3.2.1. Market Estimates and Forecasts, 2018 - 2030 (Kilotons) (USD Million)
7.3.3. Electric Vehicles
7.3.3.1. Market Estimates and Forecasts, 2018 - 2030 (Kilotons) (USD Million)
7.3.3.2. Battery Electric Vehicles (BEV)
7.3.3.2.1. Market Estimates and Forecasts, 2018 - 2030 (Kilotons) (USD Million)
7.3.3.3. Plug-in Hybrid Electric Vehicles (PHEV)
7.3.3.3.1. Market Estimates and Forecasts, 2018 - 2030 (Kilotons) (USD Million)
7.3.3.4. Fuel Cell Electric Vehicles (FCEV)
7.3.3.4.1. Market Estimates and Forecasts, 2018 - 2030 (Kilotons) (USD Million)
7.4. Light Commercial Vehicles
7.4.1. Market Estimates and Forecasts, 2018 - 2030 (Kilotons) (USD Million)
7.5. Medium & Heavy Commercial Vehicles
7.5.1. Market Estimates and Forecasts, 2018 - 2030 (Kilotons) (USD Million)
Chapter 8. Automotive Plastics Market: Regional Estimates & Trend Analysis
8.1. Regional Movement Analysis & Market Share, 2023 & 2030
8.2. North America
8.2.1. Market Estimates and Forecasts, 2018 - 2030 (Kilotons) (USD Million)
8.2.2. Market Estimates and Forecasts, by Product, 2018 - 2030 (Kilotons) (USD Million)
8.2.3. Market Estimates and Forecasts, by Process, 2018 - 2030 (Kilotons) (USD Million)
8.2.4. Market Estimates and Forecasts, by Application, 2018 - 2030 (Kilotons) (USD Million)
8.2.5. Market Estimates and Forecasts, by Vehicle Type, 2018 - 2030 (Kilotons) (USD Million)
8.2.6. U.S.
8.2.6.1. Key Country Dynamics
8.2.6.2. Market Estimates and Forecasts, 2018 - 2030 (Kilotons) (USD Million)
8.2.6.3. Market Estimates and Forecasts, by Product, 2018 - 2030 (Kilotons) (USD Million)
8.2.6.4. Market Estimates and Forecasts, by Process, 2018 - 2030 (Kilotons) (USD Million)
8.2.6.5. Market Estimates and Forecasts, by Application, 2018 - 2030 (Kilotons) (USD Million)
8.2.6.6. Market Estimates and Forecasts, by Vehicle Type, 2018 - 2030 (Kilotons) (USD Million)
8.2.7. Canada
8.2.7.1. Key Country Dynamics
8.2.7.2. Market Estimates and Forecasts, 2018 - 2030 (Kilotons) (USD Million)
8.2.7.3. Market Estimates and Forecasts, by Product, 2018 - 2030 (Kilotons) (USD Million)
8.2.7.4. Market Estimates and Forecasts, by Process, 2018 - 2030 (Kilotons) (USD Million)
8.2.7.5. Market Estimates and Forecasts, by Application, 2018 - 2030 (Kilotons) (USD Million)
8.2.7.6. Market Estimates and Forecasts, by Vehicle Type, 2018 - 2030 (Kilotons) (USD Million)
8.2.8. Mexico
8.2.8.1. Key Country Dynamics
8.2.8.2. Market Estimates and Forecasts, 2018 - 2030 (Kilotons) (USD Million)
8.2.8.3. Market Estimates and Forecasts, by Product, 2018 - 2030 (Kilotons) (USD Million)
8.2.8.4. Market Estimates and Forecasts, by Process, 2018 - 2030 (Kilotons) (USD Million)
8.2.8.5. Market Estimates and Forecasts, by Application, 2018 - 2030 (Kilotons) (USD Million)
8.2.8.6. Market Estimates and Forecasts, by Vehicle Type, 2018 - 2030 (Kilotons) (USD Million)
8.3. Europe
8.3.1. Market Estimates and Forecasts, 2018 - 2030 (Kilotons) (USD Million)
8.3.2. Market Estimates and Forecasts, by Product, 2018 - 2030 (Kilotons) (USD Million)
8.3.3. Market Estimates and Forecasts, by Process, 2018 - 2030 (Kilotons) (USD Million)
8.3.4. Market Estimates and Forecasts, by Application, 2018 - 2030 (Kilotons) (USD Million)
8.3.5. Market Estimates and Forecasts, by Vehicle Type, 2018 - 2030 (Kilotons) (USD Million)
8.3.6. Germany
8.3.6.1. Key Country Dynamics
8.3.6.2. Market Estimates and Forecasts, 2018 - 2030 (Kilotons) (USD Million)
8.3.6.3. Market Estimates and Forecasts, by Product, 2018 - 2030 (Kilotons) (USD Million)
8.3.6.4. Market Estimates and Forecasts, by Process, 2018 - 2030 (Kilotons) (USD Million)
8.3.6.5. Market Estimates and Forecasts, by Application, 2018 - 2030 (Kilotons) (USD Million)
8.3.6.6. Market Estimates and Forecasts, by Vehicle Type, 2018 - 2030 (Kilotons) (USD Million)
8.3.7. UK
8.3.7.1. Key Country Dynamics
8.3.7.2. Market Estimates and Forecasts, 2018 - 2030 (Kilotons) (USD Million)
8.3.7.3. Market Estimates and Forecasts, by Product, 2018 - 2030 (Kilotons) (USD Million)
8.3.7.4. Market Estimates and Forecasts, by Process, 2018 - 2030 (Kilotons) (USD Million)
8.3.7.5. Market Estimates and Forecasts, by Application, 2018 - 2030 (Kilotons) (USD Million)
8.3.7.6. Market Estimates and Forecasts, by Vehicle Type, 2018 - 2030 (Kilotons) (USD Million)
8.3.8. Italy
8.3.8.1. Key Country Dynamics
8.3.8.2. Market Estimates and Forecasts, 2018 - 2030 (Kilotons) (USD Million)
8.3.8.3. Market Estimates and Forecasts, by Product, 2018 - 2030 (Kilotons) (USD Million)
8.3.8.4. Market Estimates and Forecasts, by Process, 2018 - 2030 (Kilotons) (USD Million)
8.3.8.5. Market Estimates and Forecasts, by Application, 2018 - 2030 (Kilotons) (USD Million)
8.3.8.6. Market Estimates and Forecasts, by Vehicle Type, 2018 - 2030 (Kilotons) (USD Million)
8.3.9. France
8.3.9.1. Key Country Dynamics
8.3.9.2. Market Estimates and Forecasts, 2018 - 2030 (Kilotons) (USD Million)
8.3.9.3. Market Estimates and Forecasts, by Product, 2018 - 2030 (Kilotons) (USD Million)
8.3.9.4. Market Estimates and Forecasts, by Process, 2018 - 2030 (Kilotons) (USD Million)
8.3.9.5. Market Estimates and Forecasts, by Application, 2018 - 2030 (Kilotons) (USD Million)
8.3.9.6. Market Estimates and Forecasts, by Vehicle Type, 2018 - 2030 (Kilotons) (USD Million)
8.4. Asia Pacific
8.4.1. Market Estimates and Forecasts, 2018 - 2030 (Kilotons) (USD Million)
8.4.2. Market Estimates and Forecasts, by Product, 2018 - 2030 (Kilotons) (USD Million)
8.4.3. Market Estimates and Forecasts, by Process, 2018 - 2030 (Kilotons) (USD Million)
8.4.4. Market Estimates and Forecasts, by Application, 2018 - 2030 (Kilotons) (USD Million)
8.4.5. Market Estimates and Forecasts, by Vehicle Type, 2018 - 2030 (Kilotons) (USD Million)
8.4.6. China
8.4.6.1. Key Country Dynamics
8.4.6.2. Market Estimates and Forecasts, 2018 - 2030 (Kilotons) (USD Million)
8.4.6.3. Market Estimates and Forecasts, by Product, 2018 - 2030 (Kilotons) (USD Million)
8.4.6.4. Market Estimates and Forecasts, by Process, 2018 - 2030 (Kilotons) (USD Million)
8.4.6.5. Market Estimates and Forecasts, by Application, 2018 - 2030 (Kilotons) (USD Million)
8.4.6.6. Market Estimates and Forecasts, by Vehicle Type, 2018 - 2030 (Kilotons) (USD Million)
8.4.7. India
8.4.7.1. Key Country Dynamics
8.4.7.2. Market Estimates and Forecasts, 2018 - 2030 (Kilotons) (USD Million)
8.4.7.3. Market Estimates and Forecasts, by Product, 2018 - 2030 (Kilotons) (USD Million)
8.4.7.4. Market Estimates and Forecasts, by Process, 2018 - 2030 (Kilotons) (USD Million)
8.4.7.5. Market Estimates and Forecasts, by Application, 2018 - 2030 (Kilotons) (USD Million)
8.4.7.6. Market Estimates and Forecasts, by Vehicle Type, 2018 - 2030 (Kilotons) (USD Million)
8.4.8. Japan
8.4.8.1. Key Country Dynamics
8.4.8.2. Market Estimates and Forecasts, 2018 - 2030 (Kilotons) (USD Million)
8.4.8.3. Market Estimates and Forecasts, by Product, 2018 - 2030 (Kilotons) (USD Million)
8.4.8.4. Market Estimates and Forecasts, by Process, 2018 - 2030 (Kilotons) (USD Million)
8.4.8.5. Market Estimates and Forecasts, by Application, 2018 - 2030 (Kilotons) (USD Million)
8.4.8.6. Market Estimates and Forecasts, by Vehicle Type, 2018 - 2030 (Kilotons) (USD Million)
8.4.9. South Korea
8.4.9.1. Key Country Dynamics
8.4.9.2. Market Estimates and Forecasts, 2018 - 2030 (Kilotons) (USD Million)
8.4.9.3. Market Estimates and Forecasts, by Product, 2018 - 2030 (Kilotons) (USD Million)
8.4.9.4. Market Estimates and Forecasts, by Process, 2018 - 2030 (Kilotons) (USD Million)
8.4.9.5. Market Estimates and Forecasts, by Application, 2018 - 2030 (Kilotons) (USD Million)
8.4.9.6. Market Estimates and Forecasts, by Vehicle Type, 2018 - 2030 (Kilotons) (USD Million)
8.5. Central & South America
8.5.1. Market Estimates and Forecasts, 2018 - 2030 (Kilotons) (USD Million)
8.5.2. Market Estimates and Forecasts, by Product, 2018 - 2030 (Kilotons) (USD Million)
8.5.3. Market Estimates and Forecasts, by Process, 2018 - 2030 (Kilotons) (USD Million)
8.5.4. Market Estimates and Forecasts, by Application, 2018 - 2030 (Kilotons) (USD Million)
8.5.5. Market Estimates and Forecasts, by Vehicle Type, 2018 - 2030 (Kilotons) (USD Million)
8.5.6. Brazil
8.5.6.1. Key Country Dynamics
8.5.6.2. Market Estimates and Forecasts, 2018 - 2030 (Kilotons) (USD Million)
8.5.6.3. Market Estimates and Forecasts, by Product, 2018 - 2030 (Kilotons) (USD Million)
8.5.6.4. Market Estimates and Forecasts, by Process, 2018 - 2030 (Kilotons) (USD Million)
8.5.6.5. Market Estimates and Forecasts, by Application, 2018 - 2030 (Kilotons) (USD Million)
8.5.6.6. Market Estimates and Forecasts, by Vehicle Type, 2018 - 2030 (Kilotons) (USD Million)
8.6. Middle East & Africa
8.6.1. Market Estimates and Forecasts, 2018 - 2030 (Kilotons) (USD Million)
8.6.2. Market Estimates and Forecasts, by Product, 2018 - 2030 (Kilotons) (USD Million)
8.6.3. Market Estimates and Forecasts, by Process, 2018 - 2030 (Kilotons) (USD Million)
8.6.4. Market Estimates and Forecasts, by Application, 2018 - 2030 (Kilotons) (USD Million)
8.6.5. Market Estimates and Forecasts, by Vehicle Type, 2018 - 2030 (Kilotons) (USD Million)
Chapter 9. Automotive Plastics Market - Competitive Landscape
9.1. Recent Developments & Impact Analysis, By Key Market Participants
9.2. Company Categorization
9.3. Company Market Share/Position Analysis, 2023
9.4. Company Heat Map Analysis
9.5. Strategy Mapping
9.5.1. Expansion
9.5.2. Mergers & Acquisition
9.5.3. Partnerships & Collaborations
9.5.4. New Process Launches
9.5.5. Research And Development
9.6. Company Profiles
9.6.1. Akzon Nobel N.V.
9.6.1.1. Participant’s overview
9.6.1.2. Financial performance
9.6.1.3. Process benchmarking
9.6.1.4. Recent developments
9.6.2. BASF SE
9.6.2.1. Participant’s overview
9.6.2.2. Financial performance
9.6.2.3. Process benchmarking
9.6.2.4. Recent developments
9.6.3. Covestro AG
9.6.3.1. Participant’s overview
9.6.3.2. Financial performance
9.6.3.3. Process benchmarking
9.6.3.4. Recent developments
9.6.4. Evonik Industries AG
9.6.4.1. Participant’s overview
9.6.4.2. Financial performance
9.6.4.3. Process benchmarking
9.6.4.4. Recent developments
9.6.5. Adient plc
9.6.5.1. Participant’s overview
9.6.5.2. Financial performance
9.6.5.3. Process benchmarking
9.6.5.4. Recent developments
9.6.6. Magna International Inc.
9.6.6.1. Participant’s overview
9.6.6.2. Financial performance
9.6.6.3. Process benchmarking
9.6.6.4. Recent developments
9.6.7. Momentive Performance Materials, Inc.
9.6.7.1. Participant’s overview
9.6.7.2. Financial performance
9.6.7.3. Process benchmarking
9.6.7.4. Recent developments
9.6.8. SABIC
9.6.8.1. Participant’s overview
9.6.8.2. Financial performance
9.6.8.3. Process benchmarking
9.6.8.4. Recent developments
9.6.9. Dow, Inc.
9.6.9.1. Participant’s overview
9.6.9.2. Financial performance
9.6.9.3. Process benchmarking
9.6.9.4. Recent developments
9.6.10. Borealis AG
9.6.10.1. Participant’s overview
9.6.10.2. Financial performance
9.6.10.3. Process benchmarking
9.6.10.4. Recent developments
9.6.11. Hanwha Azdel Inc.
9.6.11.1. Participant’s overview
9.6.11.2. Financial performance
9.6.11.3. Process benchmarking
9.6.11.4. Recent developments
9.6.12. Grupo Antonin
9.6.12.1. Participant’s overview
9.6.12.2. Financial performance
9.6.12.3. Process benchmarking
9.6.12.4. Recent developments
9.6.13. Lear Corporation
9.6.13.1. Participant’s overview
9.6.13.2. Financial performance
9.6.13.3. Process benchmarking
9.6.13.4. Recent developments
9.6.14. Owens Corning
9.6.14.1. Participant’s overview
9.6.14.2. Financial performance
9.6.14.3. Process benchmarking
9.6.14.4. Recent developments
9.6.15. Quadrant AG
9.6.15.1. Participant’s overview
9.6.15.2. Financial performance
9.6.15.3. Process benchmarking
9.6.15.4. Recent developments
9.6.16. Royal DSM N.V.
9.6.16.1. Participant’s overview
9.6.16.2. Financial performance
9.6.16.3. Process benchmarking
9.6.16.4. Recent developments
9.6.17. TEIJIN LIMITED
9.6.17.1. Participant’s overview
9.6.17.2. Financial performance
9.6.17.3. Process benchmarking
9.6.17.4. Recent developments
List of Tables
Table 1 List of abbreviation
Table 2 Automotive Plastics market, 2018 - 2030 (Kilotons) (USD Million)
Table 3 Global market estimates and forecasts by region, 2018 - 2030 (Kilotons) (USD Million)
Table 4 Global market estimates and forecasts by product, 2018 - 2030 (Kilotons) (USD Million)
Table 5 Global market estimates and forecasts by process, 2018 - 2030 (Kilotons) (USD Million)
Table 6 Global market estimates and forecasts by application, 2018 - 2030 (Kilotons) (USD Million)
Table 7 Global market estimates and forecasts by vehicle type, 2018 - 2030 (Kilotons) (USD Million)
Table 8 Global market estimates and forecasts by region, 2018 - 2030 (Kilotons) (USD Million)
Table 9 North America automotive plastics market by product, 2018 - 2030 (Kilotons) (USD Million)
Table 10 North America automotive plastics market by process, 2018 - 2030 (Kilotons) (USD Million)
Table 11 North America automotive plastics market by application, 2018 - 2030 (Kilotons) (USD Million)
Table 12 North America automotive plastics market estimates and forecasts by vehicle type, 2, 22018 - 2030 (Kilotons) (USD Million)
Table 13 U.S. automotive plastics market by product, 2018 - 2030 (Kilotons) (USD Million)
Table 14 U.S. automotive plastics market by process, 2018 - 2030 (Kilotons) (USD Million)
Table 15 U.S. automotive plastics market by application, 2018 - 2030 (Kilotons) (USD Million)
Table 16 U.S. automotive plastics market estimates and forecasts by vehicle type, , 2018 - 2030 (Kilotons) (USD Million)
Table 17 Canada automotive plastics market by product, 2018 - 2030 (Kilotons) (USD Million)
Table 18 Canada automotive plastics market by process, 2018 - 2030 (Kilotons) (USD Million)
Table 19 Canada automotive plastics market by application, 2018 - 2030 (Kilotons) (USD Million)
Table 20 Canada automotive plastics market estimates and forecasts by vehicle type, , 2018 - 2030 (Kilotons) (USD Million)
Table 21 Mexico automotive plastics market by product, 2018 - 2030 (Kilotons) (USD Million)
Table 22 Mexico automotive plastics market by process, 2018 - 2030 (Kilotons) (USD Million)
Table 23 Mexico automotive plastics market by application, 2018 - 2030 (Kilotons) (USD Million)
Table 24 Mexico automotive plastics market estimates and forecasts by vehicle type, , 2018 - 2030 (Kilotons) (USD Million)
Table 25 Europe automotive plastics market by product, 2018 - 2030 (Kilotons) (USD Million)
Table 26 Europe automotive plastics market by application, 2018 - 2030 (Kilotons) (USD Million)
Table 27 Europe automotive plastics market by process, 2018 - 2030 (Kilotons) (USD Million)
Table 28 Europe automotive plastics market estimates and forecasts by vehicle type, , 2018 - 2030 (Kilotons) (USD Million)
Table 29 Germany automotive plastics market by product, 2018 - 2030 (Kilotons) (USD Million)
Table 30 Germany automotive plastics market by application, 2018 - 2030 (Kilotons) (USD Million)
Table 31 Germany automotive plastics market by process, 2018 - 2030 (Kilotons) (USD Million)
Table 32 Germany automotive plastics market estimates and forecasts by vehicle type, , 2018 - 2030 (Kilotons) (USD Million)
Table 33 UK automotive plastics market by product, 2018 - 2030 (Kilotons) (USD Million)
Table 34 UK automotive plastics market by application, 2018 - 2030 (Kilotons) (USD Million)
Table 35 UK automotive plastics market by process, 2018 - 2030 (Kilotons) (USD Million)
Table 36 UK automotive plastics market estimates and forecasts by vehicle type, , 2018 - 2030 (Kilotons) (USD Million)
Table 37 Italy automotive plastics market by product, 2018 - 2030 (Kilotons) (USD Million)
Table 38 Italy automotive plastics market by process, 2018 - 2030 (Kilotons) (USD Million)
Table 39 Italy automotive plastics market by application, 2018 - 2030 (Kilotons) (USD Million)
Table 40 Italy automotive plastics market estimates and forecasts by vehicle type, , 2018 - 2030 (Kilotons) (USD Million)
Table 41 France automotive plastics market by product, 2018 - 2030 (Kilotons) (USD Million)
Table 42 France automotive plastics market by process, 2018 - 2030 (Kilotons) (USD Million)
Table 43 France automotive plastics market by application, 2018 - 2030 (Kilotons) (USD Million)
Table 44 France automotive plastics market estimates and forecasts by vehicle type, , 2018 - 2030 (Kilotons) (USD Million)
Table 45 Asia Pacific automotive plastics market by product, 2018 - 2030 (Kilotons) (USD Million)
Table 46 Asia Pacific automotive plastics market by process, 2018 - 2030 (Kilotons) (USD Million)
Table 47 Asia Pacific automotive plastics market by application, 2018 - 2030 (Kilotons) (USD Million)
Table 48 Asia Pacific automotive plastics market estimates and forecasts by vehicle type, , 2018 - 2030 (Kilotons) (USD Million)
Table 49 China automotive plastics market by product, 2018 - 2030 (Kilotons) (USD Million)
Table 50 China automotive plastics market by process, 2018 - 2030 (Kilotons) (USD Million)
Table 51 China automotive plastics market by application, 2018 - 2030 (Kilotons) (USD Million)
Table 52 China automotive plastics market estimates and forecasts by vehicle type, , 2018 - 2030 (Kilotons) (USD Million)
Table 53 India automotive plastics market by product, 2018 - 2030 (Kilotons) (USD Million)
Table 54 India automotive plastics market by process, 2018 - 2030 (Kilotons) (USD Million)
Table 55 India automotive plastics market by application, 2018 - 2030 (Kilotons) (USD Million)
Table 56 India automotive plastics market estimates and forecasts by vehicle type, , 2018 - 2030 (Kilotons) (USD Million)
Table 57 Japan automotive plastics market by product, 2018 - 2030 (Kilotons) (USD Million)
Table 58 Japan automotive plastics market by process, 2018 - 2030 (Kilotons) (USD Million)
Table 59 Japan automotive plastics market by application, 2018 - 2030 (Kilotons) (USD Million)
Table 60 Japan automotive plastics market estimates and forecasts by vehicle type, , 2018 - 2030 (Kilotons) (USD Million)
Table 61 South Korea automotive plastics market by product, 2018 - 2030 (Kilotons) (USD Million)
Table 62 South Korea automotive plastics market by process, 2018 - 2030 (Kilotons) (USD Million)
Table 63 South Korea automotive plastics market by application, 2018 - 2030 (Kilotons) (USD Million)
Table 64 South Korea automotive plastics market estimates and forecasts by vehicle type, , 2018 - 2030 (Kilotons) (USD Million)
Table 65 Central & South America automotive plastics market by product, 2018 - 2030 (Kilotons) (USD Million)
Table 66 Central & South America automotive plastics market by process, 2018 - 2030 (Kilotons) (USD Million)
Table 67 Central & South America automotive plastics market by application, 2018 - 2030 (Kilotons) (USD Million)
Table 68 Central & South America automotive plastics market estimates and forecasts by vehicle type, , 2018 - 2030 (Kilotons) (USD Million)
Table 69 Brazil automotive plastics market by product, 2018 - 2030 (Kilotons) (USD Million)
Table 70 Brazil automotive plastics market by process, 2018 - 2030 (Kilotons) (USD Million)
Table 71 Brazil automotive plastics market by application, 2018 - 2030 (Kilotons) (USD Million)
Table 72 Brazil automotive plastics market estimates and forecasts by vehicle type, , 2018 - 2030 (Kilotons) (USD Million)
Table 73 Middle East & Africa automotive plastics market by product, 2018 - 2030 (Kilotons) (USD Million)
Table 74 Middle East & Africa automotive plastics market by process, 2018 - 2030 (Kilotons) (USD Million)
Table 75 Middle East & Africa automotive plastics market by application, 2018 - 2030 (Kilotons) (USD Million)
Table 76 Middle East & Africa automotive plastics market estimates and forecasts by vehicle type, , 2018 - 2030 (Kilotons) (USD Million)
List of Figures
Fig. 1 Market research process
Fig. 2 Data triangulation techniques
Fig. 3 Primary research pattern
Fig. 4 Market research approaches
Fig. 5 Information Procurement
Fig. 6 Market Formulation and Validation
Fig. 7 Data Validating & Publishing
Fig. 8 Market Segmentation & Scope
Fig. 9 Automotive Plastics Market Snapshot
Fig. 10 Product Segment Snapshot, 2023 (USD Million)
Fig. 11 Process Segment Snapshot, 2023 (USD Million)
Fig. 12 Application Segment Snapshot, 2023 (USD Million)
Fig. 13 Competitive Landscape Snapshot
Fig. 14 Parent market outlook
Fig. 15 Automotive Plastics Market Value, 2023 (USD Million)
Fig. 16 Automotive Plastics Market - Value Chain Analysis
Fig. 17 Automotive Plastics Market - Market Dynamics
Fig. 18 Automotive Plastics Market - PORTER’s Analysis
Fig. 19 Automotive Plastics Market - PESTEL Analysis
Fig. 20 Automotive Plastics Market Estimates & Forecasts, By Product: Key Takeaways
Fig. 21 Automotive Plastics Market Share, By Product, 2022 & 2030
Fig. 22 ABS Market Estimates & Forecasts, 2018 - 2030 (Kilotons) (USD Million)
Fig. 23 PP Market Estimates & Forecasts, 2018 - 2030 (Kilotons) (USD Million)
Fig. 24 PU Market Estimates & Forecasts, 2018 - 2030 (Kilotons) (USD Million)
Fig. 25 PVC Market Estimates & Forecasts, 2018 - 2030 (Kilotons) (USD Million)
Fig. 26 PE Market Estimates & Forecasts, 2018 - 2030 (Kilotons) (USD Million)
Fig. 27 PC Market Estimates & Forecasts, 2018 - 2030 (Kilotons) (USD Million)
Fig. 28 PMMA Market Estimates & Forecasts, 2018 - 2030 (Kilotons) (USD Million)
Fig. 29 PA Market Estimates & Forecasts, 2018 - 2030 (Kilotons) (USD Million)
Fig. 30 Others Market Estimates & Forecasts, 2018 - 2030 (Kilotons) (USD Million)
Fig. 31 Automotive Plastics Market Estimates & Forecasts, By Process: Key Takeaways
Fig. 32 Automotive Plastics Market Share, By Process, 2022 & 2030
Fig. 33 Injection Molding Market Estimates & Forecasts, 2018 - 2030 (Kilotons) (USD Million)
Fig. 34 Blow Molding Market Estimates & Forecasts, 2018 - 2030 (Kilotons) (USD Million)
Fig. 35 Thermoforming Market Estimates & Forecasts, 2018 - 2030 (Kilotons) (USD Million)
Fig. 36 Others Market Estimates & Forecasts, 2018 - 2030 (Kilotons) (USD Million)
Fig. 37 Automotive Plastics Market Estimates & Forecasts, By Application: Key Takeaways
Fig. 38 Automotive Plastics Market Share, By Application, 2023 & 2030
Fig. 39 Automotive Plastics Market Estimates & Forecasts, in Powertrains, 2018 - 2030 (Kilotons) (USD Million)
Fig. 40 Automotive Plastics Market Estimates & Forecasts, in Electrical Components, 2018 - 2030 (Kilotons) (USD Million)
Fig. 41 Automotive Plastics Market Estimates & Forecasts, in Interior Furnishing, 2018 - 2030 (Kilotons) (USD Million)
Fig. 42 Automotive Plastics Market Estimates & Forecasts, in Exterior Furnishing, 2018 - 2030 (Kilotons) (USD Million)
Fig. 43 Automotive Plastics Market Estimates & Forecasts, in Under the Hood, 2018 - 2030 (Kilotons) (USD Million)
Fig. 44 Automotive Plastics Market Estimates & Forecasts, in Chassis, 2018 - 2030 (Kilotons) (USD Million)
Fig. 45 Automotive Plastics Market Estimates & Forecasts, By Vehicle Type: Key Takeaways
Fig. 46 Automotive Plastics Market Share, By Vehicle Type, 2023 & 2030
Fig. 47 Automotive Plastics Market Estimates & Forecasts, in Passenger Cars, 2018 - 2030 (Kilotons (USD Million)
Fig. 48 Automotive Plastics Market Estimates & Forecasts, in Internal Combustion Engine Vehicles, 2018 - 2030 (Kilotons (USD Million)
Fig. 49 Automotive Plastics Market Estimates & Forecasts, in Electric Vehicles, 2018 - 2030 (Kilotons (USD Million)
Fig. 50 Automotive Plastics Market Estimates & Forecasts, in BEV, 2018 - 2030 (Kilotons (USD Million)
Fig. 51 Automotive Plastics Market Estimates & Forecasts, in PHEV, 2018 - 2030 (Kilotons (USD Million)
Fig. 52 Automotive Plastics Market Estimates & Forecasts, in FCEV, 2018 - 2030 (Kilotons (USD Million)
Fig. 53 Automotive Plastics Market Estimates & Forecasts, in Light Commercial Vehicles, 2018 - 2030 (Kilotons (USD Million)
Fig. 54 Automotive Plastics Market Estimates & Forecasts, in Medium & Heavy Commercial Vehicles, 2018 - 2030 (Kilotons (USD Million)
Fig. 55 Automotive Plastics Market Revenue, By Region, 2023 & 2030 (USD Million)
Fig. 56 North America Automotive Plastics Market Estimates & Forecasts, 2018 - 2030 (Kilotons) (USD Million)
Fig. 57 U.S. Automotive Plastics Market Estimates & Forecasts, 2018 - 2030 (Kilotons) (USD Million)
Fig. 58 Canada Automotive Plastics Market Estimates & Forecasts, 2018 - 2030 (Kilotons) (USD Million)
Fig. 59 Mexico Automotive Plastics Market Estimates & Forecasts, 2018 - 2030 (Kilotons) (USD Million)
Fig. 60 Europe Automotive Plastics Market Estimates & Forecasts, 2018 - 2030 (Kilotons) (USD Million)
Fig. 61 Germany Automotive Plastics Market Estimates & Forecasts, 2018 - 2030 (Kilotons) (USD Million)
Fig. 62 UK Automotive Plastics Market Estimates & Forecasts, 2018 - 2030 (Kilotons) (USD Million)
Fig. 63 Italy Automotive Plastics Market Estimates & Forecasts, 2018 - 2030 (Kilotons) (USD Million)
Fig. 64 France Automotive Plastics Market Estimates & Forecasts, 2018 - 2030 (Kilotons) (USD Million)
Fig. 65 Asia Pacific Automotive Plastics Market Estimates & Forecasts, 2018 - 2030 (Kilotons) (USD Million)
Fig. 66 China Automotive Plastics Market Estimates & Forecasts, 2018 - 2030 (Kilotons) (USD Million)
Fig. 67 India Automotive Plastics Market Estimates & Forecasts, 2018 - 2030 (Kilotons) (USD Million)
Fig. 68 Japan Automotive Plastics Market Estimates & Forecasts, 2018 - 2030 (Kilotons) (USD Million)
Fig. 69 South Korea Automotive Plastics Market Estimates & Forecasts, 2018 - 2030 (Kilotons) (USD Million)
Fig. 70 Central & South America Automotive Plastics Market Estimates & Forecasts, 2018 - 2030 (Kilotons) (USD Million)
Fig. 71 Brazil Automotive Plastics Market Estimates & Forecasts, 2018 - 2030 (Kilotons) (USD Million)
Fig. 72 Middle East & Africa Automotive Plastics Market Estimates & Forecasts, 2018 - 2030 (Kilotons) (USD Million)
Fig. 73 Key Company Categorization
Fig. 74 Company Market Positioning
Fig. 75 Key Company Market Share Analysis, 2023
Market Segmentation
The automotive industry witnessed a significant transformation owing to the growing emphasis on reducing the weight of the vehicle to improve fuel efficiency. Rapid technological advancements in the manufacturing of thermoplastics elastomers, and automobile components, coupled with plastics are discovering innovative applications in the automotive industry. Furthermore, the usage of plastics is expected to grow over the coming years due to improved regulations. Plastic is available in regions such as Europe, Japan, and India. Plastics include polymers such as polyurethane, polypropylene, and polyamides. These plastics add the property of binding. They can be bound together, unlike metals, which require welding. The growing awareness about vehicle weight and fuel economy is expected to boost market growth. Utilization of plastics in the automotive sector is driven by the necessity of security, light-weight, and cost-effective sport-utility vehicle (SUV) or multi-utility vehicle (MUV) models that prioritize high fuel efficiency and place an emphasis on comfort and aesthetics.
Several government and federal regulations have been implemented to regulate and control plastic waste. Plastics are non-biodegradable. It requires an intensive recycling process in order to avoid or reduce potential harm to the environment and all living beings. Burning of plastics generates gases such as hydrochloric acid, carbon monoxide, acetaldehyde, styrene, amines, nitrides, and butadiene. Several automotive OME companies are recycling waste plastics to produce multiple parts in vehicles. Plastics used in automotive manufacturing are compounded with fiberglass and additives to improve stability and mechanical properties. These factors are estimated to boost market growth in the coming years.
Fluctuation in raw material prices such as crude oil, natural gas, and coal, along with salt and sand. Owing to political instability and supply-demand imbalances are anticipated to harm market growth over the forecast period.
This section will provide insights into the contents included in this smart automotive plastics report and help gain clarity on the structure of the report to assist readers in navigating smoothly.
Industry overview
Industry trends
Market drivers and restraints
Market size
Growth prospects
Porter’s analysis
PESTEL analysis
Key market opportunities prioritized
Competitive landscape
Company overview
Financial performance
Product benchmarking
Latest strategic developments
Market size, estimates, and forecast from 2018 to 2030
Market estimates and forecast for product segments up to 2030
Regional market size and forecast for product segments up to 2030
Market estimates and forecast for application segments up to 2030
Regional market size and forecast for application segments up to 2030
Company financial performance
A three-pronged approach was followed for deducing the automotive plastics market estimates and forecasts. The process has three steps: information procurement, analysis, and validation. The whole process is cyclical, and steps repeat until the estimates are validated. The three steps are explained in detail below:
Information procurement: Information procurement is one of the most extensive and important stages in our research process, and quality data is critical for accurate analysis. We followed a multi-channel data collection process for automotive plastics market to gather the most reliable and current information possible.
Analysis: We mine the data collected to establish baselines for forecasting, identify trends and opportunities, gain insight into consumer demographics and drivers, and so much more. We utilized different methods of automotive plastics market data depending on the type of information we’re trying to uncover in our research.
Market Research Efforts: Bottom-up Approach for estimating and forecasting demand size and opportunity, top-down Approach for new product forecasting and penetration, and combined approach of both Bottom-up and Top-down for full coverage analysis.
Value-Chain-Based Sizing & Forecasting: Supply-side estimates for understanding potential revenue through competitive benchmarking, forecasting, and penetration modeling.
Demand-side estimates for identifying parent and ancillary markets, segment modeling, and heuristic forecasting.
Qualitative Functional Deployment (QFD) Modelling for market share assessment.
Market formulation and validation: We mine the data collected to establish baselines for forecasting, identify trends and opportunities, gain insight into consumer demographics and drivers, and so much more. We utilize different methods of data analysis depending on the type of information we’re trying to uncover in our research.
Market Formulation: This step involves the finalization of market numbers. This step on an internal level is designed to manage outputs from the Data Analysis step.
Data Normalization: The final market estimates and forecasts are then aligned and sent to industry experts, in-panel quality control managers for validation.
This step also entails the finalization of the report scope and data representation pattern.
Validation: The process entails multiple levels of validation. All these steps run in parallel, and the study is forwarded for publishing only if all three levels render validated results.
The automotive plastics market was categorized into five segments, namely product (Acrylonitrile butadiene styrene, Polypropylene, Polyurethane, Polyvinyl Chloride, Polyethylene, Polybutylene Terephthalate, Polycarbonate, Polymethyl methacrylate, Polyamide), process (Injection Molding, Blow Molding, Thermoforming), application (Powertrains, Electrical Components, Interior Furnishing, Exterior Furnishing, Under the hood, Chassis), vehicle type (Passenger Cars, Light Commercial Vehicles, Medium & Heavy Commercial Vehicles ) and regions (North America, Europe, Asia Pacific, Central & South America, Middle East & Africa).
The automotive plastics market was segmented into product, process, vehicle type, application, and regions. The demand at a segment level was deduced using a funnel method. Concepts like the TAM, SAM, SOM, etc., were put into practice to understand the demand. We at GVR deploy three methods to deduce market estimates and determine forecasts. These methods are explained below:
Demand estimation of each product across countries/regions summed up to from the total market.
Variable analysis for demand forecast.
Demand estimation via analyzing paid database, and company financials either via annual reports or paid database.
Primary interviews for data revalidation and insight collection.
Used extensively for new product forecasting or analyzing penetration levels.
Tool used invoice product flow and penetration models Use of regression multi-variant analysis for forecasting Involves extensive use of paid and public databases.
Primary interviews and vendor-based primary research for variable impact analysis.
The automotive plastics market was analyzed at a regional level. The globe was divided into North America, Europe, Asia Pacific, Central & South America, and Middle East & Africa, keeping in focus variables like consumption patterns, export-import regulations, consumer expectations, etc. These regions were further divided into twenty-five countries, namely, the U.S.; Canada; Mexico; Germany; the UK; France; Italy; China; India; Japan; Southeast Asia; and Brazil.
All three above-mentioned market research methodologies were applied to arrive at regional-level conclusions. The regions were then summed up to form the global market.
The automotive plastics market was analyzed via companies operating in the sector. Analyzing these companies and cross-referencing them to the demand equation helped us validate our assumptions and conclusions. Key market players analyzed include:
Borealis AG - . The company has classified its businesses into polyolefin, base chemicals, and fertilizers. Polyolefin business caters to various end-use industries such as automotive, construction, consumer goods, energy, and medical while fertilizer business caters to the agriculture industry. Base chemicals business includes hydrocarbons for oil & gas and energy, melamine & carbonate, and nitrogen products. The company is engaged in manufacturing and supplying plastics such as polyethylene, polypropylene, polyolefin, and other plastic products.
Dow Inc. - Founded in 2019 and located in Midland, U.S. The company operates through three segments, namely industrial intermediates & infrastructure; performance materials & coatings; and packaging & specialty plastics. The company caters its plastic products to various enduse industries such as consumer goods, healthcare, food & beverage, personal care, construction, life sciences, paints & coatings, and paper. The products offered under this segment find application in industries such as packaging, industrial infrastructure, and consumer goods. Specialty products segment offers electronics & imaging, industrial biosciences, nutrition & health, safety & construction, sustainable solutions, and transportation & advanced polymers and serves end-use industries including aerospace, automotive, electronics, defense, printing, energy, packaging, consumer goods, and construction.
SABIC - The company has 9 manufacturing plants located in the U.S., Argentina, and Mexico in North & South America, 3 located in China, Japan, and South Korea in Asia Pacific; and 13 located in the UK, Germany, Italy, Belgium. The company is traded on the Saudi Arabia stock exchange, with a majority of the stock of the company owned by the Saudi Arabian government. The company operates through five major segments including polymers, chemicals, specialties, agrinutrients, and metals.
Momentive Performance Materials, Inc. - The company is involved in the manufacturing of silicone & silicone derivatives and advanced materials. It delivers science-based solutions and sells & distributes specialty silicones, silanes, and urethane additives. The company caters its products to various industries including aerospace, automotive, agriculture, construction, consumer goods, electrical & electronics, medical, packaging, and oil & gas.
Magna International, Inc. - The company is engaged in the designing, manufacturing, and developing of automotive systems, assemblies, modules, and components, and in assembling complete vehicles. It operates through four business segments, namely body exteriors & structure, seating systems, power & vision, and complete vehicles. Body exteriors & structure segment engaged in the designing and engineering of vehicle architecture to improve vehicle performance. Seating systems segment offers complete seats and foams & trims for the manufacturing of automotive seats.
Adient plc - Founded in 2016, and located in U.S. Adient plc is a spin-off from Johnson Controls International plc. In the year 1985, Johnson Controls International plc entered the business of automotive seating after acquiring Hoover Universal. Adient plc is engaged in the manufacturing and supplying of automotive seating for passenger vehicles, light commercial vehicles, and heavy commercial vehicles. The company’s product portfolio includes complete seats for passenger vehicles, commercial vehicle seats for light and heavy commercial vehicles, structure & mechanisms for the vehicle chassis, fabrics, foams, and trims for various interior applications in the automotive. The foams manufactured by the company are made of polyurethane material and are supplied to other seating system manufacturers who cater to end-use industries such as automotive, and consumer goods.
Evonik Industries AG - Founded in 2007 and situated in Germany. The company operates through three business segments, namely nutrition & care, performance materials, and resource efficiency, and caters to various end-use industries including adhesives & sealants, agriculture, automotive, composites, construction, food, pharmaceutical, energy, paints & coatings, and tire & rubber.
Covestro AG - Covestro AG established in 2015 and situated in Leverkusen, Germany. The company has segmented its business into three categories: polycarbonates (PC), polyurethanes (PU), and adhesives & coatings. The company serves various end-use industries such as consumer goods, electrical & electronics, automotive, construction, healthcare, cosmetics, medical, wood & furniture, and packaging.
BASF SE - BASF SE operates through six business segments, namely chemicals, materials, industrial solutions, surface technologies, nutrition & care, and agricultural solutions. The products offered by the company find use in industries such as agriculture, construction, pharmaceuticals, energy & power, home care & nutrition, automotive & transportation, rubber & plastics, leather & textiles, and personal care & hygiene. The company has more than 355 manufacturing facilities in over 90 countries in regions including Europe, Asia Pacific, North America, Central America, South America, and the Middle East & Africa.
Akzo Nobel N.V. - Established in 1994 and located in Amsterdam, Netherlands. The firm operates through three business segments including specialty chemicals, performance coatings, and decorative paints. The company is involved in manufacturing and marketing a wide range of chemicals. Key products offered by the company include functional chemicals, industrial chemicals, pulp & performance chemicals, powder coatings, and automotive & aerospace coatings.
Supply Side Estimates
Company revenue estimation via referring to annual reports, investor presentations, and Hoover’s.
Segment revenue determination via variable analysis and penetration modeling.
Competitive benchmarking to identify market leaders and their collective revenue shares.
Forecasting via analyzing commercialization rates, pipelines, market initiatives, distribution networks, etc.
Demand side estimates
Identifying parent markets and ancillary markets
Segment penetration analysis to obtain pertinent
revenue/volume
Heuristic forecasting with the help of subject matter experts
Forecasting via variable analysis
Understanding market dynamics (in terms of drivers, restraints, & opportunities) in the countries.
Understanding trends & variables in the individual countries & their impact on growth and using analytical tools to provide high-level insights into the market dynamics and the associated growth pattern.
Understanding market estimates and forecasts (with the base year as 2023, historic information from 2018 to 2023, and forecast from 2024 to 2030). Regional estimates & forecasts for each category are available and are summed up to form the global market estimates.
The report provides market value for the base year 2023 and a yearly forecast till 2030 in terms of revenue/volume or both. The market for each of the segment outlooks has been provided on region & country basis for the above-mentioned forecast period.
The key industry dynamics, major technological trends, and application markets are evaluated to understand their impact on the demand for the forecast period. The growth rates were estimated using correlation, regression, and time-series analysis.
We have used the bottom-up approach for market sizing, analyzing key regional markets, dynamics, & trends for various products and end-users. The total market has been estimated by integrating the country markets.
All market estimates and forecasts have been validated through primary interviews with the key industry participants.
Inflation has not been accounted for to estimate and forecast the market.
Numbers may not add up due to rounding off.
Europe consists of EU-8, Central & Eastern Europe, along with the Commonwealth of Independent States (CIS).
Asia Pacific includes South Asia, East Asia, Southeast Asia, and Oceania (Australia & New Zealand).
Latin America includes Central American countries and the South American continent
Middle East includes Western Asia (as assigned by the UN Statistics Division) and the African continent.
GVR strives to procure the latest and unique information for reports directly from industry experts, which gives it a competitive edge. Quality is of utmost importance to us, therefore every year we focus on increasing our experts’ panel. Primary interviews are one of the critical steps in identifying recent market trends and scenarios. This process enables us to justify and validate our market estimates and forecasts to our clients. With more than 8,000 reports in our database, we have connected with some key opinion leaders across various domains, including healthcare, technology, consumer goods, and the chemical sector. Our process starts with identifying the right platform for a particular type of report, i.e., emails, LinkedIn, seminars, or telephonic conversation, as every report is unique and requires a differentiated approach.
We send out questionnaires to different experts from various regions/ countries, which is dependent on the following factors:
Report/Market scope: If the market study is global, we send questionnaires to industry experts across various regions, including North America, Europe, Asia Pacific, Latin America, and MEA.
Market Penetration: If the market is driven by technological advancements, population density, disease prevalence, or other factors, we identify experts and send out questionnaires based on region or country dominance.
The time to start receiving responses from industry experts varies based on how niche or well-penetrated the market is. Our reports include a detailed chapter on the KoL opinion section, which helps our clients understand the perspective of experts already in the market space.
NEED A CUSTOM REPORT?
We can customize every report - free of charge - including purchasing stand-alone sections or country-level reports, as well as offer affordable discounts for start-ups & universities. Contact us now
We are GDPR and CCPA compliant! Your transaction & personal information is safe and secure. For more details, please read our privacy policy.
"The quality of research they have done for us has been excellent."