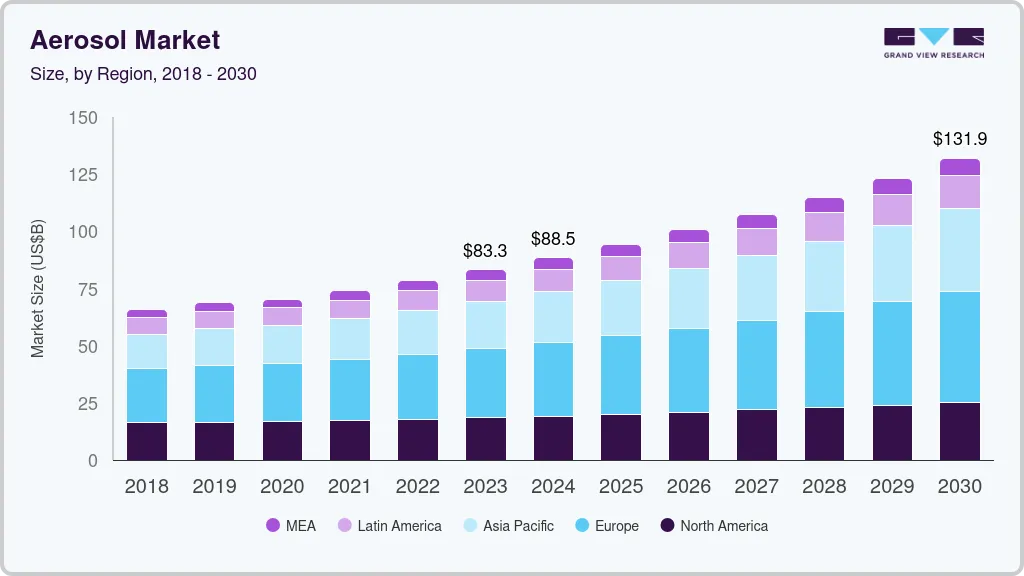
The global aerosol market size was estimated at USD 83.29 billion in 2023 and is expected to grow at a CAGR of 6.9% from 2024 to 2030. The industry is anticipated to be driven by the growing demand for various products including deodorants, hair sprays, hair mousse, dry shampoos, insecticides, air fresheners, cleaning, lubricants, and medical spray.
The market is rapidly increasing due to expanding personal care and household industry. Aerosol finds wide applications including personal care & household products such as hair sprays, deodorants, insecticides, shaving gels, fabric care, air fresheners, furniture polish, oven cleaners, and leather care. Other applications include automotive, paints & varnishes, industrial, pharmaceutical, veterinary, and food industries. The introduction of new product formats and gender-specific products is expected to drive the demand for personal care products. The growing use of aerosol propellants in hair sprays, styling mousses, and deodorants & antiperspirants is expected to further drive the market.
Furthermore, companies such as S. C. Johnson & Son, Inc. have been continuously making efforts to promote the usage of the repellent and its benefits. Therefore, increasing usage of repellents has been boosting the demand for aerosols in the household segment. Increasing use of Clean Development Mechanism (CDM) in the domestic manufacturing industry and the adoption of the Montreal Protocol is anticipated to restrict the demand for products emitting VOC compounds. Therefore, regulatory inclination concerning the restriction of VOC emissions is anticipated to restrict the demand for aerosol owing to HFC composition. Further, the demand for sanitizing spray and disinfectants is also expected to rise significantly in the country owing to the increased cleaning amid the COVID-19 outbreak. This is expected to support the demand growth of aerosol in household application.
Key players operating in the aerosol market are now shifting their focus to producing recyclable aerosols to reduce carbon footprint and their products market. For instance, in June 2022, Ball Corporation launched a new low-carbon footprint aluminum aerosol can, in line with its 2030 science-based targets and net-zero emissions prior to 2050. The newly launched cans incorporate up to 50% recycled content as well as low carbon aluminum that has been smelted using renewable energy sources, such as hydroelectric power. Producing cans with recycled content and low-carbon aluminum helps support the company’s progress toward reducing absolute value chain emissions by 16% by 2030.
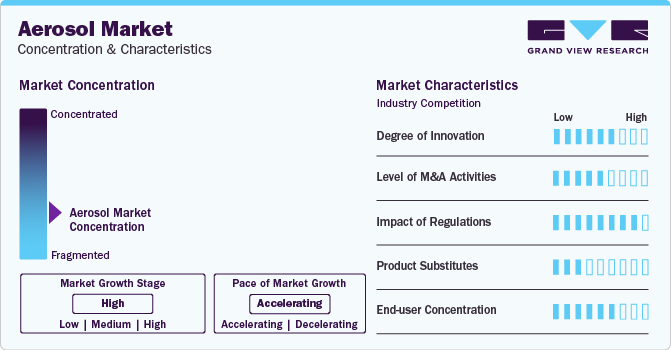
The market is highly fragmented due to the presence of a large number of players across the world. Increasing preference for aerosol products by consumers owing to ease of product handling has been driving the existing consumer goods companies to offer their products in aerosol forms. Besides, the growing packaged food and consumer goods industries across the world have further been fueling the aerosol demand. On account of growing end-use industries globally, the existing companies are expected to enter new geographies along with the emergence of new entrants in the market.
For instance, in April 2022, Sidel launched PressureSAFE, an innovative PET aerosol container design for home and personal care brands. This new PET product-packaging solution is approved for the traditional PET recycling stream. This newly launched product is intended for use with products such as perfumes and deodorants.
In May 2022, The Can Manufacturers Institute (CMI) and the Household & Commercial Products Association (HCPA) launched an Aerosol Recycling Initiative with the support of almost 20 companies across the aerosol value chain to increase access to aerosol recycling and on-pack recyclability messaging. The initiative’s goal is to achieve by 2030 at least an 85 % recycling access rate for all aerosol cans and label at least 90% of aerosols as recyclable.
Based on materials, the market can be segmented into steel, aluminum, and others. The aluminum segment dominated the market with the largest revenue share of 60.8% in 2023 and is also projected to expand at a considerable growth rate over the forecast period. Aluminum is an environment-friendly material and can be recycled multiple times. In addition, it also offers robust packaging and significantly enhances the aesthetic appeal of the product. These factors are majorly contributing to the growth of the segment.
Increasing aluminum prices are leading to a rise in the final costs of aerosols. On account of this factor, aerosol manufacturers are expected to opt for a low-priced alternative, which may hamper the growth of the aluminum material segment in the coming years. The plastic material segment has also been experiencing significant demand for the past few years due to the low weight, low cost, and high recyclability of PET plastic. However, a strict ban on plastic packaging, especially in Europe, is expected to hamper the growth of this segment over the coming years.
The personal care segment dominated the market with the largest revenue share in 2023. The segment is driven by the growing demand for hair care products and deodorants. The demand for personal care products is increasing in emerging economies owing to the changing lifestyle, rising consumer spending, and emphasis on gender-specific products.
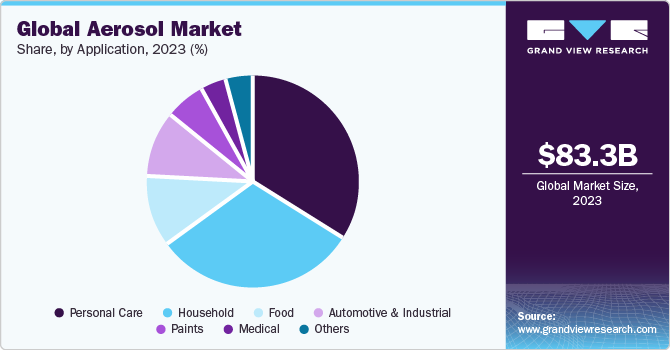
The rapid growth of the household segment is attributed to the improvement in standards of living and emphasis on hygiene, especially in developing regions. This has led to a rise in the consumption of household products like air fresheners, cleaners, sanitizing agents, and disinfectants. Dispersion of these products in less quantity reduces wastage and increases their longevity.
The standard type segment dominated the market with the largest revenue share in 2023 and is projected to continue its dominance throughout the forecast period. This segment includes continuous and metering type valves; continuous valves are used in applications where continuous spray is required. The increasing utilization of these valves in food products, technical products, and home care products, such as insecticides, rodenticides, and decoration products, is expected to drive the segment growth. Metered valves are specifically preferred for efficient dispensing of metered doses, thus used in pharmaceutical applications and air fresheners.
Bag-in-valve is a packaging technology wherein the bag containing the product is welded to the valve. The propellant is placed in between the bag and the can. Therefore, the propellant and the product are completely separated from each other, which improves the integrity of the packaged product. In a bag-in-valve aerosol, the product is dispensed mainly by the propellant by squeezing the bag after the pressing of the spray button. Cosmetic, medical, and food products are usually packaged in the aerosol with a bag-in-valve to maintain the purity of the product. The bag in the valve offers nearly 99.5% product dispersion; the bag is usually made of four-layer laminates, which minimizes the possibility of oxidation, and the product is hermetically sealed with the bag. These advantages are attracting various product manufacturers toward the bag in the valve aerosol type segment.
North America aerosol market is projected to grow at a CAGR of 4.6% during the forecast period. The use of aerosols in hair sprays, shaving gels, insecticides, deodorants, air fresheners, oven cleaners, fabric care products, furniture polishes, leather care products, and different personal care products is a crucial driver for the growth of the market in the region. Moreover, the high levels of disposable income in the U.S. and Canada are also contributing to the consumption of cosmetics and personal care products.
The aerosol market in the U.S. is expected to grow over the forecast period owing to the surging demand for vehicles. According to the International Organization of Motor Vehicle Manufacturers, total vehicles in use in the U.S. increased by 9.4%, reaching 289.04 million units in 2020 from 264.19 million units in 2015. This surging ownership of vehicles in the country is driving the growth of aerosol market in the U.S. as aerosols are used for greasing, spray painting, and lubricating vehicles.
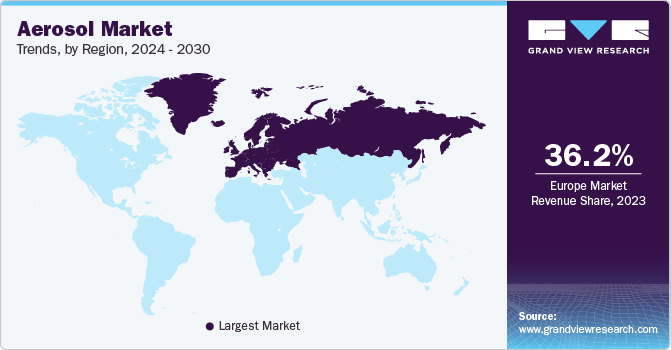
The aerosol market in Europe held the largest market share of 36.2% in terms of revenue in 2023. The region is also the leading producer of aerosols. Its large share is mainly attributable to the personal care industry. Factors including high cosmetics consumption, rapid growth in the fragrance industry, and increasing consumer spending are boosting the regional market growth.
The Germany aerosol market is growing as consumers in the country are switching toward sustainable aerosol solutions, thereby surging the demand for them in the country. Companies are adopting various strategies to cater to this demand for green aerosol solutions. For instance, in February 2024, Wolf Group OÜ expanded its operations by establishing a new entity, Wolf Group Deutschland GmbH, in Germany. This move marks the 14th sales branch of the group. Wolf Group Deutschland GmbH is part of the strategic efforts of the company to strengthen its position in the D-A-CH region (Germany, Austria, and Switzerland).
The aerosol market in the UK is expected to grow in the upcoming years. The rapid growth of e-commerce platforms in the UK has also impacted the dynamics of aerosol market. Online retail channels provide a convenient avenue for consumers to purchase aerosol products, thereby leading to increased accessibility of consumers to these products and enhanced visibility for their manufacturers.
The Asia Pacific emerged as the fastest-growing region in the aerosol market, as the middle-class millennial population has been significantly growing in emerging countries such as India and China for the past several years. For instance, millennials held a majority share of India’s overall working population in 2022. Millennials are characterized by high levels of disposable income and are digitally connected individuals. Therefore, this population group is well informed and a significant consumer of various personal care products such as deodorants, hair mousse, hair spray, and shaving foam. Furthermore, the working millennial population in India is increasing at a considerably higher rate as compared to the rest of the world, which, in turn, is expected to impact positively on the aerosol market in the Asia Pacific.
The China aerosol market is expected to grow during the forecast period. China's rapid urbanization has led to lifestyle changes and increased demand for aerosol products, particularly in urban centers where consumers seek convenience and efficiency. The expanding middle-class population has disposable income available to spend on personal care and household products, which will drive the market for aerosol-based cosmetics, air fresheners, and cleaning products.
The aerosol market in India is growing as one of the major consumers of personal care products owing to its large population coupled with the increased adoption rate for such products. Increasing awareness for hygiene and the social image is augmenting the consumption of aerosol products in household applications. The aforementioned reasons are expected to propel the demand for aerosol products in the country over the forecast period.
Rising per capita income in the Central & South America region is responsible for the increased spending on premium beauty products in various Central & South American countries. Avon, Beiersdorf, Natura, Boticario, P&G, and Unilever are the key personal care manufacturers operating in the region. The region is also home to a thriving middle-income group, which is expected to drive the demand for various personal care and household products in the coming years.
The Brazil is one of the largest markets in the region for aerosol consumption, primarily driven by rising income levels, increasing preference toward personal care products, and affordability of hygiene products. According to the World Bank, Brazil’s GNI per capita increased to 17,270 PPP dollars in 2022 from 15,750 PPP dollars in 2021. The market is complemented by the presence of large corporations focused on metal-based packaging solutions. Brazil is one of the top 10 steel-producing countries in the world with the presence of leading vertically integrated steel producers. Brazil is also one of the top 20 aluminum-producing countries followed by Argentina in the region
Key companies are increasingly adopting market strategies such as new product launches, and joint venture to strengthen their market position and expand into new territories.
In March 2024, Procter & Gamble patented an aerosol package design that utilizes adsorbent materials as propellants, maintaining pressure within the package throughout its lifespan. The design includes a bag, can, and valve with an adsorption matrix of Metal-Organic Framework (MOF) and carbon dioxide, ensuring pressure stability. This innovation highlights Procter & Gamble's focus on patenting strategies and nano-emulsion cosmetics, with a grant share of 52% as of January 2024.
In September 2023, Beiersdorf announced that all deodorant cans in the European assortment of NIVEA, 8X4, Hidrofugal, and Hansaplast will contain at least 50% recycled aluminum and will weigh 11.6% less. This will reduce CO2 emissions in the aerosol can value chain by around 58%. This corresponds to a reduction of around 30 tons of CO2 per year.
In October 2023, Colep Packaging and Envases Group signed a joint venture agreement for the construction of an aerosol packaging plant in Mexico. the new plant will produce 3 aluminum aerosol lines, which serve customers in Mexico as well as the Central America market using this production unit.
The following are the leading companies in the aerosol market. These companies collectively hold the largest market share and dictate industry trends.
Report Attribute |
Details |
Market size value in 2024 |
USD 88.55 billion |
Revenue forecast in 2030 |
USD 131.93 billion |
Growth rate |
CAGR of 6.9% from 2024 to 2030 |
Base year |
2023 |
Historical data |
2018 - 2022 |
Forecast period |
2024 - 2030 |
Report updated |
June 2024 |
Quantitative units |
Volume in million units; revenue in USD million/billion, and CAGR from 2024 to 2030 |
Report coverage |
Volume Forecast, revenue forecast, competitive landscape, growth factors and trends |
Segments covered |
Material, type, application, and region |
Regional scope |
North America; Europe; Asia Pacific; Central & South America; Middle East & Africa |
Country Scope |
U.S.; Canada; Mexico; Germany; France; UK; Italy; Spain; Netherlands; China; India; Japan; South Korea; Vietnam; Singapore; Australia; Brazil Argentina; Chile; Saudi Arabia; South Africa; UAE |
Key companies profiled |
Henkel AG & Co.; KGa; S. C. Johnson & Son, Inc.; Procter & Gamble; Unilever; Colep Consumer Products; Akzo Nobel N.V.; Beiersdorf AG; Estée Lauder Inc; Oriflame Cosmetics S.A.; Honeywell International Inc; and Reckitt Benckiser |
Customization scope |
Free report customization (equivalent up to 8 analyst’s working days) with purchase. Addition or alteration to country, regional & segment scope |
Pricing and purchase options |
Avail customized purchase options to meet your exact research needs. Explore purchase options |
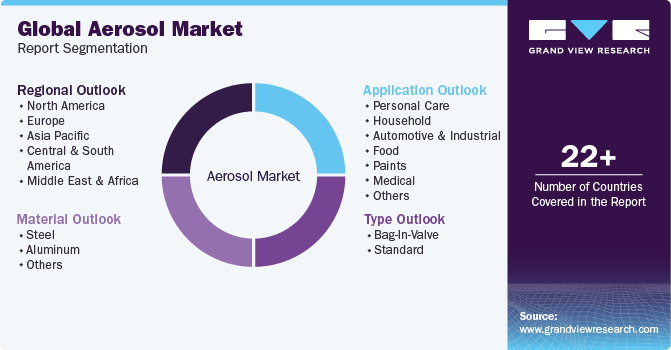
This report forecasts volume & revenue growth at global, regional, and country levels and provides an analysis of the latest industry trends in each of the sub-segments from 2018 to 2030. For this study, Grand View Research has segmented the global aerosol market report based on material, type, application, and region:
Material Outlook (Volume, Million Units; Revenue, USD Million, 2018 - 2030)
Steel
Aluminum
Others
Type Outlook (Volume, Million Units; Revenue, USD Million, 2018 - 2030)
Bag-in-valve
Standard
Application Outlook (Volume, Million Units; Revenue, USD Million, 2018 - 2030)
Personal Care
Deodorants
Hair Mousse
Hair Spray
Shaving Mousse/Foam
Suncare
Others
Household
Insecticides
Plant Protection
Air Fresheners
Furniture & Wax Polishes
Disinfectants
Surface care
Others
Automotive & Industrial
Greases
Lubricants
Spray Oils
Cleaners
Food
Oils
Whipped Cream
Edible Mousse
Sprayable Flavours
Paints
Industrial
Consumer
Medical
Inhaler
Topical Application
Others
Regional Outlook (Volume, Million Units; Revenue, USD Million, 2018 - 2030)
North America
U.S.
Canada
Mexico
Europe
Germany
UK
France
Italy
Spain
Netherlands
Asia Pacific
China
India
Japan
South Korea
Vietnam
Singapore
Australia
Central & South America
Brazil
Argentina
Chile
Middle East & Africa
Saudi Arabia
UAE
South Africa
b. The global aerosol market was estimated at USD 83.29 billion in the year 2023 and is expected to reach USD 88.54 billion in 2024.
b. The global aerosol market is expected to grow at a compound annual growth rate of 6.9% from 2024 to 2030, reaching USD 131.93 billion by 2030.
b. The European region dominated the market and accounted for more than 36.1% of revenue in 2023. The factors attributed to driving the European market are the presence of global players in the cosmetic and pharmaceutical industries in Europe and the high per capita consumption of cosmetic products.
b. The key market player in the aerosol market includes Henkel AG & Co., KGaA; S. C. Johnson & Son, Inc.; Procter & Gamble; Unilever; Honeywell International Inc.; Akzo Nobel N.V.; Beiersdorf AG; Estée Lauder Inc.; Oriflame Cosmetics Global SA.
b. Global aerosol market is anticipated to be driven by the growing demand for various products including deodorants, hair sprays, hair mousse, dry shampoos, insecticides, air fresheners, cleaning, lubricants, and medical spray. Increasing disposable income and changing consumer lifestyles are key factors attributing to the growing demand of aerosol products.
Table of Contents
Chapter 1. Methodology and Scope
1.1. Market Segmentation & Scope
1.2. Market Definition
1.3. Information Procurement
1.3.1. Purchased Database
1.3.2. GVR’s Internal Database
1.3.3. Secondary Materials & Third-Party Perspectives
1.3.4. Primary Research
1.4. Information Analysis
1.4.1. Data Analysis Models
1.5. Market Formulation & Data Visualization
1.6. Data Validation & Publishing
1.7. List of Abbreviations
Chapter 2. Executive Summary
2.1. Market Outlook, 2023 (USD Million)
2.2. Segmental Outlook
2.3. Competitive Landscape Snapshot
Chapter 3. Aerosol Market Variables, Trends, and Scope
3.1. Market Lineage Outlook
3.1.1. Parent Market Outlook
3.1.2. Ancillary Market Outlook
3.2. Industry Value Chain Analysis
3.2.1. Raw Material Trends
3.2.2. Manufacturing Trends
3.2.3. Profit Margin Analysis
3.2.4. Sales Channel Analysis
3.3. Technology Trends / Timeline
3.4. Regulatory Framework
3.4.1. Standard & Compliance
3.4.2. Safety
3.5. Market Dynamics
3.5.1. Market Driver Analysis
3.5.2. Market Restraint Analysis
3.5.3. Market Challenges Analysis
3.5.4. Market Opportunity Analysis
3.6. Business Environment Analysis
3.6.1. Industry Analysis - Porter’s
3.6.1.1. Supplier Power
3.6.1.2. Buyer Power
3.6.1.3. Substitution Threat
3.6.1.4. Threat from New Entrant
3.6.1.5. Competitive Rivalry
3.6.2. PESTEL Analysis
3.6.2.1. Political Landscape
3.6.2.2. Environmental Landscape
3.6.2.3. Social Landscape
3.6.2.4. Technology Landscape
3.6.2.5. Economic Landscape
3.6.2.6. Legal Landscape
3.6.3. Market Entry Strategies
3.7. Impact of Environmental, Social, and Governance (ESG) initiatives on the Aerosol Market
Chapter 4. Aerosol Market: Market Supplier Intelligence
4.1. Kraljic Matrix (Portfolio Analysis)
4.1.1. Non-Critical Items
4.1.2. Leverage Items
4.1.3. Bottleneck Items
4.1.4. Strategic Items
4.2. Engagement Model
4.3. Negotiation Strategies
4.4. Sourcing Best Practices
4.5. Vendor Selection Criteria
Chapter 5. Aerosol Market: Price Trend Analysis
5.1. Pricing Trend Analysis, by Material, 2018 - 2030 (USD/Unit)
5.2. Factors Affecting the Pricing Deviation
Chapter 6. Aerosol Market: Supply Demand Gap Analysis
6.1. Import Export Analysis, 2018 - 2022
6.1.1. Top 10 Importing Countries
6.1.2. Top 10 Exporting Countries
6.2. Potential Opportunities/ Future Scenarios
Chapter 7. Aerosol Market: Material Estimates & Trend Analysis
7.1. Definition & Scope
7.2. Material Movement Analysis & Market Share, 2023 & 2030
7.3. Steel
7.3.1. market estimates and forecasts, 2018 - 2030 (USD Million) (Million Units)
7.4. Aluminum
7.4.1. market estimates and forecasts, 2018 - 2030 (USD Million) (Million Units)
7.5. Others
7.5.1. market estimates and forecasts, 2018 - 2030 (USD Million) (Million Units)
Chapter 8. Aerosol Market: Type Estimates & Trend Analysis
8.1. Definition & Scope
8.2. Type Movement Analysis & Market Share, 2023 & 2030
8.3. Bagi-in Valve
8.3.1. market estimates and forecasts, 2018 - 2030 (USD Million) (Million Units)
8.4. Standard
8.4.1. market estimates and forecasts, 2018 - 2030 (USD Million) (Million Units)
Chapter 9. Aerosol Market: Application Estimates & Trend Analysis
9.1. Definition & Scope
9.2. Application Movement Analysis & Market Share, 2023 & 2030
9.3. Personal Care
9.3.1. market estimates and forecasts, 2018 - 2030 (USD Million) (Million Units)
9.3.2. Deodorants
9.3.2.1. market estimates and forecasts, 2018 - 2030 (USD Million) (Million Units)
9.3.3. Hair Mousse
9.3.3.1. market estimates and forecasts, 2018 - 2030 (USD Million) (Million Units)
9.3.4. Hair Spray
9.3.4.1. market estimates and forecasts, 2018 - 2030 (USD Million) (Million Units)
9.3.5. Shaving Mousse/Foam
9.3.5.1. market estimates and forecasts, 2018 - 2030 (USD Million) (Million Units)
9.3.6. Suncare
9.3.6.1. market estimates and forecasts, 2018 - 2030 (USD Million) (Million Units)
9.3.7. Others
9.3.7.1. market estimates and forecasts, 2018 - 2030 (USD Million) (Million Units)
9.4. Household
9.4.1. market estimates and forecasts, 2018 - 2030 (USD Million) (Million Units)
9.4.2. Insecticides
9.4.2.1. market estimates and forecasts, 2018 - 2030 (USD Million) (Million Units)
9.4.3. Plant Protection
9.4.3.1. market estimates and forecasts, 2018 - 2030 (USD Million) (Million Units)
9.4.4. Air Fresheners
9.4.4.1. market estimates and forecasts, 2018 - 2030 (USD Million) (Million Units)
9.4.5. Furniture & Wax Polishes
9.4.5.1. market estimates and forecasts, 2018 - 2030 (USD Million) (Million Units)
9.4.6. Disinfectants
9.4.6.1. market estimates and forecasts, 2018 - 2030 (USD Million) (Million Units)
9.4.7. Surface care
9.4.7.1. market estimates and forecasts, 2018 - 2030 (USD Million) (Million Units)
9.4.8. Others
9.4.8.1. market estimates and forecasts, 2018 - 2030 (USD Million) (Million Units)
9.5. Automotive & Industrial
9.5.1. market estimates and forecasts, 2018 - 2030 (USD Million) (Million Units)
9.5.2. Greases
9.5.2.1. market estimates and forecasts, 2018 - 2030 (USD Million) (Million Units)
9.5.3. Lubricants
9.5.3.1. market estimates and forecasts, 2018 - 2030 (USD Million) (Million Units)
9.5.4. Spray Oils
9.5.4.1. market estimates and forecasts, 2018 - 2030 (USD Million) (Million Units)
9.5.5. Cleaners
9.5.5.1. market estimates and forecasts, 2018 - 2030 (USD Million) (Million Units)
9.6. Food
9.6.1. market estimates and forecasts, 2018 - 2030 (USD Million) (Million Units)
9.6.2. Oils
9.6.2.1. market estimates and forecasts, 2018 - 2030 (USD Million) (Million Units)
9.6.3. Whipped Cream
9.6.3.1. market estimates and forecasts, 2018 - 2030 (USD Million) (Million Units)
9.6.4. Edible Mousse
9.6.4.1. market estimates and forecasts, 2018 - 2030 (USD Million) (Million Units)
9.6.5. Sprayable Flavors
9.6.5.1. market estimates and forecasts, 2018 - 2030 (USD Million) (Million Units)
9.7. Paints
9.7.1. market estimates and forecasts, 2018 - 2030 (USD Million) (Million Units)
9.7.2. Industrial
9.7.2.1. market estimates and forecasts, 2018 - 2030 (USD Million) (Million Units)
9.7.3. Consumer
9.7.3.1. market estimates and forecasts, 2018 - 2030 (USD Million) (Million Units)
9.8. Medical
9.8.1. market estimates and forecasts, 2018 - 2030 (USD Million) (Million Units)
9.8.2. Inhaler
9.8.2.1. market estimates and forecasts, 2018 - 2030 (USD Million) (Million Units)
9.8.3. Topical Application
9.8.3.1. market estimates and forecasts, 2018 - 2030 (USD Million) (Million Units)
9.9. Others
9.9.1. market estimates and forecasts, 2018 - 2030 (USD Million) (Million Units)
Chapter 10. Aerosol Market: Regional Estimates & Trend Analysis
10.1. Key Takeaways
10.2. Regional Movement Analysis & Market Share, 2023 & 2030
10.3. North America
10.3.1. market estimates and forecasts, 2018 - 2030 (USD Million) (Million Units)
10.3.2. market estimates and forecasts, by material, 2018 - 2030 (Million Units) (USD Million)
10.3.3. market estimates and forecasts, by type, 2018 - 2030 (Million Units) (USD Million)
10.3.4. market estimates and forecasts, by application, 2018 - 2030 (Million Units) (USD Million)
10.3.5. U.S.
10.3.5.1. market estimates and forecasts, 2018 - 2030 (USD Million) (Million Units)
10.3.5.2. market estimates and forecasts, by material, 2018 - 2030 (Million Units) (USD Million)
10.3.5.3. market estimates and forecasts, by type, 2018 - 2030 (Million Units) (USD Million)
10.3.5.4. market estimates and forecasts, by application, 2018 - 2030 (Million Units) (USD Million)
10.3.6. Canada
10.3.6.1. market estimates and forecasts, 2018 - 2030 (USD Million) (Million Units)
10.3.6.2. market estimates and forecasts, by material, 2018 - 2030 (Million Units) (USD Million)
10.3.6.3. market estimates and forecasts, by type, 2018 - 2030 (Million Units) (USD Million)
10.3.6.4. market estimates and forecasts, by application, 2018 - 2030 (Million Units) (USD Million)
10.3.7. Mexico
10.3.7.1. market estimates and forecasts, 2018 - 2030 (USD Million) (Million Units)
10.3.7.2. market estimates and forecasts, by material, 2018 - 2030 (Million Units) (USD Million)
10.3.7.3. market estimates and forecasts, by type, 2018 - 2030 (Million Units) (USD Million)
10.3.7.4. market estimates and forecasts, by application, 2018 - 2030 (Million Units) (USD Million)
10.4. Europe
10.4.1. market estimates and forecasts, 2018 - 2030 (USD Million) (Million Units)
10.4.2. market estimates and forecasts, by material, 2018 - 2030 (Million Units) (USD Million)
10.4.3. market estimates and forecasts, by type, 2018 - 2030 (Million Units) (USD Million)
10.4.4. market estimates and forecasts, by application, 2018 - 2030 (Million Units) (USD Million)
10.4.5. Germany
10.4.5.1. market estimates and forecasts, 2018 - 2030 (USD Million) (Million Units)
10.4.5.2. market estimates and forecasts, by material, 2018 - 2030 (Million Units) (USD Million)
10.4.5.3. market estimates and forecasts, by type, 2018 - 2030 (Million Units) (USD Million)
10.4.5.4. market estimates and forecasts, by application, 2018 - 2030 (Million Units) (USD Million)
10.4.6. U.K.
10.4.6.1. market estimates and forecasts, 2018 - 2030 (USD Million) (Million Units)
10.4.6.2. market estimates and forecasts, by material, 2018 - 2030 (Million Units) (USD Million)
10.4.6.3. market estimates and forecasts, by type, 2018 - 2030 (Million Units) (USD Million)
10.4.6.4. market estimates and forecasts, by application, 2018 - 2030 (Million Units) (USD Million)
10.4.7. France
10.4.7.1. market estimates and forecasts, 2018 - 2030 (USD Million) (Million Units)
10.4.7.2. market estimates and forecasts, by material, 2018 - 2030 (Million Units) (USD Million)
10.4.7.3. market estimates and forecasts, by type, 2018 - 2030 (Million Units) (USD Million)
10.4.7.4. market estimates and forecasts, by application, 2018 - 2030 (Million Units) (USD Million)
10.4.8. Italy
10.4.8.1. market estimates and forecasts, 2018 - 2030 (USD Million) (Million Units)
10.4.8.2. market estimates and forecasts, by material, 2018 - 2030 (Million Units) (USD Million)
10.4.8.3. market estimates and forecasts, by type, 2018 - 2030 (Million Units) (USD Million)
10.4.8.4. market estimates and forecasts, by application, 2018 - 2030 (Million Units) (USD Million)
10.4.9. Spain
10.4.9.1. market estimates and forecasts, 2018 - 2030 (USD Million) (Million Units)
10.4.9.2. market estimates and forecasts, by material, 2018 - 2030 (Million Units) (USD Million)
10.4.9.3. market estimates and forecasts, by type, 2018 - 2030 (Million Units) (USD Million)
10.4.9.4. market estimates and forecasts, by application, 2018 - 2030 (Million Units) (USD Million)
10.4.10. Netherlands
10.4.10.1. market estimates and forecasts, 2018 - 2030 (USD Million) (Million Units)
10.4.10.2. market estimates and forecasts, by material, 2018 - 2030 (Million Units) (USD Million)
10.4.10.3. market estimates and forecasts, by type, 2018 - 2030 (Million Units) (USD Million)
10.4.10.4. market estimates and forecasts, by application, 2018 - 2030 (Million Units) (USD Million)
10.5. Asia Pacific
10.5.1. market estimates and forecasts, 2018 - 2030 (USD Million) (Million Units)
10.5.2. market estimates and forecasts, by material, 2018 - 2030 (Million Units) (USD Million)
10.5.3. market estimates and forecasts, by type, 2018 - 2030 (Million Units) (USD Million)
10.5.4. market estimates and forecasts, by application, 2018 - 2030 (Million Units) (USD Million)
10.5.5. China
10.5.5.1. market estimates and forecasts, 2018 - 2030 (USD Million) (Million Units)
10.5.5.2. market estimates and forecasts, by material, 2018 - 2030 (Million Units) (USD Million)
10.5.5.3. market estimates and forecasts, by type, 2018 - 2030 (Million Units) (USD Million)
10.5.5.4. market estimates and forecasts, by application, 2018 - 2030 (Million Units) (USD Million)
10.5.6. India
10.5.6.1. market estimates and forecasts, 2018 - 2030 (USD Million) (Million Units)
10.5.6.2. market estimates and forecasts, by material, 2018 - 2030 (Million Units) (USD Million)
10.5.6.3. market estimates and forecasts, by type, 2018 - 2030 (Million Units) (USD Million)
10.5.6.4. market estimates and forecasts, by application, 2018 - 2030 (Million Units) (USD Million)
10.5.7. Japan
10.5.7.1. market estimates and forecasts, 2018 - 2030 (USD Million) (Million Units)
10.5.7.2. market estimates and forecasts, by material, 2018 - 2030 (Million Units) (USD Million)
10.5.7.3. market estimates and forecasts, by type, 2018 - 2030 (Million Units) (USD Million)
10.5.7.4. market estimates and forecasts, by application, 2018 - 2030 (Million Units) (USD Million)
10.5.8. South Korea
10.5.8.1. market estimates and forecasts, 2018 - 2030 (USD Million) (Million Units)
10.5.8.2. market estimates and forecasts, by material, 2018 - 2030 (Million Units) (USD Million)
10.5.8.3. market estimates and forecasts, by type, 2018 - 2030 (Million Units) (USD Million)
10.5.8.4. market estimates and forecasts, by application, 2018 - 2030 (Million Units) (USD Million)
10.5.9. Australia
10.5.9.1. market estimates and forecasts, 2018 - 2030 (USD Million) (Million Units)
10.5.9.2. market estimates and forecasts, by material, 2018 - 2030 (Million Units) (USD Million)
10.5.9.3. market estimates and forecasts, by type, 2018 - 2030 (Million Units) (USD Million)
10.5.9.4. market estimates and forecasts, by application, 2018 - 2030 (Million Units) (USD Million)
10.5.10. Singapore
10.5.10.1. market estimates and forecasts, 2018 - 2030 (USD Million) (Million Units)
10.5.10.2. market estimates and forecasts, by material, 2018 - 2030 (Million Units) (USD Million)
10.5.10.3. market estimates and forecasts, by type, 2018 - 2030 (Million Units) (USD Million)
10.5.10.4. market estimates and forecasts, by application, 2018 - 2030 (Million Units) (USD Million)
10.5.11. Vietnam
10.5.11.1. market estimates and forecasts, 2018 - 2030 (USD Million) (Million Units)
10.5.11.2. market estimates and forecasts, by material, 2018 - 2030 (Million Units) (USD Million)
10.5.11.3. market estimates and forecasts, by type, 2018 - 2030 (Million Units) (USD Million)
10.5.11.4. market estimates and forecasts, by application, 2018 - 2030 (Million Units) (USD Million)
10.6. Central & South America
10.6.1. market estimates and forecasts, 2018 - 2030 (USD Million) (Million Units)
10.6.2. market estimates and forecasts, by material, 2018 - 2030 (Million Units) (USD Million)
10.6.3. market estimates and forecasts, by type, 2018 - 2030 (Million Units) (USD Million)
10.6.4. market estimates and forecasts, by application, 2018 - 2030 (Million Units) (USD Million)
10.6.5. Brazil
10.6.5.1. market estimates and forecasts, 2018 - 2030 (USD Million) (Million Units)
10.6.5.2. market estimates and forecasts, by material, 2018 - 2030 (Million Units) (USD Million)
10.6.5.3. market estimates and forecasts, by type, 2018 - 2030 (Million Units) (USD Million)
10.6.5.4. market estimates and forecasts, by application, 2018 - 2030 (Million Units) (USD Million)
10.6.6. Argentina
10.6.6.1. market estimates and forecasts, 2018 - 2030 (USD Million) (Million Units)
10.6.6.2. market estimates and forecasts, by material, 2018 - 2030 (Million Units) (USD Million)
10.6.6.3. market estimates and forecasts, by type, 2018 - 2030 (Million Units) (USD Million)
10.6.6.4. market estimates and forecasts, by application, 2018 - 2030 (Million Units) (USD Million)
10.6.7. Chile
10.6.7.1. market estimates and forecasts, 2018 - 2030 (USD Million) (Million Units)
10.6.7.2. market estimates and forecasts, by material, 2018 - 2030 (Million Units) (USD Million)
10.6.7.3. market estimates and forecasts, by type, 2018 - 2030 (Million Units) (USD Million)
10.6.7.4. market estimates and forecasts, by application, 2018 - 2030 (Million Units) (USD Million)
10.7. Middle East & Africa
10.7.1. market estimates and forecasts, 2018 - 2030 (USD Million) (Million Units)
10.7.2. market estimates and forecasts, by material, 2018 - 2030 (Million Units) (USD Million)
10.7.3. market estimates and forecasts, by type, 2018 - 2030 (Million Units) (USD Million)
10.7.4. market estimates and forecasts, by application, 2018 - 2030 (Million Units) (USD Million)
10.7.5. Saudi Arabia
10.7.5.1. market estimates and forecasts, 2018 - 2030 (USD Million) (Million Units)
10.7.5.2. market estimates and forecasts, by material, 2018 - 2030 (Million Units) (USD Million)
10.7.5.3. market estimates and forecasts, by type, 2018 - 2030 (Million Units) (USD Million)
10.7.5.4. market estimates and forecasts, by application, 2018 - 2030 (Million Units) (USD Million)
10.7.6. UAE
10.7.6.1. market estimates and forecasts, 2018 - 2030 (USD Million) (Million Units)
10.7.6.2. market estimates and forecasts, by material, 2018 - 2030 (Million Units) (USD Million)
10.7.6.3. market estimates and forecasts, by type, 2018 - 2030 (Million Units) (USD Million)
10.7.6.4. market estimates and forecasts, by application, 2018 - 2030 (Million Units) (USD Million)
10.7.7. South Africa
10.7.7.1. market estimates and forecasts, 2018 - 2030 (USD Million) (Million Units)
10.7.7.2. market estimates and forecasts, by material, 2018 - 2030 (Million Units) (USD Million)
10.7.7.3. market estimates and forecasts, by type, 2018 - 2030 (Million Units) (USD Million)
10.7.7.4. market estimates and forecasts, by application, 2018 - 2030 (Million Units) (USD Million)
Chapter 11. Start-up Ecosystem Evaluation, 2023
11.1. List of Start-up Companies
11.1.1. Progressive Companies
11.1.2. Responsive Companies
11.1.3. Dynamic Companies
11.1.4. Starting Blocks
Chapter 12. Competitive Landscape
12.1. Key Global Players & Recent Developments & Their Impact On the Industry
12.2. Key Company/Competition Categorization (Key innovators, Market leaders, emerging players)
12.3. List of key Raw Material Distributors and Channel Partners
12.4. Company Market Share & Position Analysis, 2023
12.5. Company Heat Map Analysis
12.6. Competitive Dashboard Analysis
12.7. Strategy Mapping
12.7.1. Expansion
12.7.2. Collaboration/ Partnerships/ Agreements
12.7.3. New Material launches
12.7.4. Mergers & Acquisitions
12.7.5. Research & Development
12.7.6. Others
12.8. List of Potential Customers, by Application
Chapter 13. Company Listing / Profiles
13.1. Henkel AG & Co., KGaA
13.1.1. Company Overview
13.1.2. Financial Performance
13.1.3. Material Benchmarking
13.1.4. Recent Developments
13.2. S. C. Johnson & Son, Inc.
13.2.1. Company Overview
13.2.2. Financial Performance
13.2.3. Material Benchmarking
13.2.4. Recent Developments
13.3. Procter & Gamble
13.3.1. Company Overview
13.3.2. Financial Performance
13.3.3. Material Benchmarking
13.3.4. Recent Developments
13.4. Unilever
13.4.1. Company Overview
13.4.2. Financial Performance
13.4.3. Material Benchmarking
13.4.4. Recent Developments
13.5. Colep Consumer Products
13.5.1. Company Overview
13.5.2. Financial Performance
13.5.3. Material Benchmarking
13.5.4. Recent Developments
13.6. Akzo Nobel N.V.
13.6.1. Company Overview
13.6.2. Financial Performance
13.6.3. Material Benchmarking
13.6.4. Recent Developments
13.7. Beiersdorf AG
13.7.1. Company Overview
13.7.2. Financial Performance
13.7.3. Material Benchmarking
13.7.4. Recent Developments
13.8. Estée Lauder Inc
13.8.1. Company Overview
13.8.2. Financial Performance
13.8.3. Material Benchmarking
13.8.4. Recent Developments
13.9. Oriflame Cosmetics S.A.
13.9.1. Company Overview
13.9.2. Financial Performance
13.9.3. Material Benchmarking
13.9.4. Recent Developments
13.10. Honeywell International Inc
13.10.1. Company Overview
13.10.2. Financial Performance
13.10.3. Material Benchmarking
13.10.4. Recent Developments
13.11. Reckitt Benckiser
13.11.1. Company Overview
13.11.2. Financial Performance
13.11.3. Material Benchmarking
13.11.4. Recent Developments
Chapter 14. Strategic Recommendations/ Analyst Perspective
List of Tables
Table 1 Aerosol Market estimates and forecasts, 2018 - 2030 (USD Million) (Million Units)
Table 2 Steel Aerosol Market estimates and forecasts, 2018 - 2030 (Million Units) (USD Million)
Table 3 Aluminum Aerosol Market estimates and forecasts, 2018 - 2030 (Million Units) (USD Million)
Table 4 Others Aerosol Market estimates and forecasts, 2018 - 2030 (Million Units) (USD Million)
Table 5 Bag-in Valve Aerosol Market estimates and forecasts, 2018 - 2030 (Million Units) (USD Million)
Table 6 Standard Aerosol Market estimates and forecasts, 2018 - 2030 (Million Units) (USD Million)
Table 7 Aerosol Market estimates and forecasts, in personal care, 2018 - 2030 (Million Units) (USD Million)
Table 8 Aerosol Market estimates and forecasts, in household, 2018 - 2030 (Million Units) (USD Million)
Table 9 Aerosol Market estimates and forecasts, in automotive & industrial, 2018 - 2030 (Million Units) (USD Million)
Table 10 Aerosol Market estimates and forecasts, in food, 2018 - 2030 (Million Units) (USD Million)
Table 11 Aerosol Market estimates and forecasts, in paints, 2018 - 2030 (Million Units) (USD Million)
Table 12 Aerosol Market estimates and forecasts, in medical, 2018 - 2030 (Million Units) (USD Million)
Table 13 Aerosol Market estimates and forecasts, in others, 2018 - 2030 (Million Units) (USD Million)
Table 14 North America Aerosol Market estimates and forecasts, 2018 - 2030 (Million Units) (USD Million)
Table 15 North America Aerosol Market estimates and forecasts, by material, 2018 - 2030 (Million Units) (USD Million)
Table 16 North America Aerosol Market estimates and forecasts, by type, 2018 - 2030 (Million Units) (USD Million)
Table 17 North America Aerosol Market estimates and forecasts, by application, 2018 - 2030 (Million Units) (USD Million)
Table 18 U.S. Aerosol Market estimates and forecasts, 2018 - 2030 (Million Units) (USD Million)
Table 19 U.S. Aerosol Market estimates and forecasts, by material, 2018 - 2030 (Million Units) (USD Million)
Table 20 U.S. Aerosol Market estimates and forecasts, by type, 2018 - 2030 (Million Units) (USD Million)
Table 21 U.S. Aerosol Market estimates and forecasts, by application, 2018 - 2030 (Million Units) (USD Million)
Table 22 Canada Aerosol Market estimates and forecasts, 2018 - 2030 (Million Units) (USD Million)
Table 23 Canada Aerosol Market estimates and forecasts, by material, 2018 - 2030 (Million Units) (USD Million)
Table 24 Canada Aerosol Market estimates and forecasts, by type, 2018 - 2030 (Million Units) (USD Million)
Table 25 Canada Aerosol Market estimates and forecasts, by application, 2018 - 2030 (Million Units) (USD Million)
Table 26 Mexico Aerosol Market estimates and forecasts, 2018 - 2030 (Million Units) (USD Million)
Table 27 Mexico Aerosol Market estimates and forecasts, by material, 2018 - 2030 (Million Units) (USD Million)
Table 28 Mexico Aerosol Market estimates and forecasts, by type, 2018 - 2030 (Million Units) (USD Million)
Table 29 Mexico Aerosol Market estimates and forecasts, by application, 2018 - 2030 (Million Units) (USD Million)
Table 30 Europe Aerosol Market estimates and forecasts, 2018 - 2030 (Million Units) (USD Million)
Table 31 Europe Aerosol Market estimates and forecasts, by material, 2018 - 2030 (Million Units) (USD Million)
Table 32 Europe Aerosol Market estimates and forecasts, by type, 2018 - 2030 (Million Units) (USD Million)
Table 33 Europe Aerosol Market estimates and forecasts, by application, 2018 - 2030 (Million Units) (USD Million)
Table 34 Germany Aerosol Market estimates and forecasts, 2018 - 2030 (Million Units) (USD Million)
Table 35 Germany Aerosol Market estimates and forecasts, by material, 2018 - 2030 (Million Units) (USD Million)
Table 36 Germany Aerosol Market estimates and forecasts, by type, 2018 - 2030 (Million Units) (USD Million)
Table 37 Germany Aerosol Market estimates and forecasts, by application, 2018 - 2030 (Million Units) (USD Million)
Table 38 UK Aerosol Market estimates and forecasts, 2018 - 2030 (Million Units) (USD Million)
Table 39 UK Aerosol Market estimates and forecasts, by material, 2018 - 2030 (Million Units) (USD Million)
Table 40 UK Aerosol Market estimates and forecasts, by type, 2018 - 2030 (Million Units) (USD Million)
Table 41 UK Aerosol Market estimates and forecasts, by application, 2018 - 2030 (Million Units) (USD Million)
Table 42 France Aerosol Market estimates and forecasts, 2018 - 2030 (Million Units) (USD Million)
Table 43 France Aerosol Market estimates and forecasts, by material, 2018 - 2030 (Million Units) (USD Million)
Table 44 France Aerosol Market estimates and forecasts, by type, 2018 - 2030 (Million Units) (USD Million)
Table 45 France Aerosol Market estimates and forecasts, by application, 2018 - 2030 (Million Units) (USD Million)
Table 46 Italy Aerosol Market estimates and forecasts, 2018 - 2030 (Million Units) (USD Million)
Table 47 Italy Aerosol Market estimates and forecasts, by material, 2018 - 2030 (Million Units) (USD Million)
Table 48 Italy Aerosol Market estimates and forecasts, by type, 2018 - 2030 (Million Units) (USD Million)
Table 49 Italy Aerosol Market estimates and forecasts, by application, 2018 - 2030 (Million Units) (USD Million)
Table 50 Spain Aerosol Market estimates and forecasts, 2018 - 2030 (Million Units) (USD Million)
Table 51 Spain Aerosol Market estimates and forecasts, by material, 2018 - 2030 (Million Units) (USD Million)
Table 52 Spain Aerosol Market estimates and forecasts, by type, 2018 - 2030 (Million Units) (USD Million)
Table 53 Spain Aerosol Market estimates and forecasts, by application, 2018 - 2030 (Million Units) (USD Million)
Table 54 Netherlands Aerosol Market estimates and forecasts, 2018 - 2030 (Million Units) (USD Million)
Table 55 Netherlands Aerosol Market estimates and forecasts, by material, 2018 - 2030 (Million Units) (USD Million)
Table 56 Netherlands Aerosol Market estimates and forecasts, by type, 2018 - 2030 (Million Units) (USD Million)
Table 57 Netherlands Aerosol Market estimates and forecasts, by application, 2018 - 2030 (Million Units) (USD Million)
Table 58 Asia Pacific Aerosol Market estimates and forecasts, 2018 - 2030 (Million Units) (USD Million)
Table 59 Asia Pacific Aerosol Market estimates and forecasts, by material, 2018 - 2030 (Million Units) (USD Million)
Table 60 Asia Pacific Aerosol Market estimates and forecasts, by type, 2018 - 2030 (Million Units) (USD Million)
Table 61 Asia Pacific Aerosol Market estimates and forecasts, by application, 2018 - 2030 (Million Units) (USD Million)
Table 62 China Aerosol Market estimates and forecasts, 2018 - 2030 (Million Units) (USD Million)
Table 63 China Aerosol Market estimates and forecasts, by material, 2018 - 2030 (Million Units) (USD Million)
Table 64 China Aerosol Market estimates and forecasts, by type, 2018 - 2030 (Million Units) (USD Million)
Table 65 China Aerosol Market estimates and forecasts, by application, 2018 - 2030 (Million Units) (USD Million)
Table 66 Japan Aerosol Market estimates and forecasts, 2018 - 2030 (Million Units) (USD Million)
Table 67 Japan Aerosol Market estimates and forecasts, by material, 2018 - 2030 (Million Units) (USD Million)
Table 68 Japan Aerosol Market estimates and forecasts, by type, 2018 - 2030 (Million Units) (USD Million)
Table 69 Japan Aerosol Market estimates and forecasts, by application, 2018 - 2030 (Million Units) (USD Million)
Table 70 India Aerosol Market estimates and forecasts, 2018 - 2030 (Million Units) (USD Million)
Table 71 India Aerosol Market estimates and forecasts, by material, 2018 - 2030 (Million Units) (USD Million)
Table 72 India Aerosol Market estimates and forecasts, by type, 2018 - 2030 (Million Units) (USD Million)
Table 73 India Aerosol Market estimates and forecasts, by application, 2018 - 2030 (Million Units) (USD Million)
Table 74 South Korea Aerosol Market estimates and forecasts, 2018 - 2030 (Million Units) (USD Million)
Table 75 South Korea Aerosol Market estimates and forecasts, by material, 2018 - 2030 (Million Units) (USD Million)
Table 76 South Korea Aerosol Market estimates and forecasts, by type, 2018 - 2030 (Million Units) (USD Million)
Table 77 South Korea Aerosol Market estimates and forecasts, by application, 2018 - 2030 (Million Units) (USD Million)
Table 78 Australia Aerosol Market estimates and forecasts, 2018 - 2030 (Million Units) (USD Million)
Table 79 Australia Aerosol Market estimates and forecasts, by material, 2018 - 2030 (Million Units) (USD Million)
Table 80 Australia Aerosol Market estimates and forecasts, by Type, 2018 - 2030 (Million Units) (USD Million)
Table 81 Australia Aerosol Market estimates and forecasts, by application, 2018 - 2030 (Million Units) (USD Million)
Table 82 Singapore Aerosol Market estimates and forecasts, 2018 - 2030 (Million Units) (USD Million)
Table 83 Singapore Aerosol Market estimates and forecasts, by material, 2018 - 2030 (Million Units) (USD Million)
Table 84 Singapore Aerosol Market estimates and forecasts, by type, 2018 - 2030 (Million Units) (USD Million)
Table 85 Singapore Aerosol Market estimates and forecasts, by application, 2018 - 2030 (Million Units) (USD Million)
Table 86 Vietnam Aerosol Market estimates and forecasts, 2018 - 2030 (Million Units) (USD Million)
Table 87 Vietnam Aerosol Market estimates and forecasts, by material, 2018 - 2030 (Million Units) (USD Million)
Table 88 Vietnam Aerosol Market estimates and forecasts, by type, 2018 - 2030 (Million Units) (USD Million)
Table 89 Vietnam Aerosol Market estimates and forecasts, by application, 2018 - 2030 (Million Units) (USD Million)
Table 90 Central & South America Aerosol Market estimates and forecasts, 2018 - 2030 (Million Units) (USD Million)
Table 91 Central & South America Aerosol Market estimates and forecasts, by material, 2018 - 2030 (Million Units) (USD Million)
Table 92 Central & South America Aerosol Market estimates and forecasts, by type, 2018 - 2030 (Million Units) (USD Million)
Table 93 Central & South America Aerosol Market estimates and forecasts, by application, 2018 - 2030 (Million Units) (USD Million)
Table 94 Brazil Aerosol Market estimates and forecasts, 2018 - 2030 (Million Units) (USD Million)
Table 95 Brazil Aerosol Market estimates and forecasts, by material, 2018 - 2030 (Million Units) (USD Million)
Table 96 Brazil Aerosol Market estimates and forecasts, by type, 2018 - 2030 (Million Units) (USD Million)
Table 97 Brazil Aerosol Market estimates and forecasts, by application, 2018 - 2030 (Million Units) (USD Million)
Table 98 Argentina Aerosol Market estimates and forecasts, 2018 - 2030 (Million Units) (USD Million)
Table 99 Argentina Aerosol Market estimates and forecasts, by material, 2018 - 2030 (Million Units) (USD Million)
Table 100 Argentina Aerosol Market estimates and forecasts, by type, 2018 - 2030 (Million Units) (USD Million)
Table 101 Argentina Aerosol Market estimates and forecasts, by application, 2018 - 2030 (Million Units) (USD Million)
Table 102 Chile Aerosol Market estimates and forecasts, 2018 - 2030 (Million Units) (USD Million)
Table 103 Chile Aerosol Market estimates and forecasts, by material, 2018 - 2030 (Million Units) (USD Million)
Table 104 Chile Aerosol Market estimates and forecasts, by type, 2018 - 2030 (Million Units) (USD Million)
Table 105 Chile Aerosol Market estimates and forecasts, by application, 2018 - 2030 (Million Units) (USD Million)
Table 106 Middle East & Africa Aerosol Market estimates and forecasts, 2018 - 2030 (Million Units) (USD Million)
Table 107 Middle East & Africa Aerosol Market estimates and forecasts, by material, 2018 - 2030 (Million Units) (USD Million)
Table 108 Middle East & Africa Aerosol Market estimates and forecasts, by type, 2018 - 2030 (Million Units) (USD Million)
Table 109 Middle East & Africa Aerosol Market estimates and forecasts, by application, 2018 - 2030 (Million Units) (USD Million)
Table 110 Saudi Arabia Aerosol Market estimates and forecasts, 2018 - 2030 (Million Units) (USD Million)
Table 111 Saudi Arabia Aerosol Market estimates and forecasts, by material, 2018 - 2030 (Million Units) (USD Million)
Table 112 Saudi Arabia Aerosol Market estimates and forecasts, by type, 2018 - 2030 (Million Units) (USD Million)
Table 113 Saudi Arabia Aerosol Market estimates and forecasts, by application, 2018 - 2030 (Million Units) (USD Million)
Table 114 UAE Aerosol Market estimates and forecasts, 2018 - 2030 (Million Units) (USD Million)
Table 115 UAE Aerosol Market estimates and forecasts, by material, 2018 - 2030 (Million Units) (USD Million)
Table 116 UAE Aerosol Market estimates and forecasts, by type, 2018 - 2030 (Million Units) (USD Million)
Table 117 UAE Aerosol Market estimates and forecasts, by application, 2018 - 2030 (Million Units) (USD Million)
Table 118 South Africa Aerosol Market estimates and forecasts, 2018 - 2030 (Million Units) (USD Million)
Table 119 South Africa Aerosol Market estimates and forecasts, by material, 2018 - 2030 (Million Units) (USD Million)
Table 120 South Africa Aerosol Market estimates and forecasts, by type, 2018 - 2030 (Million Units) (USD Million)
Table 121 South Africa Aerosol Market estimates and forecasts, by application, 2018 - 2030 (Million Units) (USD Million)
List of Figures
Fig. 1 Information procurement
Fig. 2 Primary research pattern
Fig. 3 Primary Research Process
Fig. 4 Market research approaches - Bottom-Up Approach
Fig. 5 Market research approaches - Top-Down Approach
Fig. 6 Market research approaches - Combined Approach
Fig. 7 Aerosol Market- Market Snapshot
Fig. 8 Aerosol Market- Segment Snapshot (1/2)
Fig. 9 Aerosol Market- Segment Snapshot (2/2)
Fig. 10 Aerosol Market- Competitive Landscape Snapshot
Fig. 11 Aerosol Market: Penetration & Growth Prospect Mapping
Fig. 12 Aerosol Market: Value Chain Analysis
Fig. 13 Aerosol Market: Porter’s Five Force Analysis
Fig. 14 Aerosol Market: PESTEL Analysis
Fig. 15 Aerosol market: Material movement analysis, 2023 & 2030
Fig. 16 Aerosol market: Type movement analysis, 2023 & 2030
Fig. 17 Aerosol market: Application movement analysis, 2023 & 2030
Fig. 18 Aerosol market: Regional movement analysis, 2023 & 2030
Fig. 19 Aerosol Market: Competitive Dashboard Analysis
Fig. 20 Aerosol Market: Market Share Analysis
Market Segmentation
With new product formats and gender-specific products being introduced in the market, the demand for personal care products is anticipated to rise further. With the rising demand in aerosol propellants in various products such as hair sprays, styling mousses, and deodorants & antiperspirants, it is anticipated that the demand for aerosol market will increase over the forecast period. In addition, the rising disposable income of consumers further increases the demand for cosmetics and personal care products. The Asia Pacific region is a prime example of this factor due to its expanding millennial population backed by robust disposable income. The Asia Pacific region will witness the highest growth in terms of revenue owing to high personal care product consumption. Owing to increasing use of aerosol in various foods including chocolate, vinegar, whipped cream, olive oil, the food segment is anticipated to help propel the market growth over the forecast period.
Owing to the ease in handling and application of aerosol forms, a higher percentage of pain relief medications are packaged in aerosol form such as asthma inhalers, various types of sprays for treating pain, insect bites, and itching problems. The rising prevalence of respiratory disorders such as asthma in low and middle-income nations along with 330 million registered cases worldwide in 2018, the demand for aerosol in inhalers is anticipated to increase over the forecast period, which in turn will fuel the market growth. The increasing geriatric population and rising rate of environmental pollution have boosted the demand for COPD devices. The increased demand of respiratory devices will further increase the importance of aerosol in MDI valves, DPI devices, and check valves in the near future, thus boosting the market growth. With the global sports activities increasing through the introduction of various new tournaments, the demand for medical aerosol products is anticipated to increase in the future.
Aerosol cans and their propellants require a safe disposal process, which presents a significant challenge for end-users. A safe disposal needs the aerosol cans to be completely empty with the entire propellant inside discharged completely. If half used aerosol cans along with the propellants inside are disposed of, these aerosol cans can prove to be a hazardous waste. Furthermore, large-sized companies can implement the required measures for adequate disposal of hazardous aerosol can waste. However, small-sized companies incur a significant cost for the same. Therefore, the safe disposal of aerosol cans and aerosol propellants can act as a deterrent to market growth.
This section will provide insights into the contents included in this aerosol market report and help gain clarity on the structure of the report to assist readers in navigating smoothly.
Industry overview
Industry trends
Market drivers and restraints
Market size
Growth prospects
Porter’s analysis
PESTEL analysis
Key market opportunities prioritized
Competitive landscape
Company overview
Financial performance
Product benchmarking
Latest strategic developments
Market size, estimates, and forecast from 2018 to 2030
Market estimates and forecast for product segments up to 2030
Regional market size and forecast for product segments up to 2030
Market estimates and forecast for application segments up to 2030
Regional market size and forecast for application segments up to 2030
Company financial performance
A three-pronged approach was followed for deducing the aerosol market estimates and forecasts. The process has three steps: information procurement, analysis, and validation. The whole process is cyclical, and steps repeat until the estimates are validated. The three steps are explained in detail below:
Information procurement: Information procurement is one of the most extensive and important stages in our research process, and quality data is critical for accurate analysis. We followed a multi-channel data collection process for aerosol market to gather the most reliable and current information possible.
Analysis: We mine the data collected to establish baselines for forecasting, identify trends and opportunities, gain insight into consumer demographics and drivers, and so much more. We utilized different methods of aerosol market data depending on the type of information we’re trying to uncover in our research.
Market Research Efforts: Bottom-up Approach for estimating and forecasting demand size and opportunity, top-down Approach for new product forecasting and penetration, and combined approach of both Bottom-up and Top-down for full coverage analysis.
Value-Chain-Based Sizing & Forecasting: Supply-side estimates for understanding potential revenue through competitive benchmarking, forecasting, and penetration modeling.
Demand-side estimates for identifying parent and ancillary markets, segment modeling, and heuristic forecasting.
Qualitative Functional Deployment (QFD) Modelling for market share assessment.
Market formulation and validation: We mine the data collected to establish baselines for forecasting, identify trends and opportunities, gain insight into consumer demographics and drivers, and so much more. We utilize different methods of data analysis depending on the type of information we’re trying to uncover in our research.
Market Formulation: This step involves the finalization of market numbers. This step on an internal level is designed to manage outputs from the Data Analysis step.
Data Normalization: The final market estimates and forecasts are then aligned and sent to industry experts, in-panel quality control managers for validation.
This step also entails the finalization of the report scope and data representation pattern.
Validation: The process entails multiple levels of validation. All these steps run in parallel, and the study is forwarded for publishing only if all three levels render validated results.
The aerosol market was categorized into four segments, namely material (Steel, Aluminum), type (Bag-In-Valve, Standard), application (Personal Care, Household, Automotive & Industrial, Food, Paints, Medical), regions (North America, Europe, Asia Pacific, Central & South America, Middle East & Africa).
The aerosol market was segmented into material, type, application, and regions. The demand at a segment level was deduced using a funnel method. Concepts like the TAM, SAM, SOM, etc., were put into practice to understand the demand. We at GVR deploy three methods to deduce market estimates and determine forecasts. These methods are explained below:
Demand estimation of each product across countries/regions summed up to from the total market.
Variable analysis for demand forecast.
Demand estimation via analyzing paid database, and company financials either via annual reports or paid database.
Primary interviews for data revalidation and insight collection.
Used extensively for new product forecasting or analyzing penetration levels.
Tool used invoice product flow and penetration models Use of regression multi-variant analysis for forecasting Involves extensive use of paid and public databases.
Primary interviews and vendor-based primary research for variable impact analysis.
The aerosol market was analyzed at a regional level. The globe was divided into North America, Europe, Asia Pacific, Central & South America, Middle East & Africa, keeping in focus variables like consumption patterns, export-import regulations, consumer expectations, etc. These regions were further divided into twenty-two countries, namely, the U.S.; Canada; Mexico; Germany; France; the UK; Italy; Spain; Netherlands; China; India; Japan; South Korea; Vietnam; Singapore; Australia; Brazil; Argentina; Chile; Saudi Arabia; South Africa; UAE.
All three above-mentioned market research methodologies were applied to arrive at regional-level conclusions. The regions were then summed up to form the global market.
The aerosol market was analyzed via companies operating in the sector. Analyzing these companies and cross-referencing them to the demand equation helped us validate our assumptions and conclusions. Key market players analyzed include:
Henkel AG & Co., KGaA: - Henkel AG & Co., KGaA is a German based chemical product manufacturing company. It has three business segments including laundry & home care, beauty care, and adhesives technologies. Adhesive technologies deal with sealants, adhesives, and functional coating. Beauty care business deals with products for hair, skin, body, and oral applications.
S. C. Johnson & Son, Inc. - S. C. Johnson & Son, Inc. manufactures a range of consumer chemicals and household cleaning products. It has headquarters in Wisconsin, U.S. The company operates with several brands for several applications. Some of the popular brands include BAYCLIN, DUCK, Echo, Lysoform, pledge, Windex, Baygon, Raid, Ziploc, Woly, Carnu, and others.
Uniliver - Unilever has operations in over 190 countries, with major regional offices in India, Australia, the Philippines, the UK, the Netherlands, and Germany. Its product portfolio comprises foods & beverages, personal care products, and cleaning agents. Major brands of the company include Dove, Axe/Lynx, Sure, Vaseline, Knorr, Lipton, Lux, and Tresemme. The company underwent expansion through a series of mergers & acquisitions, which include Lipton, Brook Bond, Best Foods, and Ben & Jerry’s.
Procter & Gamble - The product portfolio of Procter & Gamble includes skincare, healthcare, house care, hair care, oral care, and food products with over 300 brands. Procter & Gamble caters to various end-use industries including fabric care & home care, beauty, baby care & family care, grooming, and healthcare.
Crabtree & Evelyn - Crabtree & Evelyn is a family-run multinational luxury company. Various product categories offered by the company are hand care, fragrance, bath & body, home fragrances & scents, and men’s grooming sub-segments. The company also offers a wide range of customizable products and gifts.
Akzo Nobel N.V. - Akzo Nobel N.V. is a Netherland-based company involved in the manufacturing and marketing of a wide range of chemicals. Its product portfolio is divided into three business segments, namely decorative paints, performance coatings, and specialty chemicals. The company caters its products to building & infrastructure, transportation, consumer goods, and industrial markets.
Beiersdorf AG - NIVEA, Eucerin, La Prairie, Labello, Hansaplast, Florena, and 8x4 are the seven brands offered by the company. Beiersdorf AG has established research centers in Hamburg and laboratories in Brazil, China, India, Japan, Mexico, and the U.S
Estée Lauder Inc. - Estée Lauder Inc. manufactures skincare products, perfumes, and hair care products. It sells the products at 690 company-operated single-brand stores and in 130 multi-brand stores. It manufactures products and introduces new products to the portfolio after extensive research & development regarding the effects of the products on the skin.
Oriflame Cosmetics Global SA - Oriflame has headquarters in Schaffhausen, Switzerland. Oriflame is popular for natural skincare solutions, which are provided through nearly three million independent Oriflame Consultants.
Reckitt Benckiser - Reckitt Benckiser is a is a British-Dutch multinational consumer goods company headquartered in Slough, England. It is a distributor and manufacturer of personal care, nutrition, specialty products, toiletry, household, and health care products.
Supply Side Estimates
Company revenue estimation via referring to annual reports, investor presentations, and Hoover’s.
Segment revenue determination via variable analysis and penetration modeling.
Competitive benchmarking to identify market leaders and their collective revenue shares.
Forecasting via analyzing commercialization rates, pipelines, market initiatives, distribution networks, etc.
Demand side estimates
Identifying parent markets and ancillary markets
Segment penetration analysis to obtain pertinent
revenue/volume
Heuristic forecasting with the help of subject matter experts
Forecasting via variable analysis
Understanding market dynamics (in terms of drivers, restraints, & opportunities) in the countries.
Understanding trends & variables in the individual countries & their impact on growth and using analytical tools to provide high-level insights into the market dynamics and the associated growth pattern.
Understanding market estimates and forecasts (with the base year as 2022, historic information from 2018 to 2021, and forecast from 2023 to 2030). Regional estimates & forecasts for each category are available and are summed up to form the global market estimates.
The report provides market value for the base year 2022 and a yearly forecast till 2030 in terms of revenue/volume or both. The market for each of the segment outlooks has been provided on region & country basis for the above-mentioned forecast period.
The key industry dynamics, major technological trends, and application markets are evaluated to understand their impact on the demand for the forecast period. The growth rates were estimated using correlation, regression, and time-series analysis.
We have used the bottom-up approach for market sizing, analyzing key regional markets, dynamics, & trends for various products and end-users. The total market has been estimated by integrating the country markets.
All market estimates and forecasts have been validated through primary interviews with the key industry participants.
Inflation has not been accounted for to estimate and forecast the market.
Numbers may not add up due to rounding off.
Europe consists of EU-8, Central & Eastern Europe, along with the Commonwealth of Independent States (CIS).
Asia Pacific includes South Asia, East Asia, Southeast Asia, and Oceania (Australia & New Zealand).
Latin America includes Central American countries and the South American continent
Middle East includes Western Asia (as assigned by the UN Statistics Division) and the African continent.
GVR strives to procure the latest and unique information for reports directly from industry experts, which gives it a competitive edge. Quality is of utmost importance to us, therefore every year we focus on increasing our experts’ panel. Primary interviews are one of the critical steps in identifying recent market trends and scenarios. This process enables us to justify and validate our market estimates and forecasts to our clients. With more than 8,000 reports in our database, we have connected with some key opinion leaders across various domains, including healthcare, technology, consumer goods, and the chemical sector. Our process starts with identifying the right platform for a particular type of report, i.e., emails, LinkedIn, seminars, or telephonic conversation, as every report is unique and requires a differentiated approach.
We send out questionnaires to different experts from various regions/ countries, which is dependent on the following factors:
Report/Market scope: If the market study is global, we send questionnaires to industry experts across various regions, including North America, Europe, Asia Pacific, Latin America, and MEA.
Market Penetration: If the market is driven by technological advancements, population density, disease prevalence, or other factors, we identify experts and send out questionnaires based on region or country dominance.
The time to start receiving responses from industry experts varies based on how niche or well-penetrated the market is. Our reports include a detailed chapter on the KoL opinion section, which helps our clients understand the perspective of experts already in the market space.
NEED A CUSTOM REPORT?
We can customize every report - free of charge - including purchasing stand-alone sections or country-level reports, as well as offer affordable discounts for start-ups & universities. Contact us now
We are GDPR and CCPA compliant! Your transaction & personal information is safe and secure. For more details, please read our privacy policy.
"The quality of research they have done for us has been excellent."