U.S. Proptech Market Size & Outlook, 2022-2030
Related Markets
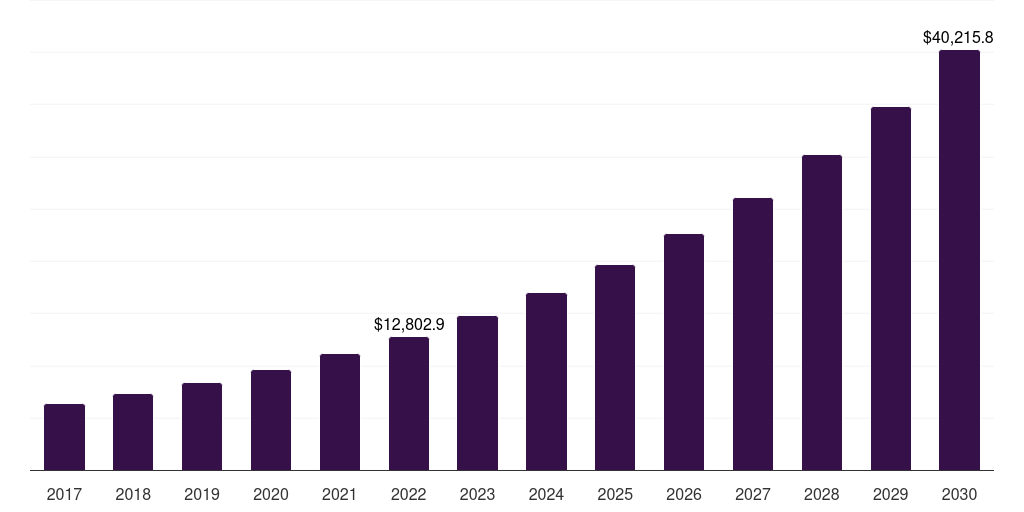
U.S. proptech market highlights
- The U.S. proptech market generated a revenue of USD 12,802.9 million in 2022 and is expected to reach USD 40,215.8 million by 2030.
- The U.S. market is expected to grow at a CAGR of 15.4% from 2023 to 2030.
- In terms of segment, residential was the largest revenue generating property type in 2022.
- Commercial and Industrial is the most lucrative property type segment registering the fastest growth during the forecast period.
Proptech market data book summary
| Market revenue in 2022 | USD 12,802.9 million |
| Market revenue in 2030 | USD 40,215.8 million |
| Growth rate | 15.4% (CAGR from 2022 to 2030) |
| Largest segment | Residential |
| Fastest growing segment | Commercial and Industrial |
| Historical data | 2017 - 2021 |
| Base year | 2022 |
| Forecast period | 2023 - 2030 |
| Quantitative units | Revenue in USD million |
| Market segmentation | Residential, Commercial and Industrial |
| Key market players worldwide | Opendoor Technologies Inc Ordinary Shares - Class A, Altus Group Ltd, Faro Technologies Inc, Zillow Group Inc Class A, Ascendix Technologies, Zumper, Guesty, ManageCasa, Coadjute, VergeSense, Reggora, Enertiv, HomeLight, PropTech Group |
Other key industry trends
- In terms of revenue, U.S. accounted for 44.0% of the global proptech market in 2022.
- Country-wise, U.S. is expected to lead the global market in terms of revenue in 2030.
- In North America, U.S. proptech market is projected to lead the regional market in terms of revenue in 2030.
- Canada is the fastest growing regional market in North America and is projected to reach USD 8,843.8 million by 2030.
No credit card required*
Horizon in a snapshot
- 30K+ Global Market Reports
- 120K+ Country Reports
- 1.2M+ Market Statistics
- 200K+ Company Profiles
- Industry insights and more
PropTech Market Scope
PropTech Market Companies
| Name | Profile | # Employees | HQ | Website |
|---|---|---|---|---|
| PropTech Group | View profile | 51-100 | Sydney, New South Wales, Australia, Oceania | https://www.proptechgroup.ltd/ |
| HomeLight | View profile | 501-1000 | San Francisco, California, United States, North America | https://www.homelight.com |
| Enertiv | View profile | 11-50 | New York, New York, United States, North America | http://www.enertiv.com |
| Reggora | View profile | 51-100 | Boston, Massachusetts, United States, North America | https://www.reggora.com/ |
| VergeSense | View profile | 101-250 | San Francisco, California, United States, North America | http://www.vergesense.com |
| Coadjute | View profile | 11-50 | London, England, United Kingdom, Europe | https://coadjute.com |
| ManageCasa | View profile | 11-50 | San Francisco, California, United States, North America | https://managecasa.com |
| Guesty | View profile | 251-500 | Covina, California, United States, North America | https://www.guesty.com |
| Zumper | View profile | 101-250 | San Francisco, California, United States, North America | https://www.zumper.com |
| Ascendix Technologies | View profile | 101-250 | Dallas, Texas, United States, North America | https://ascendix.com/ |
| Zillow Group Inc Class A | View profile | 6429 | 1301 Second Avenue, Floor 31, Seattle, WA, United States, 98101 | https://www.zillowgroup.com |
| Altus Group Ltd | View profile | 2600 | 33 Yonge Street, Suite 500, Toronto, ON, Canada, M5E 1G4 | https://www.altusgroup.com |
| Opendoor Technologies Inc Ordinary Shares - Class A | View profile | 1982 | 410 N. Scottsdale Road, Suite 1600, Tempe, AZ, United States, 85288 | https://www.opendoor.com |
| Faro Technologies Inc | View profile | 1243 | 125 Technology Park, Lake Mary, FL, United States, 32746 | https://www.faro.com |
U.S. proptech market outlook
The databook is designed to serve as a comprehensive guide to navigating this sector. The databook focuses on market statistics denoted in the form of revenue and y-o-y growth and CAGR across the globe and regions. A detailed competitive and opportunity analyses related to proptech market will help companies and investors design strategic landscapes.
Residential was the largest segment with a revenue share of 57.64% in 2022. Horizon Databook has segmented the U.S. proptech market based on residential, commercial and industrial covering the revenue growth of each sub-segment from 2017 to 2030.
Reasons to subscribe to U.S. proptech market databook:
-
Access to comprehensive data: Horizon Databook provides over 1 million market statistics and 20,000+ reports, offering extensive coverage across various industries and regions.
-
Informed decision making: Subscribers gain insights into market trends, customer preferences, and competitor strategies, empowering informed business decisions.
-
Cost-Effective solution: It's recognized as the world's most cost-effective market research database, offering high ROI through its vast repository of data and reports.
-
Customizable reports: Tailored reports and analytics allow companies to drill down into specific markets, demographics, or product segments, adapting to unique business needs.
-
Strategic advantage: By staying updated with the latest market intelligence, companies can stay ahead of competitors, anticipate industry shifts, and capitalize on emerging opportunities.
Target buyers of U.S. proptech market databook
-
Our clientele includes a mix of proptech market companies, investment firms, advisory firms & academic institutions.
-
30% of our revenue is generated working with investment firms and helping them identify viable opportunity areas.
-
Approximately 65% of our revenue is generated working with competitive intelligence & market intelligence teams of market participants (manufacturers, service providers, etc.).
-
The rest of the revenue is generated working with academic and research not-for-profit institutes. We do our bit of pro-bono by working with these institutions at subsidized rates.
Horizon Databook provides a detailed overview of country-level data and insights on the U.S. proptech market , including forecasts for subscribers. This country databook contains high-level insights into U.S. proptech market from 2017 to 2030, including revenue numbers, major trends, and company profiles.
Partial client list
U.S. proptech market size, by residential, 2017-2030 (US$M)

U.S. PropTech Market Outlook Share, 2022 & 2030 (US$M)


Related industry reports
No records
No related industry reports found.
Related statistics
Sign up - it's easy, and free!
Sign up and get instant basic access to databook, upgrade
when ready, or enjoy our
free plan indefinitely.
Included in Horizon account
- 30K+ Global Market Reports
- 120K+ Country Reports
- 1.2M+ Market Statistics
- 200K+ Company Profiles
- Industry insights and more