U.S. Online Advertising Market Size & Outlook, 2026-2033
Related Markets
U.S. online advertising market highlights
- The U.S. online advertising market generated a revenue of USD 94,091.3 million in 2024 and is expected to reach USD 201,924.8 million by 2030.
- The U.S. market is expected to grow at a CAGR of 13.7% from 2025 to 2030.
- In terms of segment, video advertising was the largest revenue generating type in 2024.
- Full-Screen Interstitials is the most lucrative type segment registering the fastest growth during the forecast period.
Online advertising market data book summary
| Market revenue in 2024 | USD 94,091.3 million |
| Market revenue in 2030 | USD 201,924.8 million |
| Growth rate | 13.7% (CAGR from 2025 to 2030) |
| Largest segment | Video advertising |
| Fastest growing segment | Full-Screen Interstitials |
| Historical data | 2018 - 2023 |
| Base year | 2024 |
| Forecast period | 2025 - 2030 |
| Quantitative units | Revenue in USD million |
| Market segmentation | Native Advertising, Video Advertising, Display Advertising, Full-Screen Interstitials |
| Key market players worldwide | Alphabet Inc Class A, Meta Platforms Inc Class A, Microsoft Corp, Amazon.com Inc, X (formerly Twitter), Tencent Holdings Ltd, Adobe Inc, AOL, Verizon Communications Inc, Baidu Inc ADR |
Other key industry trends
- In terms of revenue, U.S. accounted for 31.6% of the global online advertising market in 2024.
- Country-wise, U.S. is expected to lead the global market in terms of revenue in 2030.
- In North America, U.S. online advertising market is projected to lead the regional market in terms of revenue in 2030.
- Canada is the fastest growing regional market in North America and is projected to reach USD 27,796.3 million by 2030.
No credit card required*
Horizon in a snapshot
- 30K+ Global Market Reports
- 120K+ Country Reports
- 1.2M+ Market Statistics
- 200K+ Company Profiles
- Industry insights and more
Online Advertising Market Scope
Online Advertising Market Companies
| Name | Profile | # Employees | HQ | Website |
|---|---|---|---|---|
| AOL | View profile | 5001-10000 | New York, New York, United States, North America | http://www.aol.com |
| X (formerly Twitter) | View profile | 1001-5000 | San Francisco, California, United States, North America | https://twitter.com/home?lang=en |
| Verizon Communications Inc | View profile | 105400 | 1095 Avenue of the Americas, New York, NY, United States, 10036 | https://www.verizon.com |
| Baidu Inc ADR | View profile | 45500 | No. 10 Shangdi 10th Street, Baidu Campus, Haidian District, Beijing, China, People's Republic of, 100085 | https://ir.baidu.com |
| Meta Platforms Inc Class A | View profile | 69329 | 1 Meta Way, Menlo Park, CA, United States, 94025 | https://about.meta.com |
| Adobe Inc | View profile | 29945 | 345 Park Avenue, San Jose, CA, United States, 95110-2704 | https://www.adobe.com |
| Alphabet Inc Class A | View profile | 180895 | 1600 Amphitheatre Parkway, Mountain View, CA, United States, 94043 | https://www.abc.xyz |
| Tencent Holdings Ltd | View profile | 104787 | No. 33 Haitian 2nd Road, Tencent Binhai Towers, Nanshan District, Shenzhen, China, People's Republic of, 518054 | http://www.tencent.com |
| Microsoft Corp | View profile | 221000 | One Microsoft Way, Redmond, WA, United States, 98052-6399 | https://www.microsoft.com |
| Amazon.com Inc | View profile | 1525000 | 410 Terry Avenue North, Seattle, WA, United States, 98109-5210 | https://www.amazon.com |
U.S. online advertising market outlook
The databook is designed to serve as a comprehensive guide to navigating this sector. The databook focuses on market statistics denoted in the form of revenue and y-o-y growth and CAGR across the globe and regions. A detailed competitive and opportunity analyses related to online advertising market will help companies and investors design strategic landscapes.
Video advertising was the largest segment with a revenue share of 40.68% in 2025. Horizon Databook has segmented the U.S. online advertising market based on native advertising, video advertising, display advertising, full-screen interstitials covering the revenue growth of each sub-segment from 2021 to 2033.
The online advertising market in the U.S. has witnessed remarkable growth in recent years owing to the widespread adoption of smartphones and the increasing prevalence of high-speed internet connectivity. According to Broad band Now, 206.4 million Americans, representing approximately 62% of the total population, have access to high-speed 5G coverage in their homes.
This proliferation of the internet and subsequently digital channels has prompted businesses to shift their advertising budgets from traditional media to online advertisement. Another key factor is the continuous evolution of data analytics and Artificial Intelligence (AI) technologies.
Advertisers in the U.S. are leveraging these technologies to gain deeper insights into consumer behavior, which allows them to develop personalized and targeted advertising strategies.
Reasons to subscribe to U.S. online advertising market databook:
-
Access to comprehensive data: Horizon Databook provides over 1 million market statistics and 20,000+ reports, offering extensive coverage across various industries and regions.
-
Informed decision making: Subscribers gain insights into market trends, customer preferences, and competitor strategies, empowering informed business decisions.
-
Cost-Effective solution: It's recognized as the world's most cost-effective market research database, offering high ROI through its vast repository of data and reports.
-
Customizable reports: Tailored reports and analytics allow companies to drill down into specific markets, demographics, or product segments, adapting to unique business needs.
-
Strategic advantage: By staying updated with the latest market intelligence, companies can stay ahead of competitors, anticipate industry shifts, and capitalize on emerging opportunities.
Target buyers of U.S. online advertising market databook
-
Our clientele includes a mix of online advertising market companies, investment firms, advisory firms & academic institutions.
-
30% of our revenue is generated working with investment firms and helping them identify viable opportunity areas.
-
Approximately 65% of our revenue is generated working with competitive intelligence & market intelligence teams of market participants (manufacturers, service providers, etc.).
-
The rest of the revenue is generated working with academic and research not-for-profit institutes. We do our bit of pro-bono by working with these institutions at subsidized rates.
Horizon Databook provides a detailed overview of country-level data and insights on the U.S. online advertising market, including forecasts for subscribers. This country databook contains high-level insights into U.S. online advertising market from 2021 to 2033, including revenue numbers, major trends, and company profiles.
Partial client list
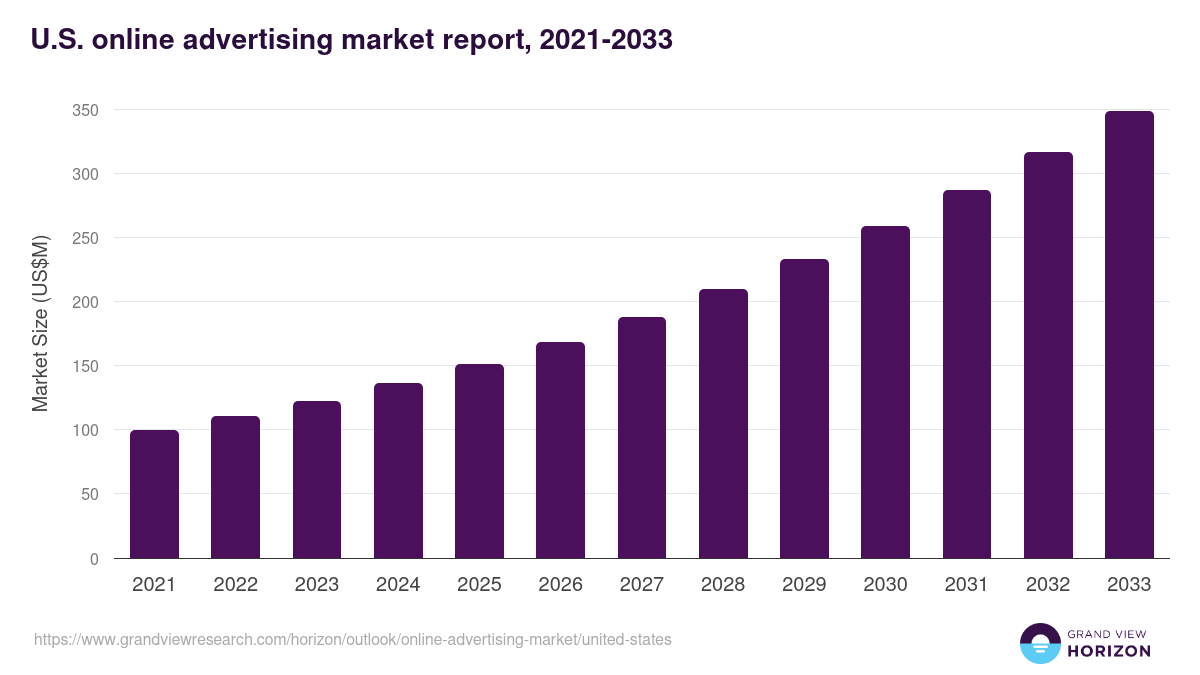
U.S. online advertising market report size, by type, 2021-2033 (US$M)

U.S. Online Advertising Market Share, 2025 & 2033 (US$M)


Related statistics
Sign up - it's easy, and free!
Sign up and get instant basic access to databook, upgrade
when ready, or enjoy our
free plan indefinitely.
Included in Horizon account
- 30K+ Global Market Reports
- 120K+ Country Reports
- 1.2M+ Market Statistics
- 200K+ Company Profiles
- Industry insights and more