North America In-app Purchase Market Size & Outlook
Related Markets
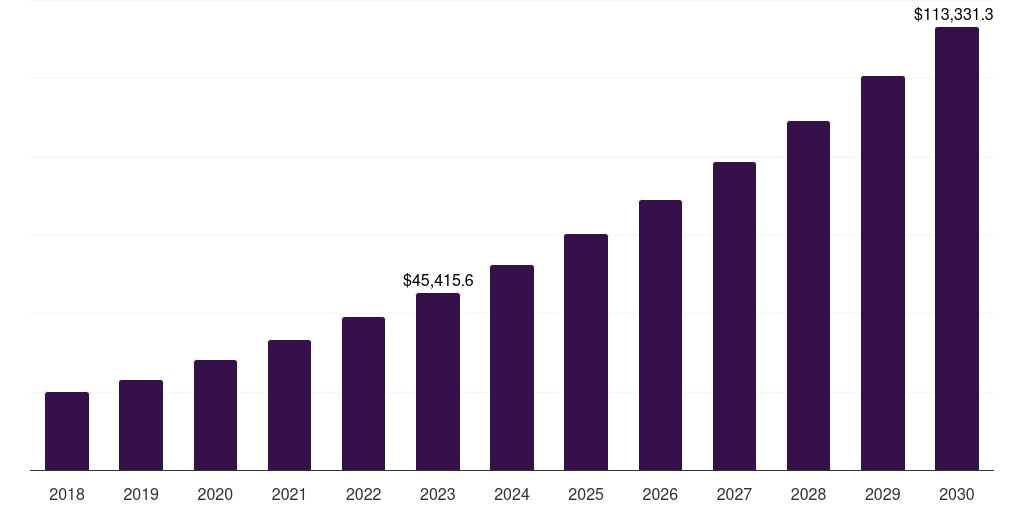
North America in-app purchase market highlights
- The North America in-app purchase market generated a revenue of USD 45,415.5 million in 2023.
- The market is expected to grow at a CAGR of 14% from 2024 to 2030.
- In terms of segment, ios was the largest revenue generating operating system in 2023.
- Android is the most lucrative operating system segment registering the fastest growth during the forecast period.
- Country-wise, Canada is expected to register the highest CAGR from 2024 to 2030.
North America data book summary
| Market revenue in 2023 | USD 45,415.5 million |
| Market revenue in 2030 | USD 113,331.3 million |
| Growth rate | 14% (CAGR from 2023 to 2030) |
| Largest segment | Ios |
| Fastest growing segment | Android |
| Historical data covered | 2018 - 2022 |
| Base year for estimation | 2023 |
| Forecast period covered | 2024 - 2030 |
| Quantitative units | Revenue in USD million |
| Market segmentation | Android, IOS |
| Key market players worldwide | Apple Inc, The Walt Disney Co, Alphabet Inc Class A, Netflix Inc, PubMatic Inc Ordinary Shares - Class A, Roblox Corp Ordinary Shares - Class A, Britvic PLC, Microsoft Corp, Creative Clicks, AdMaven, PocketGuard, Brainly, Recurly |
Other key industry trends
- In terms of revenue, North America region accounted for 23.6% of the global in-app purchase market in 2023.
- Globally, Asia Pacific is projected to lead the regional market in terms of revenue in 2030.
- Latin America is the fastest growing regional market and is projected to reach USD 37,927.1 million by 2030.
No credit card required*
Horizon in a snapshot
- 30K+ Global Market Reports
- 120K+ Country Reports
- 1.2M+ Market Statistics
- 200K+ Company Profiles
- Industry insights and more
In-app Purchase Market Scope
In-app Purchase Market Companies
| Name | Profile | # Employees | HQ | Website |
|---|---|---|---|---|
| Recurly | View profile | 251-500 | San Francisco, California, United States, North America | http://recurly.com |
| Brainly | View profile | 251-500 | Kraków, Malopolskie, Poland, Europe | https://brainly.com |
| PocketGuard | View profile | 1-10 | Palo Alto, California, United States, North America | http://pocketguard.com |
| AdMaven | View profile | 101-250 | Tel Aviv-yafo, Tel Aviv, Israel, Asia | https://ad-maven.com/?source_id=crunc151120 |
| Creative Clicks | View profile | 101-250 | Amsterdam, Noord-Holland, The Netherlands, Europe | http://creativeclicks.com |
| Britvic PLC | View profile | 4529 | Breakspear Way, Breakspear Park, Hemel Hempstead, Hertfordshire, United Kingdom, HP2 4TZ | https://www.britvic.com |
| Roblox Corp Ordinary Shares - Class A | View profile | 2457 | 970 Park Place, San Mateo, CA, United States, 94403 | https://www.corp.roblox.com |
| PubMatic Inc Ordinary Shares - Class A | View profile | 948 | 601 Marshall Street, Redwood City, CA, United States, 94063 | https://www.pubmatic.com |
| Netflix Inc | View profile | 13000 | 121 Albright Way, Los Gatos, CA, United States, 95032 | https://www.netflix.com |
| The Walt Disney Co | View profile | 225000 | 500 South Buena Vista Street, Burbank, CA, United States, 91521 | https://www.thewaltdisneycompany.com |
| Alphabet Inc Class A | View profile | 180895 | 1600 Amphitheatre Parkway, Mountain View, CA, United States, 94043 | https://www.abc.xyz |
| Microsoft Corp | View profile | 221000 | One Microsoft Way, Redmond, WA, United States, 98052-6399 | https://www.microsoft.com |
| Apple Inc | View profile | 161000 | One Apple Park Way, Cupertino, CA, United States, 95014 | https://www.apple.com |
North America in-app purchase market outlook
The databook is designed to serve as a comprehensive guide to navigating this sector. The databook focuses on market statistics denoted in the form of revenue and y-o-y growth and CAGR across the globe and regions. A detailed competitive and opportunity analyses related to in-app purchase market will help companies and investors design strategic landscapes.
Ios was the largest segment with a revenue share of 50.46% in 2023. Horizon Databook has segmented the North America in-app purchase market based on android, ios covering the revenue growth of each sub-segment from 2018 to 2030.
Reasons to subscribe to North America in-app purchase market databook:
-
Access to comprehensive data: Horizon Databook provides over 1 million market statistics and 20,000+ reports, offering extensive coverage across various industries and regions.
-
Informed decision making: Subscribers gain insights into market trends, customer preferences, and competitor strategies, empowering informed business decisions.
-
Cost-Effective solution: It's recognized as the world's most cost-effective market research database, offering high ROI through its vast repository of data and reports.
-
Customizable reports: Tailored reports and analytics allow companies to drill down into specific markets, demographics, or product segments, adapting to unique business needs.
-
Strategic advantage: By staying updated with the latest market intelligence, companies can stay ahead of competitors, anticipate industry shifts, and capitalize on emerging opportunities.
Target buyers of North America in-app purchase market databook
-
Our clientele includes a mix of in-app purchase market companies, investment firms, advisory firms & academic institutions.
-
30% of our revenue is generated working with investment firms and helping them identify viable opportunity areas.
-
Approximately 65% of our revenue is generated working with competitive intelligence & market intelligence teams of market participants (manufacturers, service providers, etc.).
-
The rest of the revenue is generated working with academic and research not-for-profit institutes. We do our bit of pro-bono by working with these institutions at subsidized rates.
Horizon Databook provides a detailed overview of continent-level data and insights on the North America in-app purchase market , including forecasts for subscribers. This continent databook contains high-level insights into North America in-app purchase market from 2018 to 2030, including revenue numbers, major trends, and company profiles.
Partial client list
North America in-app purchase market size, by country, 2018-2030 (US$M)

North America In-app Purchase Market Outlook Share, 2023 & 2030 (US$M)


Related statistics
Sign up - it's easy, and free!
Sign up and get instant basic access to databook, upgrade
when ready, or enjoy our
free plan indefinitely.
Included in Horizon account
- 30K+ Global Market Reports
- 120K+ Country Reports
- 1.2M+ Market Statistics
- 200K+ Company Profiles
- Industry insights and more