Asia Pacific Gaming Market Size & Outlook, 2025-2030
Related Markets
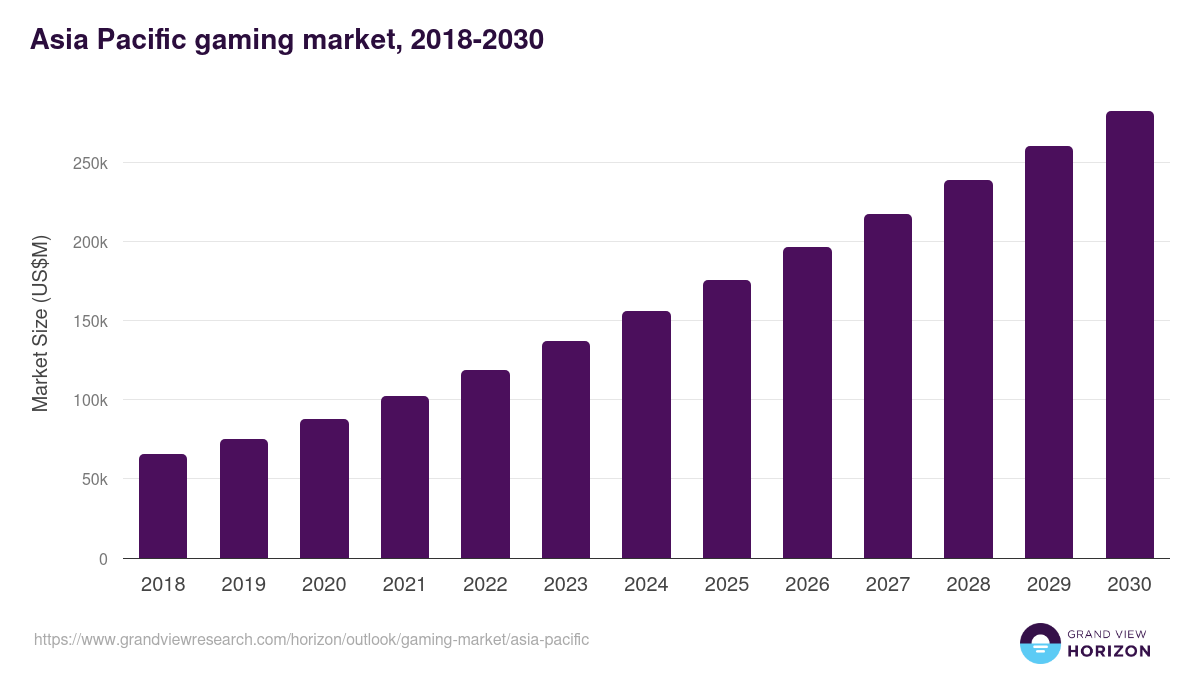
Asia Pacific gaming market highlights
- The Asia Pacific gaming market generated a revenue of USD 155,808.4 million in 2024.
- The market is expected to grow at a CAGR of 9.9% from 2025 to 2030.
- In terms of segment, mobile was the largest revenue generating device in 2024.
- Mobile is the most lucrative device segment registering the fastest growth during the forecast period.
- Country-wise, India is expected to register the highest CAGR from 2025 to 2030.
Asia Pacific data book summary
| Market revenue in 2024 | USD 155,808.4 million |
| Market revenue in 2030 | USD 282,033.2 million |
| Growth rate | 9.9% (CAGR from 2025 to 2030) |
| Largest segment | Mobile |
| Fastest growing segment | Mobile |
| Historical data covered | 2018 - 2023 |
| Base year for estimation | 2024 |
| Forecast period covered | 2025 - 2030 |
| Quantitative units | Revenue in USD million |
| Market segmentation | Console, Mobile, Computer |
| Key market players worldwide | Nintendo Co Ltd, Microsoft Corp, NVIDIA Corp, Sega Sammy Holdings Inc, Sony Group Corp, PlayJam, BlueStacks |
Other key industry trends
- In terms of revenue, Asia Pacific region accounted for 52.3% of the global gaming market in 2024.
- Globally, Asia Pacific is projected to lead the regional market in terms of revenue in 2030.
- Asia Pacific is the fastest growing regional market and is projected to reach USD 282,033.2 million by 2030.
No credit card required*
Horizon in a snapshot
- 30K+ Global Market Reports
- 120K+ Country Reports
- 1.2M+ Market Statistics
- 200K+ Company Profiles
- Industry insights and more
Gaming Market Scope
Gaming Market Companies
| Name | Profile | # Employees | HQ | Website |
|---|---|---|---|---|
| BlueStacks | View profile | 251-500 | Campbell, California, United States, North America | https://www.bluestacks.com/ |
| PlayJam | View profile | 11-50 | London, England, United Kingdom, Europe | http://www.playjam.com |
| Sega Sammy Holdings Inc | View profile | 10869 | Shiodome Sumitomo Building 21F, 1-9-2 Higashi Shimbashi, Minato-ku, Tokyo, Japan, 105-0021 | http://www.segasammy.co.jp |
| Nintendo Co Ltd | View profile | 7317 | 11-1 Hokotate-cho, Kamitoba, Minami-ku, Kyoto, Japan, 601-8501 | http://www.nintendo.co.jp |
| Sony Group Corp | View profile | 113000 | 7-1, Konan 1-Chome, Minato-ku, Tokyo, Japan, 108-0075 | https://www.sony.com |
| NVIDIA Corp | View profile | 29600 | 2788 San Tomas Expressway, Santa Clara, CA, United States, 95051 | https://www.nvidia.com |
| Microsoft Corp | View profile | 221000 | One Microsoft Way, Redmond, WA, United States, 98052-6399 | https://www.microsoft.com |
Asia Pacific gaming market outlook
The databook is designed to serve as a comprehensive guide to navigating this sector. The databook focuses on market statistics denoted in the form of revenue and y-o-y growth and CAGR across the globe and regions. A detailed competitive and opportunity analyses related to gaming market will help companies and investors design strategic landscapes.
Mobile was the largest segment with a revenue share of 53.52% in 2024. Horizon Databook has segmented the Asia Pacific gaming market based on console, mobile, computer covering the revenue growth of each sub-segment from 2018 to 2030.
The Asia Pacific region has the highest number of gamers and the market is dominated by local players. However, more games are expected to be adopted by foreign publishers over the coming years.
Counterfeiting and game piracy is rampant in the Asia Pacific region with China and Thailand being the key countries contributing to the issue. How ever, the trend of cloud gaming is gaining popularity in the region, which is anticipated to substantially minimize the impact of piracy.
China overtook the U.S. in 2015 to emerge as the global gaming capital generating almost a quarter of the global gaming revenues. This can be largely attributed to China’s move of lifting a long-standing 14-year ban on the manufacturing and sale of gaming consoles.
Reasons to subscribe to Asia Pacific gaming market databook:
-
Access to comprehensive data: Horizon Databook provides over 1 million market statistics and 20,000+ reports, offering extensive coverage across various industries and regions.
-
Informed decision making: Subscribers gain insights into market trends, customer preferences, and competitor strategies, empowering informed business decisions.
-
Cost-Effective solution: It's recognized as the world's most cost-effective market research database, offering high ROI through its vast repository of data and reports.
-
Customizable reports: Tailored reports and analytics allow companies to drill down into specific markets, demographics, or product segments, adapting to unique business needs.
-
Strategic advantage: By staying updated with the latest market intelligence, companies can stay ahead of competitors, anticipate industry shifts, and capitalize on emerging opportunities.
Target buyers of Asia Pacific gaming market databook
-
Our clientele includes a mix of gaming market companies, investment firms, advisory firms & academic institutions.
-
30% of our revenue is generated working with investment firms and helping them identify viable opportunity areas.
-
Approximately 65% of our revenue is generated working with competitive intelligence & market intelligence teams of market participants (manufacturers, service providers, etc.).
-
The rest of the revenue is generated working with academic and research not-for-profit institutes. We do our bit of pro-bono by working with these institutions at subsidized rates.
Horizon Databook provides a detailed overview of continent-level data and insights on the Asia Pacific gaming market , including forecasts for subscribers. This continent databook contains high-level insights into Asia Pacific gaming market from 2018 to 2030, including revenue numbers, major trends, and company profiles.
Partial client list
Asia Pacific gaming market size, by country, 2018-2030 (US$M)

Asia Pacific Gaming Market Outlook Share, 2024 & 2030 (US$M)


Related statistics
Sign up - it's easy, and free!
Sign up and get instant basic access to databook, upgrade
when ready, or enjoy our
free plan indefinitely.
Included in Horizon account
- 30K+ Global Market Reports
- 120K+ Country Reports
- 1.2M+ Market Statistics
- 200K+ Company Profiles
- Industry insights and more