U.S. Active Pharmaceutical Ingredients Market Size & Outlook
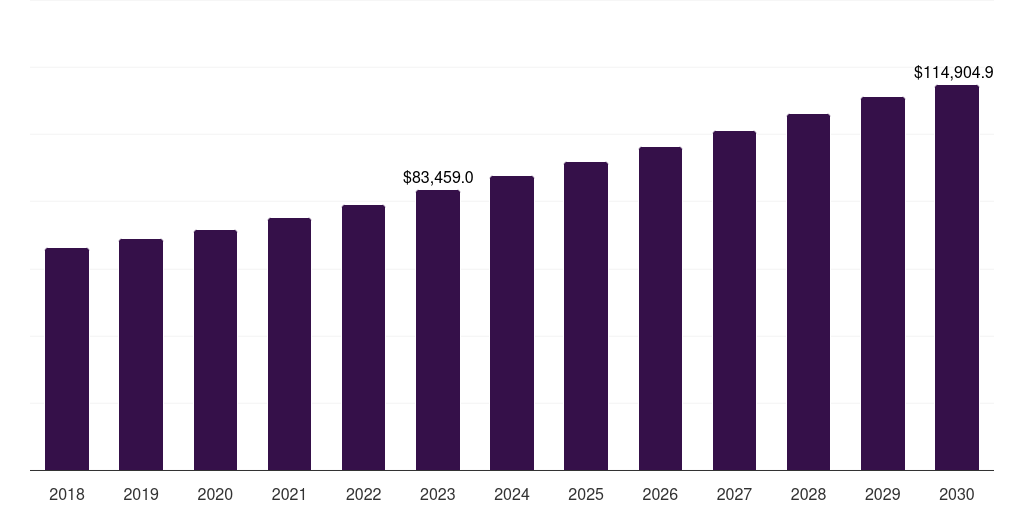
U.S. active pharmaceutical ingredients market, 2018-2030 (US$M)
Related Markets
U.S. active pharmaceutical ingredients market highlights
- The U.S. active pharmaceutical ingredients market generated a revenue of USD 87,462.1 million in 2024 and is expected to reach USD 115,138.8 million by 2030.
- The U.S. market is expected to grow at a CAGR of 4.6% from 2025 to 2030.
- In terms of segment, synthetic was the largest revenue generating type in 2024.
- Biotech is the most lucrative type segment registering the fastest growth during the forecast period.
Active pharmaceutical ingredients market data book summary
| Market revenue in 2024 | USD 87,462.1 million |
| Market revenue in 2030 | USD 115,138.8 million |
| Growth rate | 4.6% (CAGR from 2025 to 2030) |
| Largest segment | Synthetic |
| Fastest growing segment | Biotech |
| Historical data | 2018 - 2023 |
| Base year | 2024 |
| Forecast period | 2025 - 2030 |
| Quantitative units | Revenue in USD million |
| Market segmentation | Biotech, Synthetic |
| Key market players worldwide | Dr. Reddy’s Laboratories, Sun Pharmaceutical Industries, Teva Pharmaceutical Industries Ltd, Cipla Ltd DR, AbbVie Inc, Aurobindo Pharma, Sandoz Group AG Registered Shares, Viatris Inc, Fresenius Kabi |
Other key industry trends
- In terms of revenue, U.S. accounted for 34.3% of the global active pharmaceutical ingredients market in 2024.
- Country-wise, U.S. is expected to lead the global market in terms of revenue in 2030.
- In North America, U.S. active pharmaceutical ingredients market is projected to lead the regional market in terms of revenue in 2030.
- Canada is the fastest growing regional market in North America and is projected to reach USD 11,866.3 million by 2030.
No credit card required*
Horizon in a snapshot
- 30K+ Global Market Reports
- 120K+ Country Reports
- 1.2M+ Market Statistics
- 200K+ Company Profiles
- Industry insights and more
Active Pharmaceutical Ingredients Market Scope
Active Pharmaceutical Ingredients Market Companies
| Name | Profile | # Employees | HQ | Website |
|---|
U.S. active pharmaceutical ingredients market outlook
The databook is designed to serve as a comprehensive guide to navigating this sector. The databook focuses on market statistics denoted in the form of revenue and y-o-y growth and CAGR across the globe and regions. A detailed competitive and opportunity analyses related to active pharmaceutical ingredients market will help companies and investors design strategic landscapes.
Synthetic was the largest segment with a revenue share of 74.32% in 2024. Horizon Databook has segmented the U.S. active pharmaceutical ingredients market based on biotech, synthetic covering the revenue growth of each sub-segment from 2018 to 2030.
Presence of key players such as AbbVie Inc.; Curia; Pfizer Inc. (Pfizer Center One); Viatris Inc.; and Fresenius Kabi AG is positively influencing the market growth. For instance, in February 2022, Viatris received FDA approval for Generic Restasis a cyclosporine ophthalmic emulsion for the treatment of dry eye disease.
The market in the U.S. shows high-value manufacturing areas, including complex & high potent APIs, gene therapies & biologicals, which is expected to provide relative growth to the market. Moreover, there is significant expansion of innovators and CDMOs seen in the country, which is expected to create an expanded advantage for manufacturing and commercializing APIs.
Reasons to subscribe to U.S. active pharmaceutical ingredients market databook:
-
Access to comprehensive data: Horizon Databook provides over 1 million market statistics and 20,000+ reports, offering extensive coverage across various industries and regions.
-
Informed decision making: Subscribers gain insights into market trends, customer preferences, and competitor strategies, empowering informed business decisions.
-
Cost-Effective solution: It's recognized as the world's most cost-effective market research database, offering high ROI through its vast repository of data and reports.
-
Customizable reports: Tailored reports and analytics allow companies to drill down into specific markets, demographics, or product segments, adapting to unique business needs.
-
Strategic advantage: By staying updated with the latest market intelligence, companies can stay ahead of competitors, anticipate industry shifts, and capitalize on emerging opportunities.
Target buyers of U.S. active pharmaceutical ingredients market databook
-
Our clientele includes a mix of active pharmaceutical ingredients market companies, investment firms, advisory firms & academic institutions.
-
30% of our revenue is generated working with investment firms and helping them identify viable opportunity areas.
-
Approximately 65% of our revenue is generated working with competitive intelligence & market intelligence teams of market participants (manufacturers, service providers, etc.).
-
The rest of the revenue is generated working with academic and research not-for-profit institutes. We do our bit of pro-bono by working with these institutions at subsidized rates.
Horizon Databook provides a detailed overview of country-level data and insights on the U.S. active pharmaceutical ingredients market , including forecasts for subscribers. This country databook contains high-level insights into U.S. active pharmaceutical ingredients market from 2018 to 2030, including revenue numbers, major trends, and company profiles.
Partial client list
U.S. active pharmaceutical ingredients market size, by type, 2018-2030 (US$M)

U.S. Active Pharmaceutical Ingredients Market Outlook Share, 2024 & 2030 (US$M)


Related industry reports
Related regional statistics
No records
No related regions found.
Sign up - it's easy, and free!
Sign up and get instant basic access to databook, upgrade
when ready, or enjoy our
free plan indefinitely.
Included in Horizon account
- 30K+ Global Market Reports
- 120K+ Country Reports
- 1.2M+ Market Statistics
- 200K+ Company Profiles
- Industry insights and more