Middle East & Africa Active Pharmaceutical Ingredients Market Size & Outlook
Related Markets
MEA active pharmaceutical ingredients market highlights
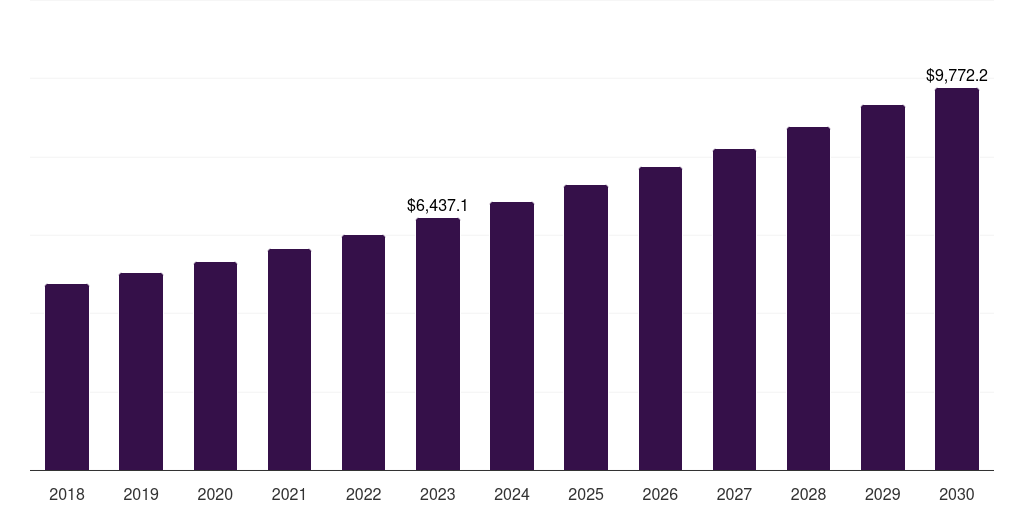
- The MEA active pharmaceutical ingredients market generated a revenue of USD 6,924.6 million in 2024.
- The market is expected to grow at a CAGR of 6.2% from 2025 to 2030.
- In terms of segment, synthetic was the largest revenue generating type in 2024.
- Biotech is the most lucrative type segment registering the fastest growth during the forecast period.
- Country-wise, UAE is expected to register the highest CAGR from 2025 to 2030.
MEA data book summary
| Market revenue in 2024 | USD 6,924.6 million |
| Market revenue in 2030 | USD 9,952.6 million |
| Growth rate | 6.2% (CAGR from 2025 to 2030) |
| Largest segment | Synthetic |
| Fastest growing segment | Biotech |
| Historical data covered | 2018 - 2023 |
| Base year for estimation | 2024 |
| Forecast period covered | 2025 - 2030 |
| Quantitative units | Revenue in USD million |
| Market segmentation | Biotech, Synthetic |
| Key market players worldwide | Dr. Reddy’s Laboratories, Sun Pharmaceutical Industries, Teva Pharmaceutical Industries Ltd, Cipla Ltd DR, AbbVie Inc, Aurobindo Pharma, Sandoz Group AG Registered Shares, Viatris Inc, Fresenius Kabi |
Other key industry trends
- In terms of revenue, MEA region accounted for 2.7% of the global active pharmaceutical ingredients market in 2024.
- Globally, North America is projected to lead the regional market in terms of revenue in 2030.
- Asia Pacific is the fastest growing regional market and is projected to reach USD 127,721.4 million by 2030.
No credit card required*
Horizon in a snapshot
- 30K+ Global Market Reports
- 120K+ Country Reports
- 1.2M+ Market Statistics
- 200K+ Company Profiles
- Industry insights and more
Active Pharmaceutical Ingredients Market Scope
Active Pharmaceutical Ingredients Market Companies
| Name | Profile | # Employees | HQ | Website |
|---|---|---|---|---|
| Sandoz Group AG Registered Shares | View profile | 23848 | Forum 1, Novartis Campus, Basel, Switzerland, CH-4056 | https://www.sandoz.com |
| Fresenius Kabi | View profile | 1001-5000 | Gurgaon, Haryana, India, Asia | https://www.fresenius-kabi-oncology.com/ |
| Viatris Inc | View profile | 38000 | 1000 Mylan Boulevard, Canonsburg, PA, United States, 15317 | https://www.viatris.com |
| Dr. Reddy’s Laboratories | View profile | 10001+ | Hyderabad, Andhra Pradesh, India, Asia | http://www.drreddys.com/ |
| Sun Pharmaceutical Industries | View profile | 10001+ | Mumbai, Maharashtra, India, Asia | http://www.sunpharma.com |
| Aurobindo Pharma | View profile | 10001+ | Hyderabad, Andhra Pradesh, India, Asia | http://aurobindo.com |
| Cipla Ltd DR | View profile | 38955 | Ganpatrao Kadam Marg, Cipla House, Peninsula Business Park, Lower Parel, Mumbai, MH, India, 400 013 | https://www.cipla.com |
| AbbVie Inc | View profile | 50000 | 1 North Waukegan Road, North Chicago, IL, United States, 60064-6400 | http://www.abbvieinvestor.com |
| Teva Pharmaceutical Industries Ltd | View profile | 37851 | 124 Dvora HaNevi’a Street, Tel Aviv, Israel, 6944020 | https://www.tevapharm.com |
Middle East & Africa active pharmaceutical ingredients market outlook
The databook is designed to serve as a comprehensive guide to navigating this sector. The databook focuses on market statistics denoted in the form of revenue and y-o-y growth and CAGR across the globe and regions. A detailed competitive and opportunity analyses related to active pharmaceutical ingredients market will help companies and investors design strategic landscapes.
Synthetic was the largest segment with a revenue share of 75.33% in 2024. Horizon Databook has segmented the Middle East & Africa active pharmaceutical ingredients market based on biotech, synthetic covering the revenue growth of each sub-segment from 2018 to 2030.
Various initiatives being undertaken by the government to raise awareness about various diseases, especially infectious diseases, are expected to boost market growth. Increasing spending by the government to raise awareness about lifestyle diseases is expected to create growth opportunities for key players in the market .Government policies facilitating export of APIs are creating growth opportunities in the market.
High proportion of the low income patient population in South Africa is expected to hamper the market growth. Lack of government investment in development of pharmaceutical industry may lead to a decline in the growth rate of the market in the region.
Reasons to subscribe to Middle East & Africa active pharmaceutical ingredients market databook:
-
Access to comprehensive data: Horizon Databook provides over 1 million market statistics and 20,000+ reports, offering extensive coverage across various industries and regions.
-
Informed decision making: Subscribers gain insights into market trends, customer preferences, and competitor strategies, empowering informed business decisions.
-
Cost-Effective solution: It's recognized as the world's most cost-effective market research database, offering high ROI through its vast repository of data and reports.
-
Customizable reports: Tailored reports and analytics allow companies to drill down into specific markets, demographics, or product segments, adapting to unique business needs.
-
Strategic advantage: By staying updated with the latest market intelligence, companies can stay ahead of competitors, anticipate industry shifts, and capitalize on emerging opportunities.
Target buyers of Middle East & Africa active pharmaceutical ingredients market databook
-
Our clientele includes a mix of active pharmaceutical ingredients market companies, investment firms, advisory firms & academic institutions.
-
30% of our revenue is generated working with investment firms and helping them identify viable opportunity areas.
-
Approximately 65% of our revenue is generated working with competitive intelligence & market intelligence teams of market participants (manufacturers, service providers, etc.).
-
The rest of the revenue is generated working with academic and research not-for-profit institutes. We do our bit of pro-bono by working with these institutions at subsidized rates.
Horizon Databook provides a detailed overview of continent-level data and insights on the Middle East & Africa active pharmaceutical ingredients market , including forecasts for subscribers. This continent databook contains high-level insights into Middle East & Africa active pharmaceutical ingredients market from 2018 to 2030, including revenue numbers, major trends, and company profiles.
Partial client list
MEA active pharmaceutical ingredients market size, by country, 2018-2030 (US$M)

Middle East & Africa Active Pharmaceutical Ingredients Market Outlook Share, 2024 & 2030 (US$M)


Related industry reports
Related statistics
No records
No related statistics found.
Sign up - it's easy, and free!
Sign up and get instant basic access to databook, upgrade
when ready, or enjoy our
free plan indefinitely.
Included in Horizon account
- 30K+ Global Market Reports
- 120K+ Country Reports
- 1.2M+ Market Statistics
- 200K+ Company Profiles
- Industry insights and more