North America Virtual Shopping Assistant Market Size & Outlook
Related Markets
North America virtual shopping assistant market highlights
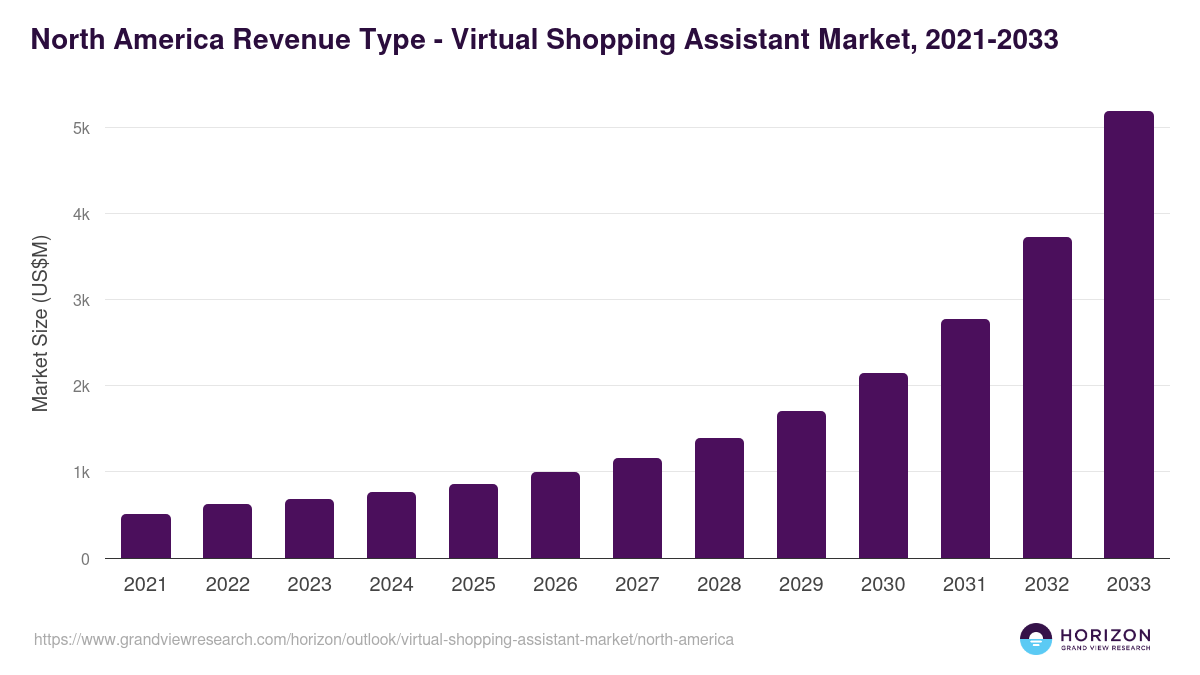
- The North America virtual shopping assistant market generated a revenue of USD 765.7 million in 2024.
- The market is expected to grow at a CAGR of 25.1% from 2025 to 2033.
- In terms of segment, subscription-based model was the largest revenue generating revenue type in 2024.
- Per Purchase Model (Pay-As-You-Go) is the most lucrative revenue type segment registering the fastest growth during the forecast period.
- Country-wise, Mexico is expected to register the highest CAGR from 2025 to 2033.
North America data book summary
| Market revenue in 2024 | USD 765.7 million |
| Market revenue in 2033 | USD 5,193.1 million |
| Growth rate | 25.1% (CAGR from 2025 to 2033) |
| Largest segment | Subscription-based model |
| Fastest growing segment | Per Purchase Model (Pay-As-You-Go) |
| Historical data covered | 2021 - 2023 |
| Base year for estimation | 2024 |
| Forecast period covered | 2025 - 2033 |
| Quantitative units | Revenue in USD million |
| Market segmentation | Subscription-Based Model, Paid App (One-Time Purchase), Per Purchase Model (Pay-As-You-Go), Advertising-Supported Model |
Other key industry trends
- In terms of revenue, North America region accounted for 29.1% of the global virtual shopping assistant market in 2024.
- Globally, Asia Pacific is projected to lead the regional market in terms of revenue in 2033.
- MEA is the fastest growing regional market and is projected to reach USD 2,284.8 million by 2033.
No credit card required*
Horizon in a snapshot
- 30K+ Global Market Reports
- 120K+ Country Reports
- 1.2M+ Market Statistics
- 200K+ Company Profiles
- Industry insights and more
Virtual Shopping Assistant Market Scope
Virtual Shopping Assistant Market Companies
| Name | Profile | # Employees | HQ | Website |
|---|---|---|---|---|
| Yuka | View profile | 1-10 | Paris, Ile-de-France, France, Europe | https://yuka.io |
| Xcelore | View profile | 51-100 | Noida, Uttar Pradesh, India, Asia | https://xcelore.com |
| ShopSavvy | View profile | 251-500 | San Francisco, California, United States, North America | http://shopsavvy.com |
| Rep AI | View profile | 11-50 | Middletown, Delaware, United States, North America | https://www.hellorep.ai |
| ModeSens | View profile | 11-50 | Dallas, Texas, United States, North America | https://modesens.com |
| Manifest AI | View profile | 51-100 | Palo Alto, California, United States, North America | https://getmanifest.ai |
| i95Dev | View profile | 101-250 | Iselin, New Jersey, United States, North America | http://www.i95dev.com |
| Copilotly | View profile | 1-10 | Bangalore, Karnataka, India, Asia | https://www.copilotly.com |
| Deepgram | View profile | 51-100 | San Francisco, California, United States, North America | https://deepgram.com/ |
| MyFitnessPal | View profile | 51-100 | San Francisco, California, United States, North America | https://www.myfitnesspal.com/ |
| Digital Realty | View profile | 1001-5000 | Austin, Texas, United States, North America | http://www.digitalrealty.com |
| Noom | View profile | 1001-5000 | New York, New York, United States, North America | http://www.noom.com |
| Alibaba Group Holding Ltd ADR | View profile | 204891 | 1 Matheson Street, Causeway Bay, 26th Floor, Tower One, Times Square, Hong Kong, Hong Kong, | https://www.alibabagroup.com |
| Amazon.com Inc | View profile | 1525000 | 410 Terry Avenue North, Seattle, WA, United States, 98109-5210 | https://www.amazon.com |
North America virtual shopping assistant market outlook
The databook is designed to serve as a comprehensive guide to navigating this sector. The databook focuses on market statistics denoted in the form of revenue and y-o-y growth and CAGR across the globe and regions. A detailed competitive and opportunity analyses related to virtual shopping assistant market will help companies and investors design strategic landscapes.
Subscription-based model was the largest segment with a revenue share of 34.95% in 2024. Horizon Databook has segmented the North America virtual shopping assistant market based on subscription-based model, paid app (one-time purchase), per purchase model (pay-as-you-go), advertising-supported model covering the revenue growth of each sub-segment from 2021 to 2033.
Reasons to subscribe to North America virtual shopping assistant market databook:
-
Access to comprehensive data: Horizon Databook provides over 1 million market statistics and 20,000+ reports, offering extensive coverage across various industries and regions.
-
Informed decision making: Subscribers gain insights into market trends, customer preferences, and competitor strategies, empowering informed business decisions.
-
Cost-Effective solution: It's recognized as the world's most cost-effective market research database, offering high ROI through its vast repository of data and reports.
-
Customizable reports: Tailored reports and analytics allow companies to drill down into specific markets, demographics, or product segments, adapting to unique business needs.
-
Strategic advantage: By staying updated with the latest market intelligence, companies can stay ahead of competitors, anticipate industry shifts, and capitalize on emerging opportunities.
Target buyers of North America virtual shopping assistant market databook
-
Our clientele includes a mix of virtual shopping assistant market companies, investment firms, advisory firms & academic institutions.
-
30% of our revenue is generated working with investment firms and helping them identify viable opportunity areas.
-
Approximately 65% of our revenue is generated working with competitive intelligence & market intelligence teams of market participants (manufacturers, service providers, etc.).
-
The rest of the revenue is generated working with academic and research not-for-profit institutes. We do our bit of pro-bono by working with these institutions at subsidized rates.
Horizon Databook provides a detailed overview of continent-level data and insights on the North America virtual shopping assistant market , including forecasts for subscribers. This continent databook contains high-level insights into North America virtual shopping assistant market from 2021 to 2033, including revenue numbers, major trends, and company profiles.
Partial client list
North America virtual shopping assistant market size, by country, 2021-2033 (US$M)

North America Virtual Shopping Assistant Market Outlook Share, 2024 & 2033 (US$M)


Related industry reports
Related statistics
Sign up - it's easy, and free!
Sign up and get instant basic access to databook, upgrade
when ready, or enjoy our
free plan indefinitely.
Included in Horizon account
- 30K+ Global Market Reports
- 120K+ Country Reports
- 1.2M+ Market Statistics
- 200K+ Company Profiles
- Industry insights and more