Asia Pacific Spectacles Market Size & Outlook, 2025-2030
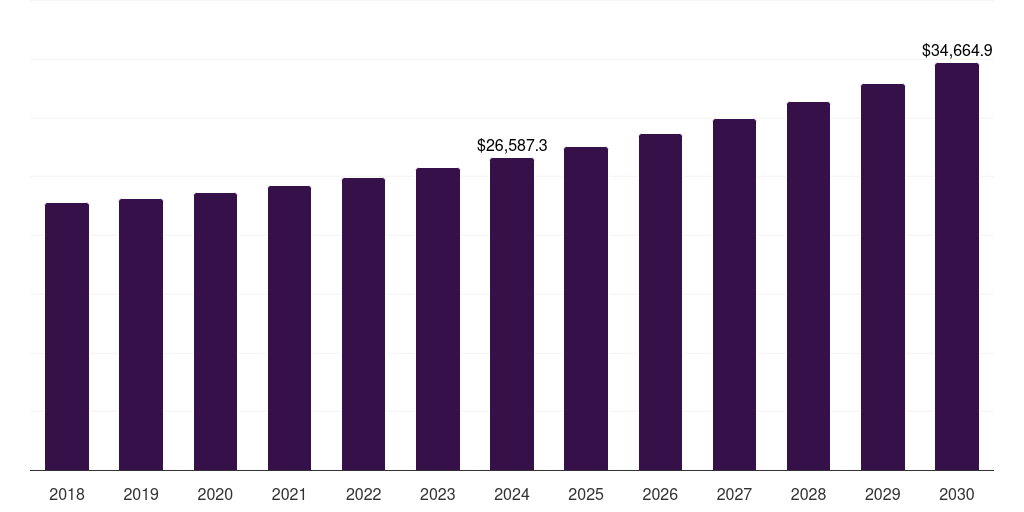
The spectacles market in Asia Pacific is expected to reach a projected revenue of US$ 34,664.9 million by 2030. A compound annual growth rate of 4.7% is expected of Asia Pacific spectacles market from 2025 to 2030.
Revenue, 2024 (US$M)
$26,587.3
Forecast, 2030 (US$M)
$34,664.9
CAGR, 2025 - 2030
4.7%
Report Coverage
Asia Pacific
Related Markets
Asia Pacific spectacles market highlights
- The Asia Pacific spectacles market generated a revenue of USD 26,587.3 million in 2024.
- The market is expected to grow at a CAGR of 4.7% from 2025 to 2030.
- In terms of segment, lenses was the largest revenue generating parts in 2024.
- Frames is the most lucrative parts segment registering the fastest growth during the forecast period.
- Country-wise, China is expected to register the highest CAGR from 2025 to 2030.
Asia Pacific data book summary
| Market revenue in 2024 | USD 26,587.3 million |
| Market revenue in 2030 | USD 34,664.9 million |
| Growth rate | 4.7% (CAGR from 2025 to 2030) |
| Largest segment | Lenses |
| Fastest growing segment | Frames |
| Historical data covered | 2018 - 2023 |
| Base year for estimation | 2024 |
| Forecast period covered | 2025 - 2030 |
| Quantitative units | Revenue in USD million |
| Market segmentation | Frames, Lenses |
Other key industry trends
- In terms of revenue, Asia Pacific region accounted for 29.5% of the global spectacles market in 2024.
- Globally, North America is projected to lead the regional market in terms of revenue in 2030.
- Asia Pacific is the fastest growing regional market and is projected to reach USD 34,664.9 million by 2030.
No credit card required*
Horizon in a snapshot
- 30K+ Global Market Reports
- 120K+ Country Reports
- 1.2M+ Market Statistics
- 200K+ Company Profiles
- Industry insights and more
Spectacles Market Scope
Spectacles market segmentation & scope
Spectacles Market Companies
| Name | Profile | # Employees | HQ | Website |
|---|---|---|---|---|
| MODO Eyewear | View profile | 11-50 | New York, New York, United States, North America | http://modo.com |
| Titan Company | View profile | 5001-10000 | Hosur, Tamil Nadu, India, Asia | http://www.titan.co.in |
| Lenskart | View profile | 10001+ | Gurgaon, Haryana, India, Asia | http://www.lenskart.com |
| Warby Parker | View profile | 1001-5000 | New York, New York, United States, North America | http://www.warbyparker.com |
| Johnson & Johnson Vision Care, Inc. | View profile | - | - | - |
| Essilor | View profile | 10001+ | Charenton-le-pont, Ile-de-France, France, Europe | http://essilor.com |
| Zenni Optical | View profile | 501-1000 | Novato, California, United States, North America | https://www.zennioptical.com |
| Hoya Corp | View profile | 36571 | 20th Floor Nishi-Shinjuku Building, 6-10-1, Nishi-Shinjuku, Shinjuku-ku, Tokyo, Japan, 160-8347 | http://www.hoya.co.jp |
| ZEISS Group | View profile | 10001+ | Oberkochen, Baden-Wurttemberg, Germany, Europe | http://www.zeiss.com |
| Alcon Inc | View profile | 25315 | Chemin de Blandonnet 8, Royce Bedward, Vernier, Geneva, Switzerland, 1214 | https://www.alcon.com |
Asia Pacific spectacles market size, by country, 2018-2030 (US$M)

Asia Pacific Spectacles Market Outlook Share, 2024 & 2030 (US$M)


Related statistics
Sign up - it's easy, and free!
Sign up and get instant basic access to databook, upgrade
when ready, or enjoy our
free plan indefinitely.
Included in Horizon account
- 30K+ Global Market Reports
- 120K+ Country Reports
- 1.2M+ Market Statistics
- 200K+ Company Profiles
- Industry insights and more