U.S. Space Tourism Market Size & Outlook, 2023-2030
Related Markets
U.S. space tourism market highlights
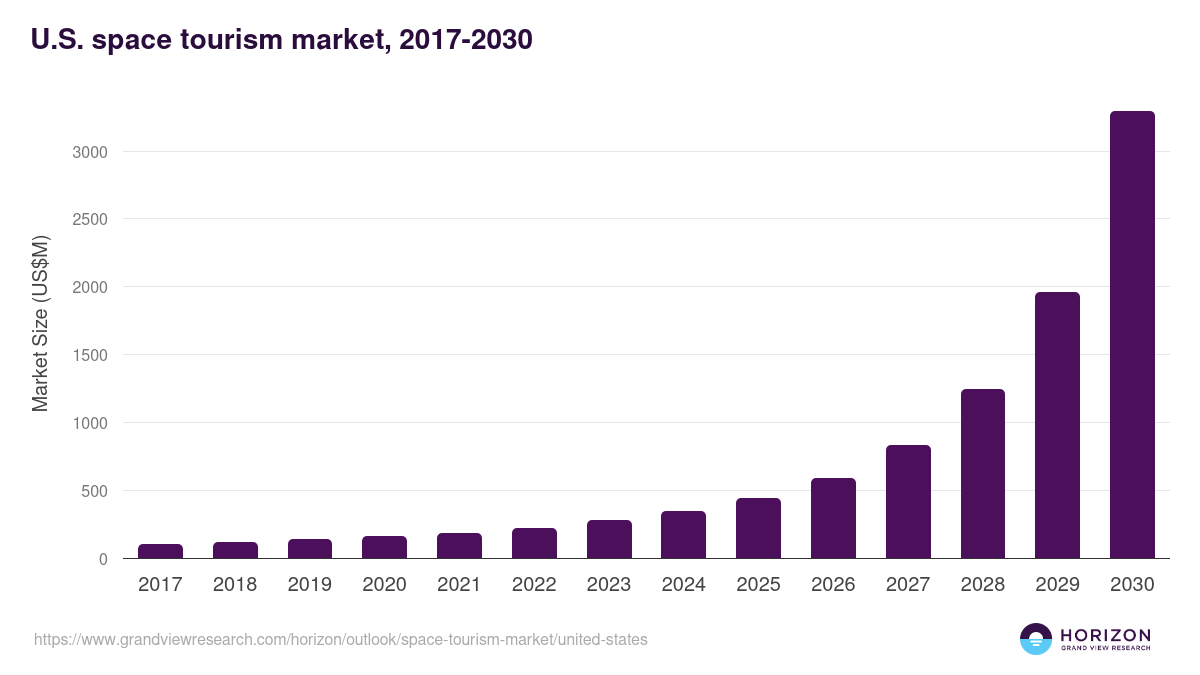
- The U.S. space tourism market generated a revenue of USD 286.9 million in 2023 and is expected to reach USD 3,402.2 million by 2030.
- The U.S. market is expected to grow at a CAGR of 42.4% from 2024 to 2030.
- In terms of segment, sub-orbital was the largest revenue generating type in 2023.
- Orbital is the most lucrative type segment registering the fastest growth during the forecast period.
Space tourism market data book summary
| Market revenue in 2023 | USD 286.9 million |
| Market revenue in 2030 | USD 3,402.2 million |
| Growth rate | 42.4% (CAGR from 2023 to 2030) |
| Largest segment | Sub-orbital |
| Fastest growing segment | Orbital |
| Historical data | 2017 - 2022 |
| Base year | 2023 |
| Forecast period | 2024 - 2030 |
| Quantitative units | Revenue in USD million |
| Market segmentation | Orbital, Sub-orbital |
| Key market players worldwide | Virgin Galactic Holdings Inc Shs A, Airbus SE, Boeing Co, Rocket Lab USA Inc, Blue Origin, SpaceX, Zero Gravity Solutions Inc, Axiom Space, Space Adventures, Zero 2 Infinity |
Other key industry trends
- In terms of revenue, U.S. accounted for 32.3% of the global space tourism market in 2023.
- Country-wise, U.S. is expected to lead the global market in terms of revenue in 2030.
- In North America, U.S. space tourism market is projected to lead the regional market in terms of revenue in 2030.
- Canada is the fastest growing regional market in North America and is projected to reach USD 744.0 million by 2030.
No credit card required*
Horizon in a snapshot
- 30K+ Global Market Reports
- 120K+ Country Reports
- 1.2M+ Market Statistics
- 200K+ Company Profiles
- Industry insights and more
Space Tourism Market Scope
Space Tourism Market Companies
| Name | Profile | # Employees | HQ | Website |
|---|---|---|---|---|
| Zero 2 Infinity | View profile | 11-50 | Barbará, Catalonia, Spain, Europe | http://www.zero2infinity.space |
| Space Adventures | View profile | 11-50 | Vienna, Virginia, United States, North America | https://spaceadventures.com/ |
| Axiom Space | View profile | 501-1000 | Houston, Texas, United States, North America | http://www.axiomspace.com |
| Zero Gravity Solutions Inc | View profile | 17 | 190 North West Spanish River Boulevard, Boca Raton, FL, United States, 33431 | http://www.zerogsi.com |
| Blue Origin | View profile | 10001+ | Kent, Washington, United States, North America | http://www.blueorigin.com |
| SpaceX | View profile | 1001-5000 | Hawthorne, California, United States, North America | https://www.spacex.com |
| Boeing Co | View profile | 171000 | 929 Long Bridge Drive, Arlington, VA, United States, 22202 | https://www.boeing.com |
| Rocket Lab USA Inc | View profile | 1650 | 3881 McGowen Street, Long Beach, CA, United States, 90808 | https://www.rocketlabusa.com |
| Virgin Galactic Holdings Inc Shs A | View profile | 805 | 1700 Flight Way, Tustin, CA, United States, 92782 | https://www.virgingalactic.com |
| Airbus SE | View profile | 150093 | P.O. Box 32008, Leiden, ZH, Netherlands, 2303 DA | https://www.airbus.com |
U.S. space tourism market outlook
The databook is designed to serve as a comprehensive guide to navigating this sector. The databook focuses on market statistics denoted in the form of revenue and y-o-y growth and CAGR across the globe and regions. A detailed competitive and opportunity analyses related to space tourism market will help companies and investors design strategic landscapes.
Sub-orbital was the largest segment with a revenue share of 50.78% in 2023. Horizon Databook has segmented the U.S. space tourism market based on orbital, sub-orbital covering the revenue growth of each sub-segment from 2017 to 2030.
Continuous advances in technology are playing a significant role in driving the growth of space tourism. Private companies such as SpaceX, Blue Origin, and Virgin Galactic have made remarkable strides in developing reusable rockets and spacecraft. T
hese advancements have lowered the cost of space travel and improved the safety and reliability of space vehicles. The ability to reuse rockets and spacecraft reduces the overall expenses involved in launching missions, making it more economically viable for private companies to enter the space tourism market.
Reasons to subscribe to U.S. space tourism market databook:
-
Access to comprehensive data: Horizon Databook provides over 1 million market statistics and 20,000+ reports, offering extensive coverage across various industries and regions.
-
Informed decision making: Subscribers gain insights into market trends, customer preferences, and competitor strategies, empowering informed business decisions.
-
Cost-Effective solution: It's recognized as the world's most cost-effective market research database, offering high ROI through its vast repository of data and reports.
-
Customizable reports: Tailored reports and analytics allow companies to drill down into specific markets, demographics, or product segments, adapting to unique business needs.
-
Strategic advantage: By staying updated with the latest market intelligence, companies can stay ahead of competitors, anticipate industry shifts, and capitalize on emerging opportunities.
Target buyers of U.S. space tourism market databook
-
Our clientele includes a mix of space tourism market companies, investment firms, advisory firms & academic institutions.
-
30% of our revenue is generated working with investment firms and helping them identify viable opportunity areas.
-
Approximately 65% of our revenue is generated working with competitive intelligence & market intelligence teams of market participants (manufacturers, service providers, etc.).
-
The rest of the revenue is generated working with academic and research not-for-profit institutes. We do our bit of pro-bono by working with these institutions at subsidized rates.
Horizon Databook provides a detailed overview of country-level data and insights on the U.S. space tourism market , including forecasts for subscribers. This country databook contains high-level insights into U.S. space tourism market from 2017 to 2030, including revenue numbers, major trends, and company profiles.
Partial client list
U.S. space tourism market size, by type, 2017-2030 (US$M)

U.S. Space Tourism Market Outlook Share, 2023 & 2030 (US$M)


Related industry reports
Related statistics
Sign up - it's easy, and free!
Sign up and get instant basic access to databook, upgrade
when ready, or enjoy our
free plan indefinitely.
Included in Horizon account
- 30K+ Global Market Reports
- 120K+ Country Reports
- 1.2M+ Market Statistics
- 200K+ Company Profiles
- Industry insights and more